

Prerequisite.
We will install Suricata IDS and ElasticStack on the following servers
・1st server Suricata IDS & Filebeat : Debian12.5 IP address (192.168.11.83)
・2nd server ElasticStack & kibana : Ubunru22.04 IP address(192.168.11.100)
1st server Suricata Install
SURICATA IDS/IPS is an open source IDS that monitors communications on the network and detects suspicious traffic. Its basic mechanism is signature-based, so it can detect predefined unauthorized communications. Suricata is also characterized by its ability to provide protection as well as detection.
1.Suricata Install
①Install required packages
|
1 |
# apt install wget curl software-properties-common dirmngr apt-transport-https gnupg2 ca-certificates lsb-release debian-archive-keyring unzip -y |
➁Suricata install
|
1 2 |
# apt update # apt install suricata |
Check Version
|
1 2 |
# suricata -V This is Suricata version 6.0.10 RELEASE |
Stop the Suricata service as it needs to be configured first.
|
1 |
# systemctl stop suricata |
2.Configure Suricata
①Determine interface and IP address where Suricata will inspect network packets
|
1 2 3 |
# ip --brief add lo UNKNOWN 127.0.0.1/8 ::1/128 ens33 UP 192.168.11.83/24 fe80::20c:29ff:fef9:86e2/64 |
Edit /etc/suricata/suricata.yaml file
|
1 2 3 4 5 6 7 8 9 10 |
# vi /etc/suricata/suricata.yaml # Line 132 : change community-id: false → community-id: true # Line 589 : change af-packet: - interface: eth0 ↓ af-packet: - interface: ens33 ←Change to your own interface name |
➁Add rule set
|
1 2 3 4 5 6 7 8 9 10 11 12 13 14 15 16 17 18 19 20 21 22 23 24 25 26 27 28 29 30 31 32 33 34 35 36 37 38 39 40 41 42 43 |
# suricata-update -o /etc/suricata/rules 13/2/2024 -- 14:27:58 - <Info> -- Using data-directory /var/lib/suricata. 13/2/2024 -- 14:27:58 - <Info> -- Using Suricata configuration /etc/suricata/suricata.yaml 13/2/2024 -- 14:27:58 - <Info> -- Using /etc/suricata/rules for Suricata provided rules. 13/2/2024 -- 14:27:58 - <Info> -- Found Suricata version 6.0.10 at /usr/bin/suricata. 13/2/2024 -- 14:27:58 - <Info> -- Loading /etc/suricata/suricata.yaml 13/2/2024 -- 14:27:58 - <Info> -- Disabling rules for protocol http2 13/2/2024 -- 14:27:58 - <Info> -- Disabling rules for protocol modbus 13/2/2024 -- 14:27:58 - <Info> -- Disabling rules for protocol dnp3 13/2/2024 -- 14:27:58 - <Info> -- Disabling rules for protocol enip 13/2/2024 -- 14:27:58 - <Info> -- No sources configured, will use Emerging Threats Open 13/2/2024 -- 14:27:58 - <Info> -- Fetching https://rules.emergingthreats.net/open/suricata-6.0.10/emerging.rules.tar.gz. 100% - 4232677/4232677 13/2/2024 -- 14:28:00 - <Info> -- Done. 13/2/2024 -- 14:28:01 - <Info> -- Loading distribution rule file /etc/suricata/rules/app-layer-events.rules 13/2/2024 -- 14:28:01 - <Info> -- Loading distribution rule file /etc/suricata/rules/decoder-events.rules 13/2/2024 -- 14:28:01 - <Info> -- Loading distribution rule file /etc/suricata/rules/dhcp-events.rules 13/2/2024 -- 14:28:01 - <Info> -- Loading distribution rule file /etc/suricata/rules/dnp3-events.rules 13/2/2024 -- 14:28:01 - <Info> -- Loading distribution rule file /etc/suricata/rules/dns-events.rules 13/2/2024 -- 14:28:01 - <Info> -- Loading distribution rule file /etc/suricata/rules/files.rules 13/2/2024 -- 14:28:01 - <Info> -- Loading distribution rule file /etc/suricata/rules/http-events.rules 13/2/2024 -- 14:28:01 - <Info> -- Loading distribution rule file /etc/suricata/rules/ipsec-events.rules 13/2/2024 -- 14:28:01 - <Info> -- Loading distribution rule file /etc/suricata/rules/kerberos-events.rules 13/2/2024 -- 14:28:01 - <Info> -- Loading distribution rule file /etc/suricata/rules/modbus-events.rules 13/2/2024 -- 14:28:01 - <Info> -- Loading distribution rule file /etc/suricata/rules/nfs-events.rules 13/2/2024 -- 14:28:01 - <Info> -- Loading distribution rule file /etc/suricata/rules/ntp-events.rules 13/2/2024 -- 14:28:01 - <Info> -- Loading distribution rule file /etc/suricata/rules/smb-events.rules 13/2/2024 -- 14:28:01 - <Info> -- Loading distribution rule file /etc/suricata/rules/smtp-events.rules 13/2/2024 -- 14:28:01 - <Info> -- Loading distribution rule file /etc/suricata/rules/stream-events.rules 13/2/2024 -- 14:28:01 - <Info> -- Loading distribution rule file /etc/suricata/rules/tls-events.rules 13/2/2024 -- 14:28:01 - <Info> -- Ignoring file rules/emerging-deleted.rules 13/2/2024 -- 14:28:02 - <Info> -- Loaded 47405 rules. 13/2/2024 -- 14:28:02 - <Info> -- Disabled 14 rules. 13/2/2024 -- 14:28:02 - <Info> -- Enabled 0 rules. 13/2/2024 -- 14:28:02 - <Info> -- Modified 0 rules. 13/2/2024 -- 14:28:02 - <Info> -- Dropped 0 rules. 13/2/2024 -- 14:28:03 - <Info> -- Enabled 134 rules for flowbit dependencies. 13/2/2024 -- 14:28:03 - <Info> -- Backing up current rules. 13/2/2024 -- 14:28:03 - <Info> -- Writing rules to /etc/suricata/rules/suricata.rules: total: 47405; enabled: 36599; added: 47405; removed 0; modified: 0 13/2/2024 -- 14:28:03 - <Info> -- Writing /etc/suricata/rules/classification.config 13/2/2024 -- 14:28:03 - <Info> -- Testing with suricata -T. 13/2/2024 -- 14:28:25 - <Info> -- Done. |
Indicates that suricata-update has retrieved the free Emerging Threats ET Open Rules and saved it to Suricata's /etc/suricata/rules/suricata.rules file.
It also shows the number of rules processed, in this example 47405 were added, of which 36599 were activated.
➂Adding Rule Set Providers
List Default Providers
|
1 2 3 4 5 6 7 8 9 10 11 12 13 14 15 16 17 18 19 20 21 22 23 24 25 26 27 28 29 30 31 32 33 34 35 36 37 38 39 40 41 42 43 44 45 46 47 48 49 50 51 52 53 54 55 56 57 58 59 60 61 62 63 64 65 66 67 68 69 70 71 72 73 74 75 76 77 78 79 80 81 82 83 84 85 86 87 88 89 90 91 92 93 94 95 |
# suricata-update list-sources Name: et/open Vendor: Proofpoint Summary: Emerging Threats Open Ruleset License: MIT Name: et/pro Vendor: Proofpoint Summary: Emerging Threats Pro Ruleset License: Commercial Replaces: et/open Parameters: secret-code Subscription: https://www.proofpoint.com/us/threat-insight/et-pro-ruleset Name: oisf/trafficid Vendor: OISF Summary: Suricata Traffic ID ruleset License: MIT Name: scwx/enhanced Vendor: Secureworks Summary: Secureworks suricata-enhanced ruleset License: Commercial Parameters: secret-code Subscription: https://www.secureworks.com/contact/ (Please reference CTU Countermeasures) Name: scwx/malware Vendor: Secureworks Summary: Secureworks suricata-malware ruleset License: Commercial Parameters: secret-code Subscription: https://www.secureworks.com/contact/ (Please reference CTU Countermeasures) Name: scwx/security Vendor: Secureworks Summary: Secureworks suricata-security ruleset License: Commercial Parameters: secret-code Subscription: https://www.secureworks.com/contact/ (Please reference CTU Countermeasures) Name: sslbl/ssl-fp-blacklist Vendor: Abuse.ch Summary: Abuse.ch SSL Blacklist License: Non-Commercial Name: sslbl/ja3-fingerprints Vendor: Abuse.ch Summary: Abuse.ch Suricata JA3 Fingerprint Ruleset License: Non-Commercial Name: etnetera/aggressive Vendor: Etnetera a.s. Summary: Etnetera aggressive IP blacklist License: MIT Name: tgreen/hunting Vendor: tgreen Summary: Threat hunting rules License: GPLv3 Name: malsilo/win-malware Vendor: malsilo Summary: Commodity malware rules License: MIT Name: stamus/lateral Vendor: Stamus Networks Summary: Lateral movement rules License: GPL-3.0-only Name: stamus/nrd-30-open Vendor: Stamus Networks Summary: Newly Registered Domains Open only - 30 day list, complete License: Commercial Parameters: secret-code Subscription: https://www.stamus-networks.com/stamus-labs/subscribe-to-threat-intel-feed Name: stamus/nrd-14-open Vendor: Stamus Networks Summary: Newly Registered Domains Open only - 14 day list, complete License: Commercial Parameters: secret-code Subscription: https://www.stamus-networks.com/stamus-labs/subscribe-to-threat-intel-feed Name: stamus/nrd-entropy-30-open Vendor: Stamus Networks Summary: Newly Registered Domains Open only - 30 day list, high entropy License: Commercial Parameters: secret-code Subscription: https://www.stamus-networks.com/stamus-labs/subscribe-to-threat-intel-feed Name: stamus/nrd-entropy-14-open Vendor: Stamus Networks Summary: Newly Registered Domains Open only - 14 day list, high entropy License: Commercial Parameters: secret-code Subscription: https://www.stamus-networks.com/stamus-labs/subscribe-to-threat-intel-feed Name: stamus/nrd-phishing-30-open Vendor: Stamus Networks Summary: Newly Registered Domains Open only - 30 day list, phishing License: Commercial Parameters: secret-code Subscription: https://www.stamus-networks.com/stamus-labs/subscribe-to-threat-intel-feed Name: stamus/nrd-phishing-14-open Vendor: Stamus Networks Summary: Newly Registered Domains Open only - 14 day list, phishing License: Commercial Parameters: secret-code Subscription: https://www.stamus-networks.com/stamus-labs/subscribe-to-threat-intel-feed |
If you include the tgreen/hunting ruleset as an example
|
1 2 3 4 5 6 7 8 9 |
# suricata-update enable-source tgreen/hunting 13/2/2024 -- 14:34:42 - <Info> -- Using data-directory /var/lib/suricata. 13/2/2024 -- 14:34:42 - <Info> -- Using Suricata configuration /etc/suricata/suricata.yaml 13/2/2024 -- 14:34:42 - <Info> -- Using /etc/suricata/rules for Suricata provided rules. 13/2/2024 -- 14:34:42 - <Info> -- Found Suricata version 6.0.10 at /usr/bin/suricata. 13/2/2024 -- 14:34:42 - <Info> -- Creating directory /var/lib/suricata/update/sources 13/2/2024 -- 14:34:42 - <Info> -- Enabling default source et/open 13/2/2024 -- 14:34:42 - <Info> -- Source tgreen/hunting enabled |
Perform update
|
1 |
# suricata-update -o /etc/suricata/rules |
3.Suricata Configuration Testing
①Run Verification Tool
|
1 2 3 4 5 6 7 8 9 10 11 12 13 |
# suricata -T -c /etc/suricata/suricata.yaml -v 13/2/2024 -- 14:51:27 - <Info> - Running suricata under test mode 13/2/2024 -- 14:51:27 - <Notice> - This is Suricata version 6.0.10 RELEASE running in SYSTEM mode 13/2/2024 -- 14:51:27 - <Info> - CPUs/cores online: 2 13/2/2024 -- 14:51:27 - <Info> - fast output device (regular) initialized: fast.log 13/2/2024 -- 14:51:27 - <Info> - eve-log output device (regular) initialized: eve.json 13/2/2024 -- 14:51:27 - <Info> - stats output device (regular) initialized: stats.log 13/2/2024 -- 14:51:39 - <Info> - 1 rule files processed. 36848 rules successfully loaded, 0 rules failed 13/2/2024 -- 14:51:39 - <Info> - Threshold config parsed: 0 rule(s) found 13/2/2024 -- 14:51:39 - <Info> - 36851 signatures processed. 1192 are IP-only rules, 5056 are inspecting packet payload, 30397 inspect application layer, 108 are decoder event only 13/2/2024 -- 14:51:46 - <Notice> - Configuration provided was successfully loaded. Exiting. 13/2/2024 -- 14:51:46 - <Info> - cleaning up signature grouping structure... complete |
Suricata service restart
|
1 |
# systemctl start suricata |
|
1 2 3 4 5 6 7 8 9 10 11 12 13 14 15 16 17 18 19 |
# systemctl status suricata ● suricata.service - Suricata IDS/IDP daemon Loaded: loaded (/lib/systemd/system/suricata.service; enabled; preset: enabled) Active: active (running) since Tue 2024-02-13 14:55:24 JST; 42s ago Docs: man:suricata(8) man:suricatasc(8) https://suricata-ids.org/docs/ Process: 5428 ExecStart=/usr/bin/suricata -D --af-packet -c /etc/suricata/suricata.yaml --pidfile /run/suricata.pid (code=exited, status=0/SU> Main PID: 5430 (Suricata-Main) Tasks: 8 (limit: 4603) Memory: 507.6M CPU: 20.049s CGroup: /system.slice/suricata.service mq5430 /usr/bin/suricata -D --af-packet -c /etc/suricata/suricata.yaml --pidfile /run/suricata.pid Feb 13 14:55:24 Lepard systemd[1]: Starting suricata.service - Suricata IDS/IDP daemon... Feb 13 14:55:24 Lepard suricata[5428]: 13/2/2024 -- 14:55:24 - <Notice> - This is Suricata version 6.0.10 RELEASE running in SYSTEM mode Feb 13 14:55:24 Lepard systemd[1]: Started suricata.service - Suricata IDS/IDP daemon. |
Check log files
|
1 2 3 4 5 6 7 8 9 10 11 12 |
# tail -f /var/log/suricata/suricata.log 13/2/2024 -- 14:55:24 - <Info> - fast output device (regular) initialized: fast.log 13/2/2024 -- 14:55:24 - <Info> - eve-log output device (regular) initialized: eve.json 13/2/2024 -- 14:55:24 - <Info> - stats output device (regular) initialized: stats.log 13/2/2024 -- 14:55:36 - <Info> - 1 rule files processed. 36848 rules successfully loaded, 0 rules failed 13/2/2024 -- 14:55:36 - <Info> - Threshold config parsed: 0 rule(s) found 13/2/2024 -- 14:55:37 - <Info> - 36851 signatures processed. 1192 are IP-only rules, 5056 are inspecting packet payload, 30397 inspect application layer, 108 are decoder event only 13/2/2024 -- 14:55:44 - <Info> - Going to use 2 thread(s) 13/2/2024 -- 14:55:44 - <Info> - Using unix socket file '/var/run/suricata-command.socket' 13/2/2024 -- 14:55:44 - <Notice> - all 2 packet processing threads, 4 management threads initialized, engine started. 13/2/2024 -- 14:55:44 - <Info> - All AFP capture threads are running. |
4.Testing the Suricata Rule
①Test ET Open rule number 2100498 using the following command
|
1 2 |
# curl http://testmynids.org/uid/index.html uid=0(root) gid=0(root) groups=0(root) |
②Check the log file using the specified rule number
|
1 2 3 |
# grep 2100498 /var/log/suricata/fast.log 02/13/2024-15:00:42.537540 [**] [1:2100498:7] GPL ATTACK_RESPONSE id check returned root [**] [Classification: Potentially Bad Traffic] [Priority: 2] {TCP} 99.86.199.74:80 -> 192.168.11.83:35280 |
③Check events in /var/log/suricata/eve.log
Install jq
|
1 |
# apt install jq |
Filter EVE Log events by searching for 2100498 signatures
Display alert objects with signature_id keys that match the values in 2100498
|
1 2 3 4 5 6 7 8 9 10 11 12 13 14 15 16 17 18 19 20 21 22 23 24 25 |
# jq 'select(.alert .signature_id==2100498)' /var/log/suricata/eve.json { "timestamp": "2024-02-13T15:00:42.537540+0900", "flow_id": 1322091958432292, "in_iface": "ens33", "event_type": "alert", "src_ip": "99.86.199.74", "src_port": 80, "dest_ip": "192.168.11.83", "dest_port": 35280, "proto": "TCP", "community_id": "1:iKpqT0sU1QhLvzHnc0mg14f+B50=", "alert": { "action": "allowed", "gid": 1, "signature_id": 2100498, "rev": 7, "signature": "GPL ATTACK_RESPONSE id check returned root", "category": "Potentially Bad Traffic", "severity": 2, "metadata": { "created_at": [ "2010_09_23" ], |
④Creating and Applying Custom Rules
Create the following custom signature to scan SSH traffic to non-SSH ports and include it in the file /etc/suricata/rules/local.rules (IPv4 only this time)
|
1 2 |
# vi /etc/suricata/rules/local.rules alert ssh any any -> 203.0.113.5 !22 (msg:"SSH TRAFFIC on non-SSH port"; flow:to_client, not_established; classtype: misc-attack; target: dest_ip; sid:1000000;) |
Editing suricata.yaml
|
1 2 3 4 5 6 |
# vi /etc/suricata/suricata.yaml Add local.rules at line 1923 rule-files: - suricata.rules - local.rules |
Verify SURICATA settings
|
1 2 3 4 5 6 7 8 9 10 11 12 13 |
# suricata -T -c /etc/suricata/suricata.yaml -v 13/2/2024 -- 15:37:43 - <Info> - Running suricata under test mode 13/2/2024 -- 15:37:43 - <Notice> - This is Suricata version 6.0.10 RELEASE running in SYSTEM mode 13/2/2024 -- 15:37:43 - <Info> - CPUs/cores online: 2 13/2/2024 -- 15:37:43 - <Info> - fast output device (regular) initialized: fast.log 13/2/2024 -- 15:37:43 - <Info> - eve-log output device (regular) initialized: eve.json 13/2/2024 -- 15:37:43 - <Info> - stats output device (regular) initialized: stats.log 13/2/2024 -- 15:37:56 - <Info> - 2 rule files processed. 36849 rules successfully loaded, 0 rules failed 13/2/2024 -- 15:37:56 - <Info> - Threshold config parsed: 0 rule(s) found 13/2/2024 -- 15:37:56 - <Info> - 36852 signatures processed. 1192 are IP-only rules, 5056 are inspecting packet payload, 30398 inspect application layer, 108 are decoder event only 13/2/2024 -- 15:38:05 - <Notice> - Configuration provided was successfully loaded. Exiting. 13/2/2024 -- 15:38:05 - <Info> - cleaning up signature grouping structure... complete |
Edit the custom signature you just created and convert it to use the drop action.
|
1 2 3 |
# vi /etc/suricata/rules/local.rules drop ssh any any -> 192.168.11.83 !22 (msg:"SSH TRAFFIC on non-SSH port"; flow:to_client, not_established; classtype: misc-attack; target: des t_ip; sid:1000000;) |
⑤Reconfigure SURICATA and reboot in IPS mode
|
1 2 3 4 5 6 7 |
# systemctl edit suricata.service Line 4 : add [Service] ExecStart= ExecStart=/usr/bin/suricata -c /etc/suricata/suricata.yaml --pidfile /run/suricata.pid -q 0 -vvv Type=simple |
Reload systemd to detect new Suricata settings
|
1 |
# systemctl daemon-reload |
|
1 |
# systemctl restart suricata.service |
|
1 2 3 4 5 6 7 8 9 10 11 12 13 14 15 16 |
# systemctl status suricata.service ● suricata.service - Suricata IDS/IDP daemon Loaded: loaded (/lib/systemd/system/suricata.service; enabled; preset: enabled) Drop-In: /etc/systemd/system/suricata.service.d mqoverride.conf Active: active (running) since Tue 2024-02-13 15:49:55 JST; 7s ago Docs: man:suricata(8) man:suricatasc(8) https://suricata-ids.org/docs/ Main PID: 5601 (Suricata-Main) Tasks: 1 (limit: 4603) Memory: 217.8M CPU: 7.497s CGroup: /system.slice/suricata.service mq5601 /usr/bin/suricata -c /etc/suricata/suricata.yaml --pidfile /run/suricata.pid -q 0 -vvv |
⑥Add the necessary rules for suricata to the UFW
Edit the firewall files in /etc/ufw/before.rules and /etc/ufw/before6.rules
|
1 2 3 4 5 6 7 8 9 10 |
# vi /etc/ufw/before.rules Per Line 19 : add ## Start Suricata NFQUEUE rules -I INPUT 1 -p tcp --dport 22 -j NFQUEUE --queue-bypass -I OUTPUT 1 -p tcp --sport 22 -j NFQUEUE --queue-bypass -I FORWARD -j NFQUEUE -I INPUT 2 -j NFQUEUE -I OUTPUT 2 -j NFQUEUE ## End Suricata NFQUEUE rules |
Similarly, change /etc/ufw/before6.rules
UFW restart
|
1 |
# systemctl restart ufw.service |
Ensure that packets matching the aforementioned signature sid:2100498 are dropped
|
1 2 3 4 5 |
# vi /etc/suricata/rules/suricata.rules Find line matching sid:2100498 and change alert to drop drop ip any any -> any any (msg:"GPL ATTACK_RESPONSE id check returned root"; content:"uid=0|28|root|29|"; classtype:bad-unknown; sid:2100498; rev:7; metadata:created_at 2010_09_23, updated_at 2019_07_26;) |
Reload signatures
|
1 |
# kill -usr2 $(pidof suricata) |
Test this rule using curl
|
1 2 |
# curl --max-time 5 http://testmynids.org/uid/index.html curl: (28) Operation timed out after 5000 milliseconds with 0 out of 39 bytes received |
Checking eve.log using jq, "action" is set to "blocked
|
1 2 3 4 5 6 7 8 9 10 11 12 13 14 15 16 17 18 19 20 21 |
# jq 'select(.alert .signature_id==2100498)' /var/log/suricata/eve.json { "timestamp": "2024-02-13T16:14:26.348285+0900", "flow_id": 140147313218421, "event_type": "alert", "src_ip": "99.86.199.94", "src_port": 80, "dest_ip": "192.168.11.83", "dest_port": 51618, "proto": "TCP", "community_id": "1:5SQB7jJU250pb8A9+N2XlrjFUuU=", "alert": { "action": "blocked", "gid": 1, "signature_id": 2100498, "rev": 7, "signature": "GPL ATTACK_RESPONSE id check returned root", "category": "Potentially Bad Traffic", "severity": 2, "metadata": { |
Integration of ELK Stack and SURICATA
Install & configure Elastic Stack to visualize & search SURICATA logs
This section is basically done on a second Ubuntu server
1. Elasticsearch Install
1.1 Download and install a public signature key
|
1 |
# wget -qO - https://artifacts.elastic.co/GPG-KEY-elasticsearch | gpg --dearmor -o /usr/share/keyrings/elasticsearch-keyring.gpg |
1.2 Save repository definition in /etc/apt/sources.list.d/elastic-8.x.list
|
1 |
# echo "deb [signed-by=/usr/share/keyrings/elasticsearch-keyring.gpg] https://artifacts.elastic.co/packages/8.x/apt stable main" | tee /etc/apt/sources.list.d/elastic-8.x.list |
1.3 Install Elasticsearch package
|
1 |
# apt update && apt install elasticsearch |
2. Elasticsearch Configuration
2.1 Edit Elasticsearch configuration file
|
1 2 3 4 5 6 7 8 9 10 11 12 |
# vi /etc/elasticsearch/elasticsearch.yml Line 57 : Add the ip address of the Elastic Stack server network.host: 192.168.11.100 Line 62 : Uncomment http.port: 9200 Temporarily disable xpack.security.enabled and xpack.security.enrollment.enabled Line 93 : change xpack.security.enabled: false Line 95 : change xpack.security.enrollment.enabled: false |
Save the file
2.2 Enable and check Elasticsearch service
|
1 2 3 4 5 6 7 8 9 10 11 12 13 14 15 16 17 18 19 20 21 22 |
# systemctl start elasticsearch.service Send curl request to Elasticsearch Host # curl -X GET "192.168.11.100:9200" { "name" : "Lion", "cluster_name" : "elasticsearch", "cluster_uuid" : "8YaXATWcR4ifj-BaGZIPSw", "version" : { "number" : "8.12.1", "build_flavor" : "default", "build_type" : "deb", "build_hash" : "6185ba65d27469afabc9bc951cded6c17c21e3f3", "build_date" : "2024-02-01T13:07:13.727175297Z", "build_snapshot" : false, "lucene_version" : "9.9.2", "minimum_wire_compatibility_version" : "7.17.0", "minimum_index_compatibility_version" : "7.0.0" }, "tagline" : "You Know, for Search" } |
Elasticsearch version 8.12.1 is running
2.3 Edit the Elasticsearch configuration file again
|
1 2 3 4 5 6 7 8 9 10 11 12 13 |
# vi /etc/elasticsearch/elasticsearch.yml xpack.security back into effect. Line 93 : change xpack.security.enabled: true Line 95 : change xpack.security.enrollment.enabled: true Line 101 : add xpack.security.http.ssl: enabled: true keystore.path: certs/http.p12 verification_mode: none |
Save the file and restart elasticsearch.service
|
1 |
# systemctl restart elasticsearch.service |
2.4 Create passwords for elastic and kibana_system
Be sure to copy the passwords for the elastic and kibana_system users as they will be used later.
The kibana_system user is used to configure Kibana
The elastic user is used to configure Filebeat and login to Kibana
Create password for [elastic] user
|
1 2 3 4 5 6 7 8 9 |
# cd /usr/share/elasticsearch/bin # ./elasticsearch-reset-password -u elastic This tool will reset the password of the [elastic] user to an autogenerated value. The password will be printed in the console. Please confirm that you would like to continue [y/N]y Password for the [elastic] user successfully reset. New value: cVWkIEXS6jtX0HpOKekw |
Create password for [kibana_system]user
|
1 2 3 4 5 6 7 8 9 |
# cd /usr/share/elasticsearch/bin # ./elasticsearch-reset-password -u kibana_system This tool will reset the password of the [kibana_system] user to an autogenerated value. The password will be printed in the console. Please confirm that you would like to continue [y/N]y Password for the [kibana_system] user successfully reset. New value: Fd3Rek+A7Q9sipbCkgWd |
3. Configure Kibana
Kibana is installed after Elasticsearch is installed.
Install Kibana on the same machine as Elasticsearch
3.1 Kibana install
|
1 2 3 4 5 6 7 8 9 10 11 12 13 14 15 16 17 18 19 20 21 22 23 24 25 26 27 28 29 30 31 32 33 34 |
# apt install kibana Reading package lists... Done Building dependency tree... Done Reading state information... Done The following NEW packages will be installed: kibana 0 upgraded, 1 newly installed, 0 to remove and 5 not upgraded. Need to get 318 MB of archives. After this operation, 928 MB of additional disk space will be used. Get:1 https://artifacts.elastic.co/packages/8.x/apt stable/main amd64 kibana amd64 8.12.1 [318 MB] Fetched 318 MB in 5s (58.3 MB/s) Selecting previously unselected package kibana. (Reading database ... 75958 files and directories currently installed.) Preparing to unpack .../kibana_8.12.1_amd64.deb ... Unpacking kibana (8.12.1) ... Setting up kibana (8.12.1) ... Creating kibana group... OK Creating kibana user... OK Kibana is currently running with legacy OpenSSL providers enabled! For details and instructions on how to disable see https://www.elastic.co/guide/en/kibana/8.12/production.html#openssl-legacy-provider Created Kibana keystore in /etc/kibana/kibana.keystore Need to get 318 MB of archives. After this operation, 928 MB of additional disk space will be used. Get:1 https://artifacts.elastic.co/packages/8.x/apt stable/main amd64 kibana amd64 8.12.1 [318 MB] Fetched 318 MB in 5s (58.3 MB/s) Selecting previously unselected package kibana. (Reading database ... 75958 files and directories currently installed.) Preparing to unpack .../kibana_8.12.1_amd64.deb ... Unpacking kibana (8.12.1) ... Setting up kibana (8.12.1) ... Creating kibana group... OK Creating kibana user... OK Kibana is currently running with legacy OpenSSL providers enabled! For details and instructions on how to disable see https://www.elastic.co/guide/en/kibana/8.12/production.html#openssl-legacy-provider Created Kibana keystore in /etc/kibana/kibana.keystore |
3.2 Create xpack.security settings and encryption key
Make a copy of the encryption key
|
1 2 3 4 5 6 7 |
# cd /usr/share/kibana/bin/ # ./kibana-encryption-keys generate -q xpack.encryptedSavedObjects.encryptionKey: 8d8d36114468*********9a3d1084978 xpack.reporting.encryptionKey: de3e90407d9d************fccc0c0e xpack.security.encryptionKey: 5459621557bd7f5ef*********f951a2 |
Add encryption key to kibana.yml configuration file
|
1 2 3 4 5 6 7 8 9 10 |
# vi /etc/kibana/kibana.yml Add encryption key to last line # Maximum number of documents loaded by each shard to generate autocomplete suggestions. # This value must be a whole number greater than zero. Defaults to 100_000 #unifiedSearch.autocomplete.valueSuggestions.terminateAfter: 100000 xpack.encryptedSavedObjects.encryptionKey: 8d8d36114468*********9a3d1084978 xpack.reporting.encryptionKey: de3e90407d9d************fccc0c0e xpack.security.encryptionKey: 5459621557bd7f5ef*********f951a2 |
3.3 Other kibana.yml configuration file editing
|
1 2 3 4 5 6 7 8 9 10 11 12 13 14 15 16 17 |
# vi /etc/kibana/kibana.yml Line 6 : Uncomment server.port: 5601 Line 12 : Replaced with Elastic Stack IP address (192.168.11.100) server.host: "192.168.11.100" Line 44 : add elasticsearch.hosts: ["https://192.168.11.100:9200"] Line 49,50 : Uncomment, leave elasticsearch.username as default (kibana_system) and change elasticsearch.password to the kibana_system password you created elasticsearch.username: "kibana_system" elasticsearch.password: "FNgfMnyj7I-BRLpKwHDO" Line 96 : add (Kibana skips hostname validation when making outbound SSL/TSL connections to Elasticsearch) #elasticsearch.ssl.verificationMode: full elasticsearch.ssl.verificationMode: 'none' |
file save
3.4 Kibana service launched
|
1 |
# systemctl start kibana.service |
Check the status of Kibana.service
|
1 2 3 4 5 6 7 8 9 10 11 12 13 14 15 16 17 18 |
# systemctl status kibana.service ● kibana.service - Kibana Loaded: loaded (/lib/systemd/system/kibana.service; disabled; vendor preset: enabled) Active: active (running) since Tue 2024-02-13 19:11:30 JST; 8s ago Docs: https://www.elastic.co Main PID: 19791 (node) Tasks: 11 (limit: 4515) Memory: 145.2M CPU: 3.637s CGroup: /system.slice/kibana.service mq19791 /usr/share/kibana/bin/../node/bin/node /usr/share/kibana/bin/../src/cli/dist Feb 13 19:11:30 Lion systemd[1]: Started Kibana. Feb 13 19:11:31 Lion kibana[19791]: Kibana is currently running with legacy OpenSSL providers enabled! For details and instructions on how to disable s> Feb 13 19:11:33 Lion kibana[19791]: {"log.level":"info","@timestamp":"2024-02-13T10:11:33.136Z","log.logger":"elastic-apm-node","ecs.version":"8.10.0",> Feb 13 19:11:39 Lion kibana[19791]: [2024-02-13T19:11:39.012+09:00][INFO ][root] Kibana is starting Feb 13 19:11:39 Lion kibana[19791]: [2024-02-13T19:11:39.396+09:00][INFO ][node] Kibana process configured with roles: [background_tasks, ui] |
3.5 http,https port open
|
1 2 3 |
# ufw allow http # ufw allow https # ufw reload |
4. Confirmation of Kibana web page launch
Access your web browser and verify that Kibana is running properly.
Try accessing Kibana by typing "http://192.168.11.100:5601". However, keep port 5601 open.
Log in with elastic as Username and password created for elastic.

Select "Add integrations" and press Enter
Create a new user account so that you do not need to use the elastic superuser account.
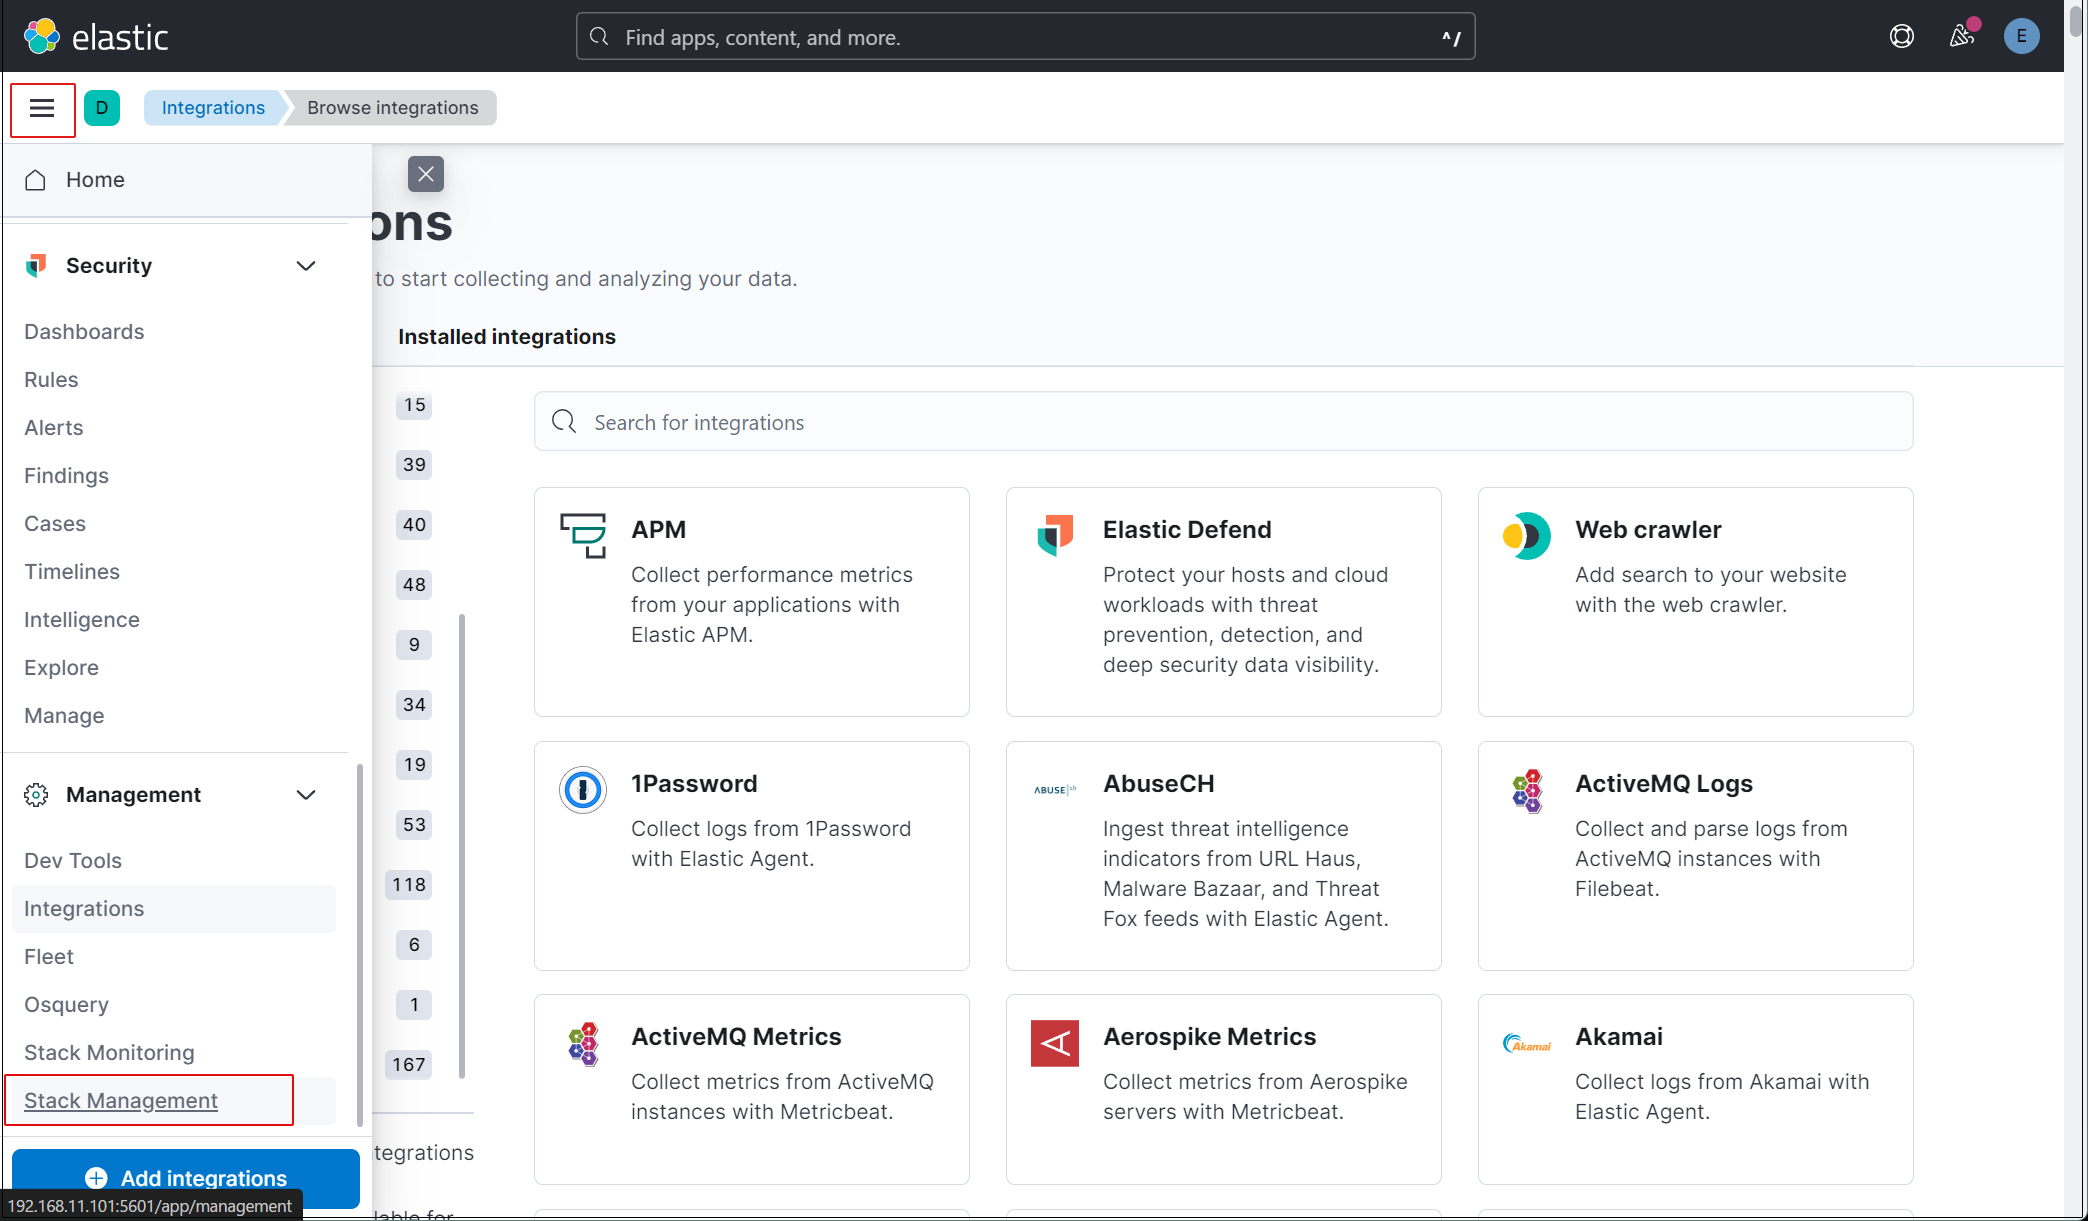
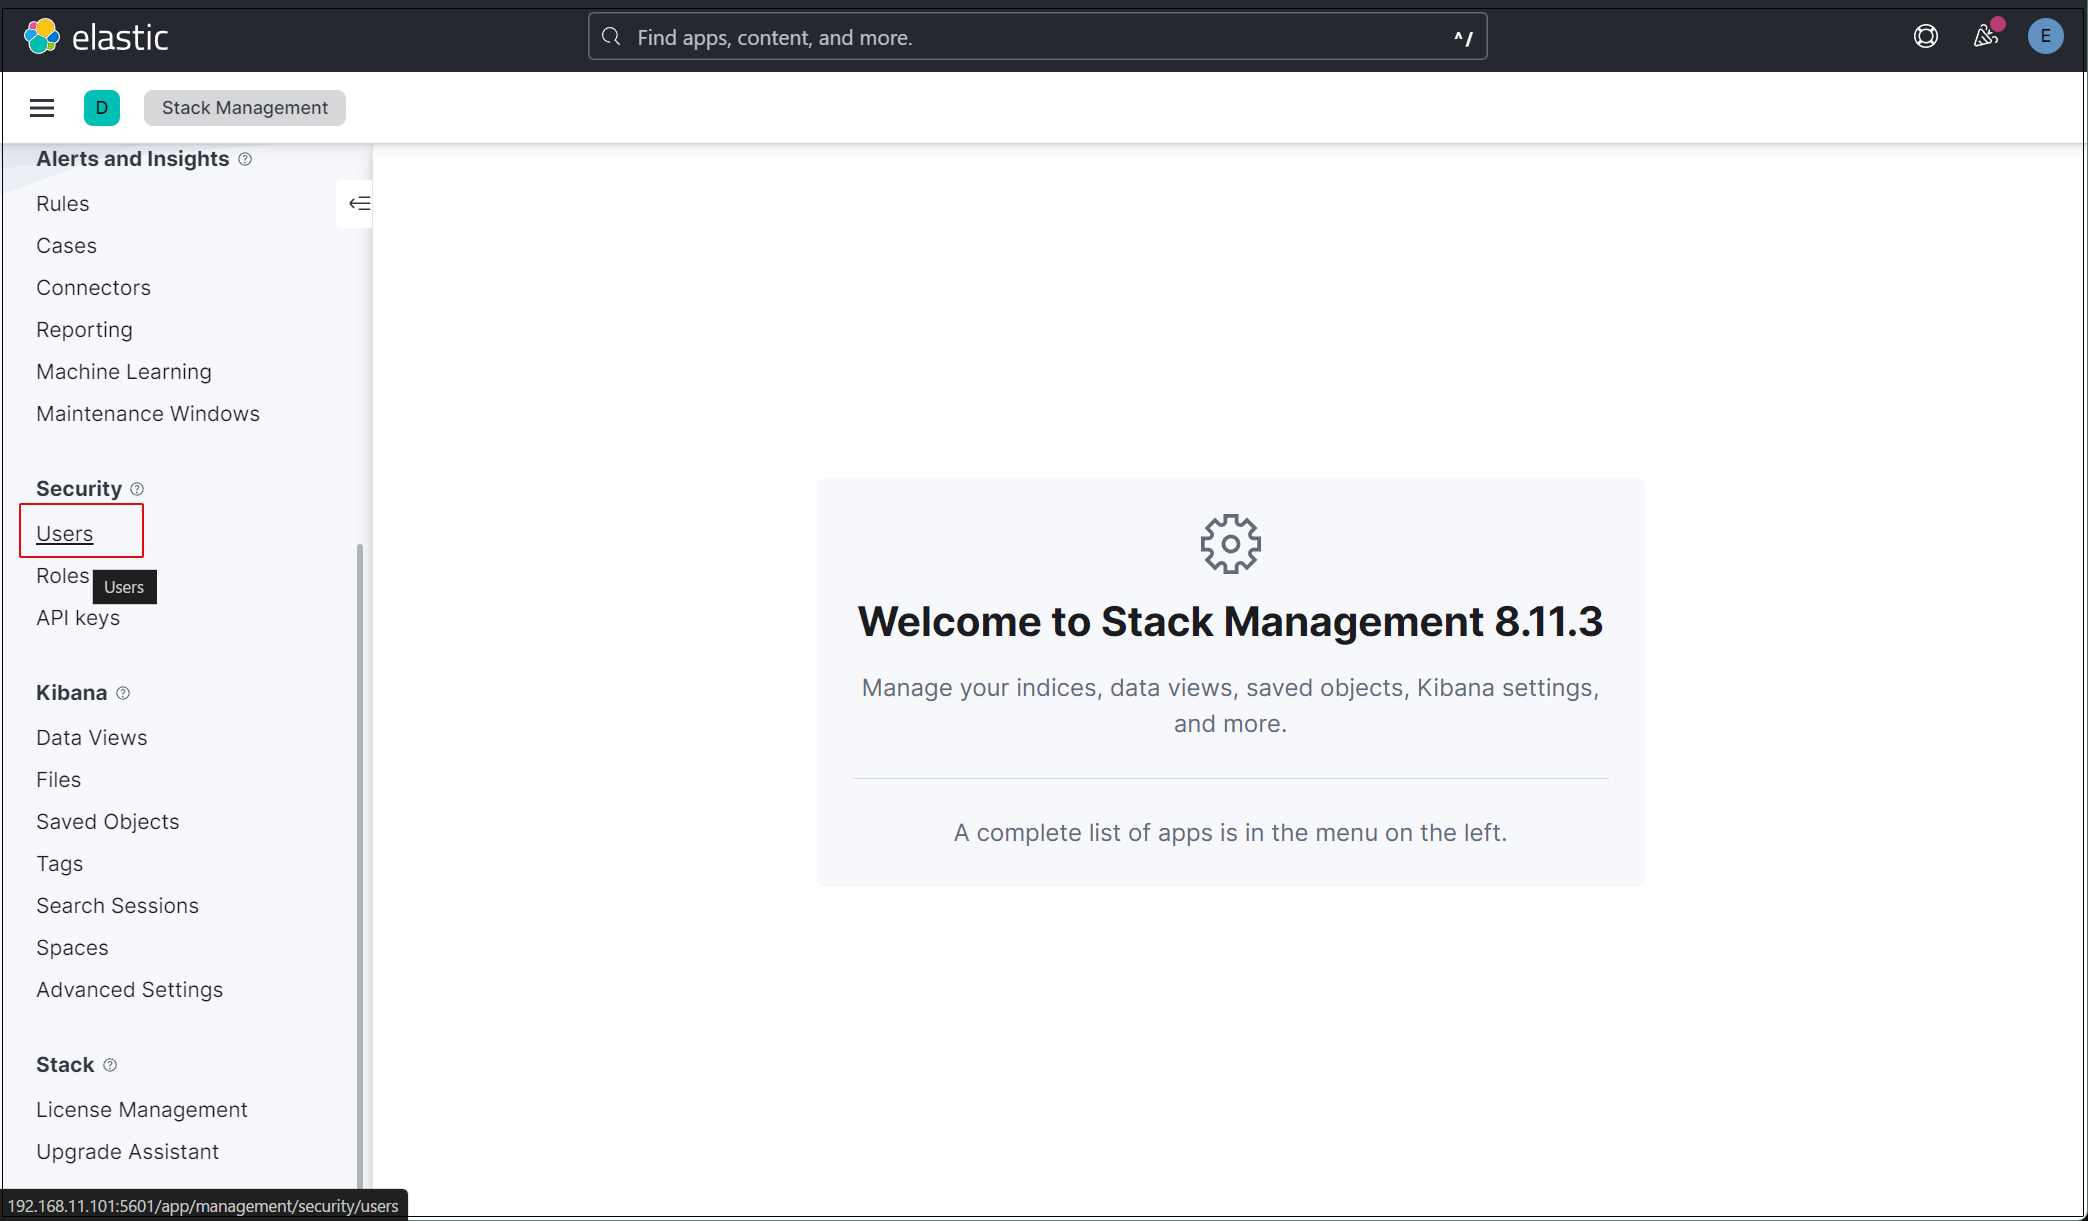
Open the main menu and select Stack Management > Users
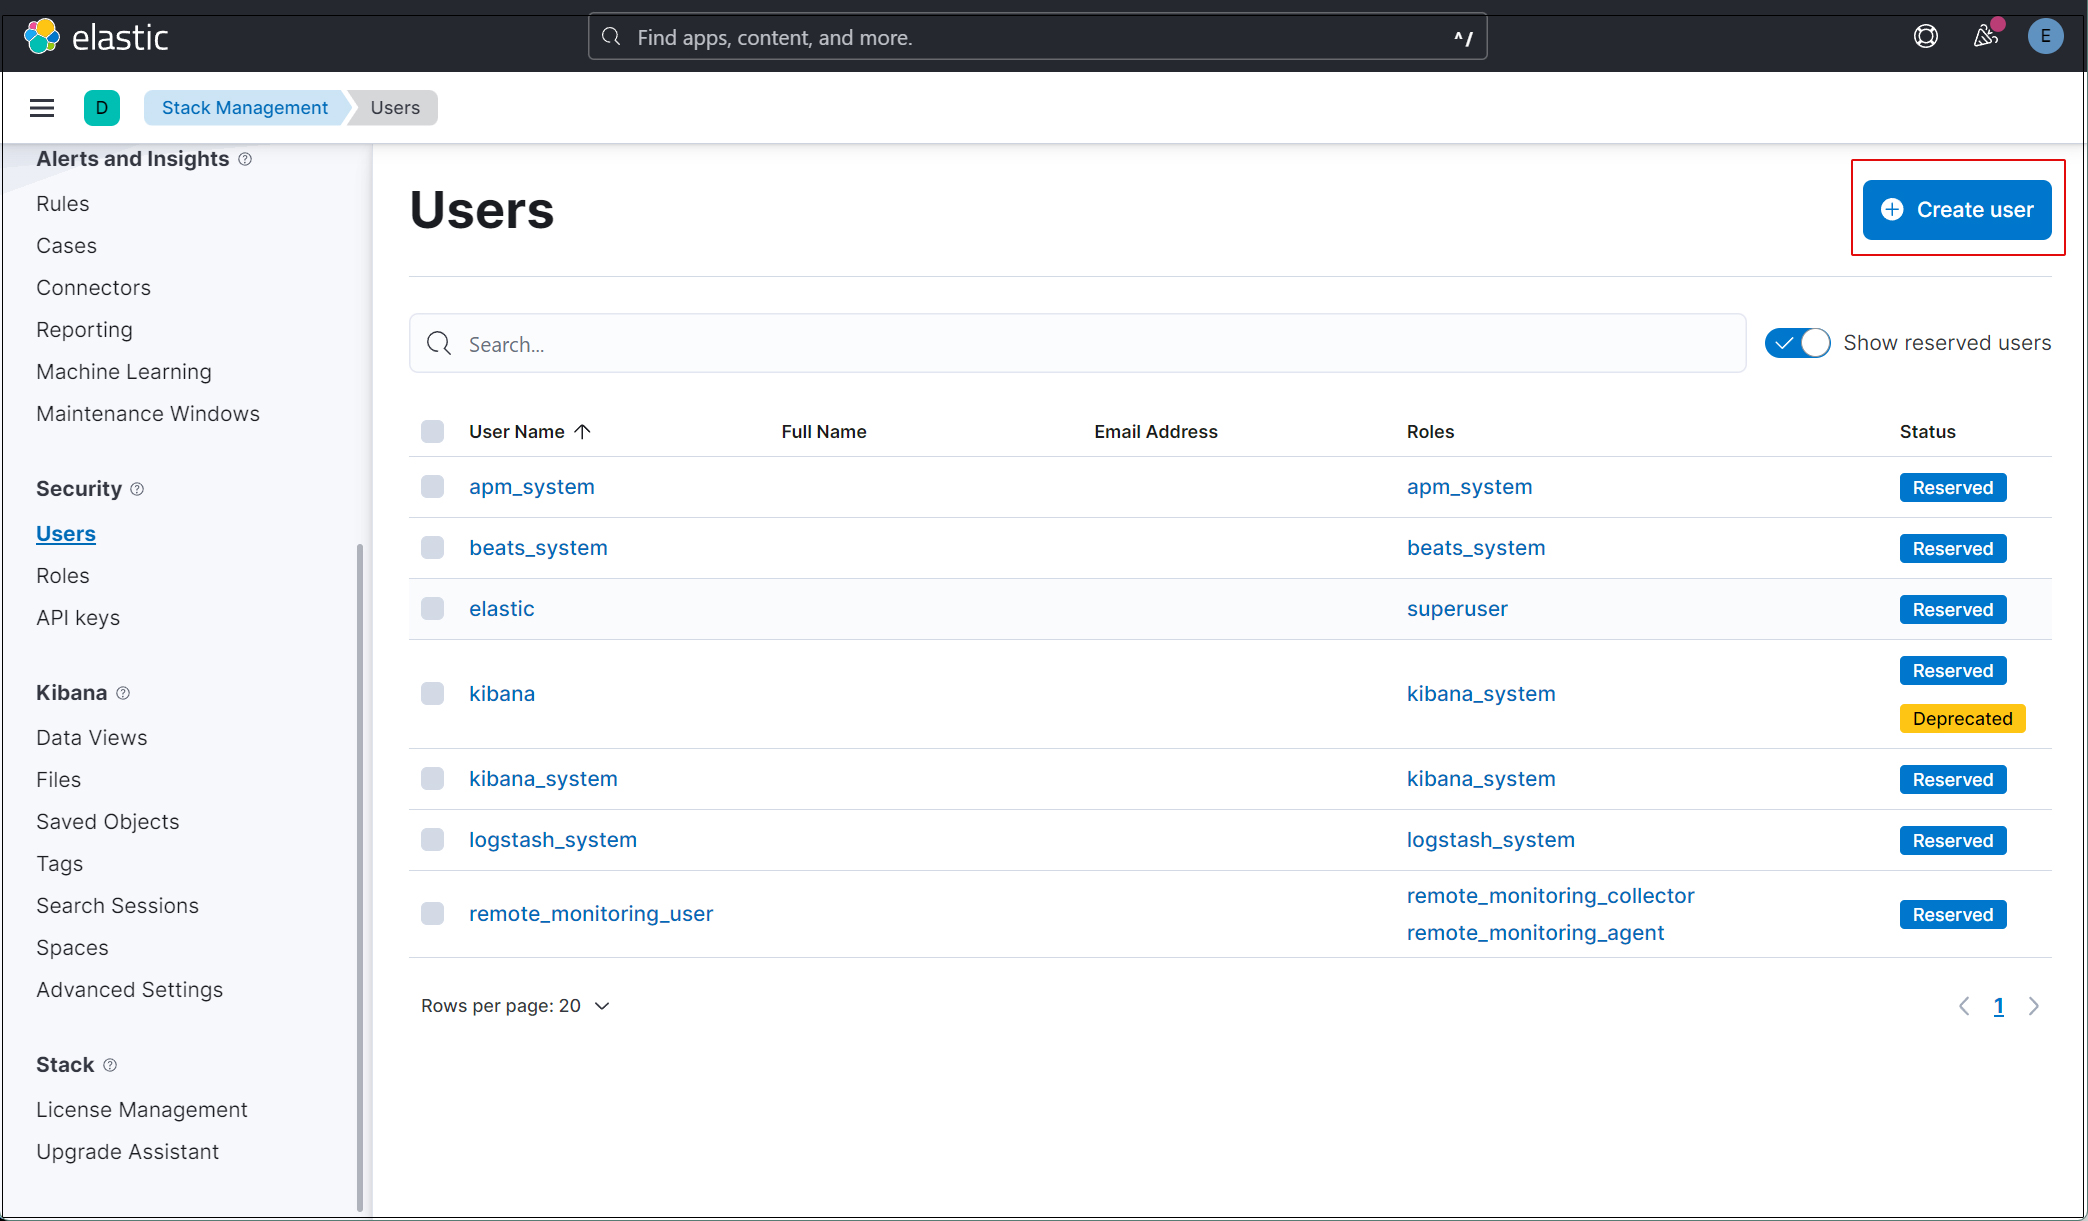
Click on the "Create user" button in the upper right corner
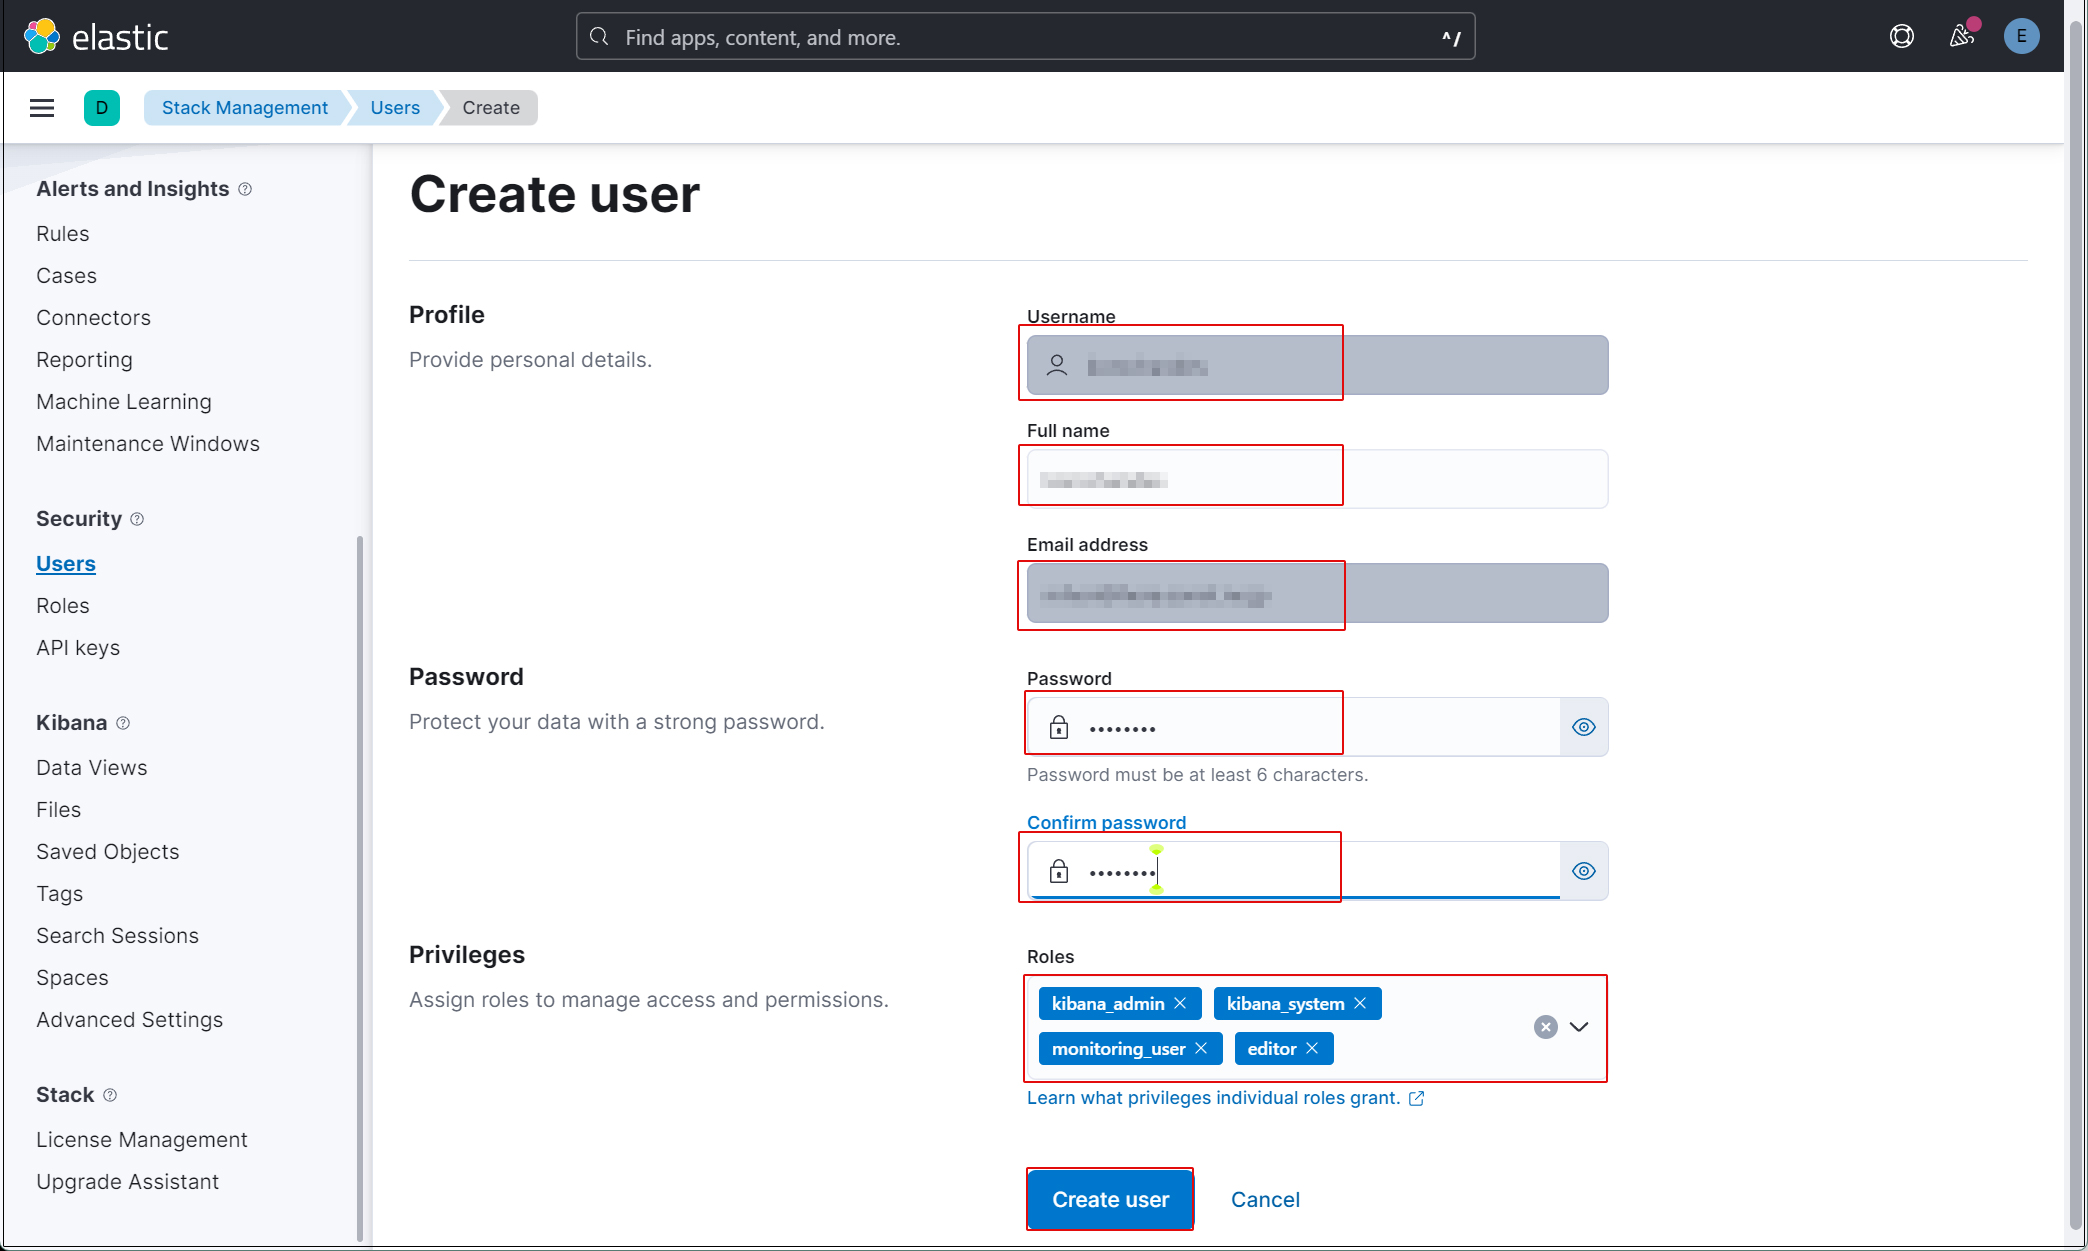
Enter new user information and assign the roles kibana_admin, kibana_system, monitoring_user, and editor in Privileges
Log out of the current profile and confirm that you can log in with the newly created user account.
Currently, we do not have Filebeat configured on the SURICATA host, so we do not have any data that can be displayed by Kibana.
Filebeat Installation and Configuration
This work will be done on the first Debian 12.5 server with Suricata installed
1. Filebeat Install
1.1 Download Public Signature Key
|
1 |
# wget -qO - https://artifacts.elastic.co/GPG-KEY-elasticsearch | apt-key add - |
1.2 Save repository definition in /etc/apt/sources.list.d/elastic-8.x.list
|
1 |
# echo "deb https://artifacts.elastic.co/packages/8.x/apt stable main" | tee -a /etc/apt/sources.list.d/elastic-8.x.list |
1.3 Install Filebeat
|
1 2 3 4 5 6 7 8 9 10 11 12 13 14 15 16 17 18 19 20 21 22 23 24 25 26 27 28 29 |
# apt update && apt install filebeat Hit:1 http://security.debian.org/debian-security bookworm-security InRelease Hit:2 http://deb.debian.org/debian bookworm InRelease Get:3 http://deb.debian.org/debian bookworm-updates InRelease [52.1 kB] Get:4 http://deb.debian.org/debian bookworm-backports InRelease [56.5 kB] Get:5 https://artifacts.elastic.co/packages/8.x/apt stable InRelease [10.4 kB] Get:6 https://artifacts.elastic.co/packages/8.x/apt stable/main amd64 Packages [84.2 kB] Fetched 203 kB in 1s (200 kB/s) Reading package lists... Done Building dependency tree... Done Reading state information... Done All packages are up to date. W: https://artifacts.elastic.co/packages/8.x/apt/dists/stable/InRelease: Key is stored in legacy trusted.gpg keyring (/etc/apt/trusted.gpg), see the DEPRECATION section in apt-key(8) for details. Reading package lists... Done Building dependency tree... Done Reading state information... Done The following NEW packages will be installed: filebeat 0 upgraded, 1 newly installed, 0 to remove and 0 not upgraded. Need to get 50.3 MB of archives. After this operation, 183 MB of additional disk space will be used. Get:1 https://artifacts.elastic.co/packages/8.x/apt stable/main amd64 filebeat amd64 8.12.1 [50.3 MB] Fetched 50.3 MB in 8s (6,168 kB/s) Selecting previously unselected package filebeat. (Reading database ... 32689 files and directories currently installed.) Preparing to unpack .../filebeat_8.12.1_amd64.deb ... Unpacking filebeat (8.12.1) ... Setting up filebeat (8.12.1) ... |
1.4 Configure Filebeat to connect to Elasticsearch and Kibana
|
1 2 3 4 5 6 7 8 9 10 11 12 13 14 |
# vi /etc/filebeat/filebeat.yml Line 118 : Uncomment and enter the Elastic Stack IP address and Kibana port number (5601) host: "192.168.11.100:5601" Line 145 : Uncomment and enter the ip address of Elastic Stack and port number of elasticsearch hosts: ["192.168.11.100:9200"] Per Line 155,156 : Uncomment, leave [username] as default, and enter the [elastic] user's password in [password]. username: "elastic" password: “j5bBHphLUGQ6OhcsG74+" Also add the following ssl.verification_mode: “none” |
Enable Filebeat's Suricata module, but import the Suricata module from the .yml file, as Elasticsearch 8.x has a bug in importing modules
|
1 2 3 4 5 6 7 8 9 10 11 12 13 14 15 16 17 18 19 |
# vi /etc/filebeat/filebeat.yml Comment out the entire Filebeat module section per line 57 and add the following line under reload.period # ============================== Filebeat modules ============================== #filebeat.config.modules: # Glob pattern for configuration loading #path: ${path.config}/modules.d/*.yml # Set to true to enable config reloading #reload.enabled: false # Period on which files under path should be checked for changes #reload.period: 10s filebeat.modules: - module: suricata eve: enabled: true var.paths: ["/var/log/suricata/eve.json"] |
Next, force the SURICATA module to run
|
1 2 |
# filebeat setup --pipelines --modules suricata -M "suricata.eve.enabled=true" -c /etc/filebeat/filebeat.yml Loaded Ingest pipelines |
1.5 Set up initial environment
Load SIEM dashboard and pipeline into Elasticsearch
Run the filebeat setup command
Make sure suricata-eve-* is listed
|
1 2 3 4 5 6 7 8 9 |
# filebeat setup -e {"log.level":"info","@timestamp":"2024-02-14T15:32:07.067+0900","log.logger":"modules","log.origin":{"file.name":"fileset/pipelines.go","file.line":135},"message":"Elasticsearch pipeline loaded.","service.name":"filebeat","pipeline":"filebeat-8.11.3-suricata-eve-pipeline","ecs.version":"1.6.0"} {"log.level":"info","@timestamp":"2024-02-14T15:12:07.068+0900","log.logger":"modules","log.origin":{"file.name":"fileset/pipelines.go","file.line":135},"message":"Elasticsearch pipeline loaded.","service.name":"filebeat","pipeline":"filebeat-8.11.3-suricata-eve-dns","ecs.version":"1.6.0"} {"log.level":"info","@timestamp":"2024-02-14T15:12:07.069+0900","log.logger":"modules","log.origin":{"file.name":"fileset/pipelines.go","file.line":135},"message":"Elasticsearch pipeline loaded.","service.name":"filebeat","pipeline":"filebeat-8.11.3-suricata-eve-dns-answer-v1","ecs.version":"1.6.0"} {"log.level":"info","@timestamp":"2024-02-14T15:12:07.070+0900","log.logger":"modules","log.origin":{"file.name":"fileset/pipelines.go","file.line":135},"message":"Elasticsearch pipeline loaded.","service.name":"filebeat","pipeline":"filebeat-8.11.3-suricata-eve-dns-answer-v2","ecs.version":"1.6.0"} {"log.level":"info","@timestamp":"2024-02-14T15:12:07.071+0900","log.logger":"modules","log.origin":{"file.name":"fileset/pipelines.go","file.line":135},"message":"Elasticsearch pipeline loaded.","service.name":"filebeat","pipeline":"filebeat-8.11.3-suricata-eve-tls","ecs.version":"1.6.0"} {"log.level":"info","@timestamp":"2024-02-14T15:12:07.072+0900","log.logger":"modules","log.origin":{"file.name":"fileset/pipelines.go","file.line":135},"message":"Elasticsearch pipeline loaded.","service.name":"filebeat","pipeline":"filebeat-8.11.3-suricata-eve-http","ecs.version":"1.6.0"} Loaded Ingest pipelines |
1.6 Filebeat service launched
|
1 |
# systemctl start filebeat.service |
Check with Kibana
Log back into Kibana with the user you created: http://192.168.11.100:5601にアクセスします.
Type "Suricata Events Overview" in the top search field and click on Events Overview
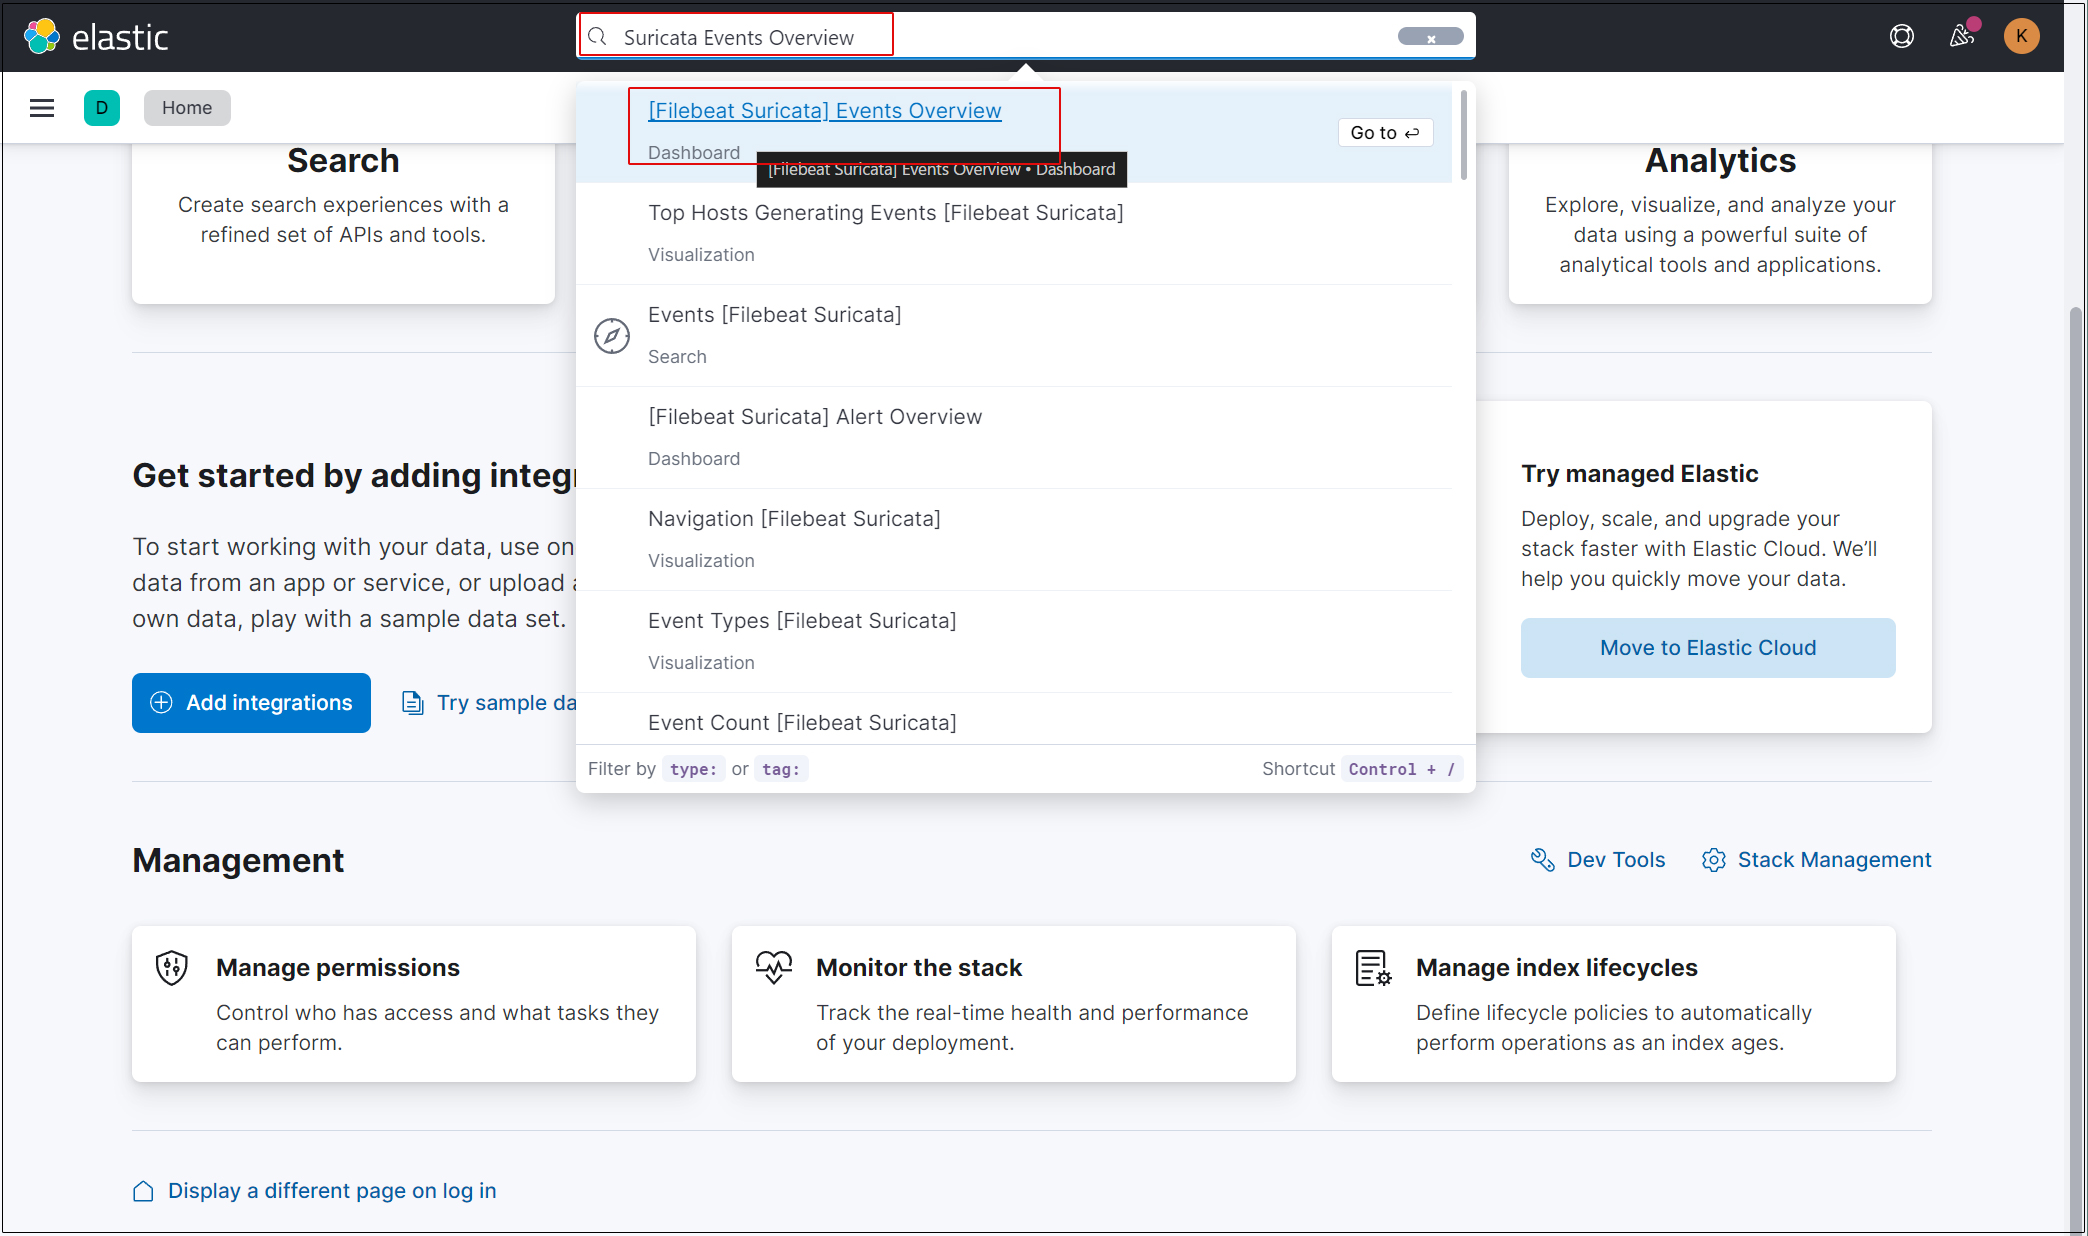
All Suricata events in the last 15 minutes are displayed
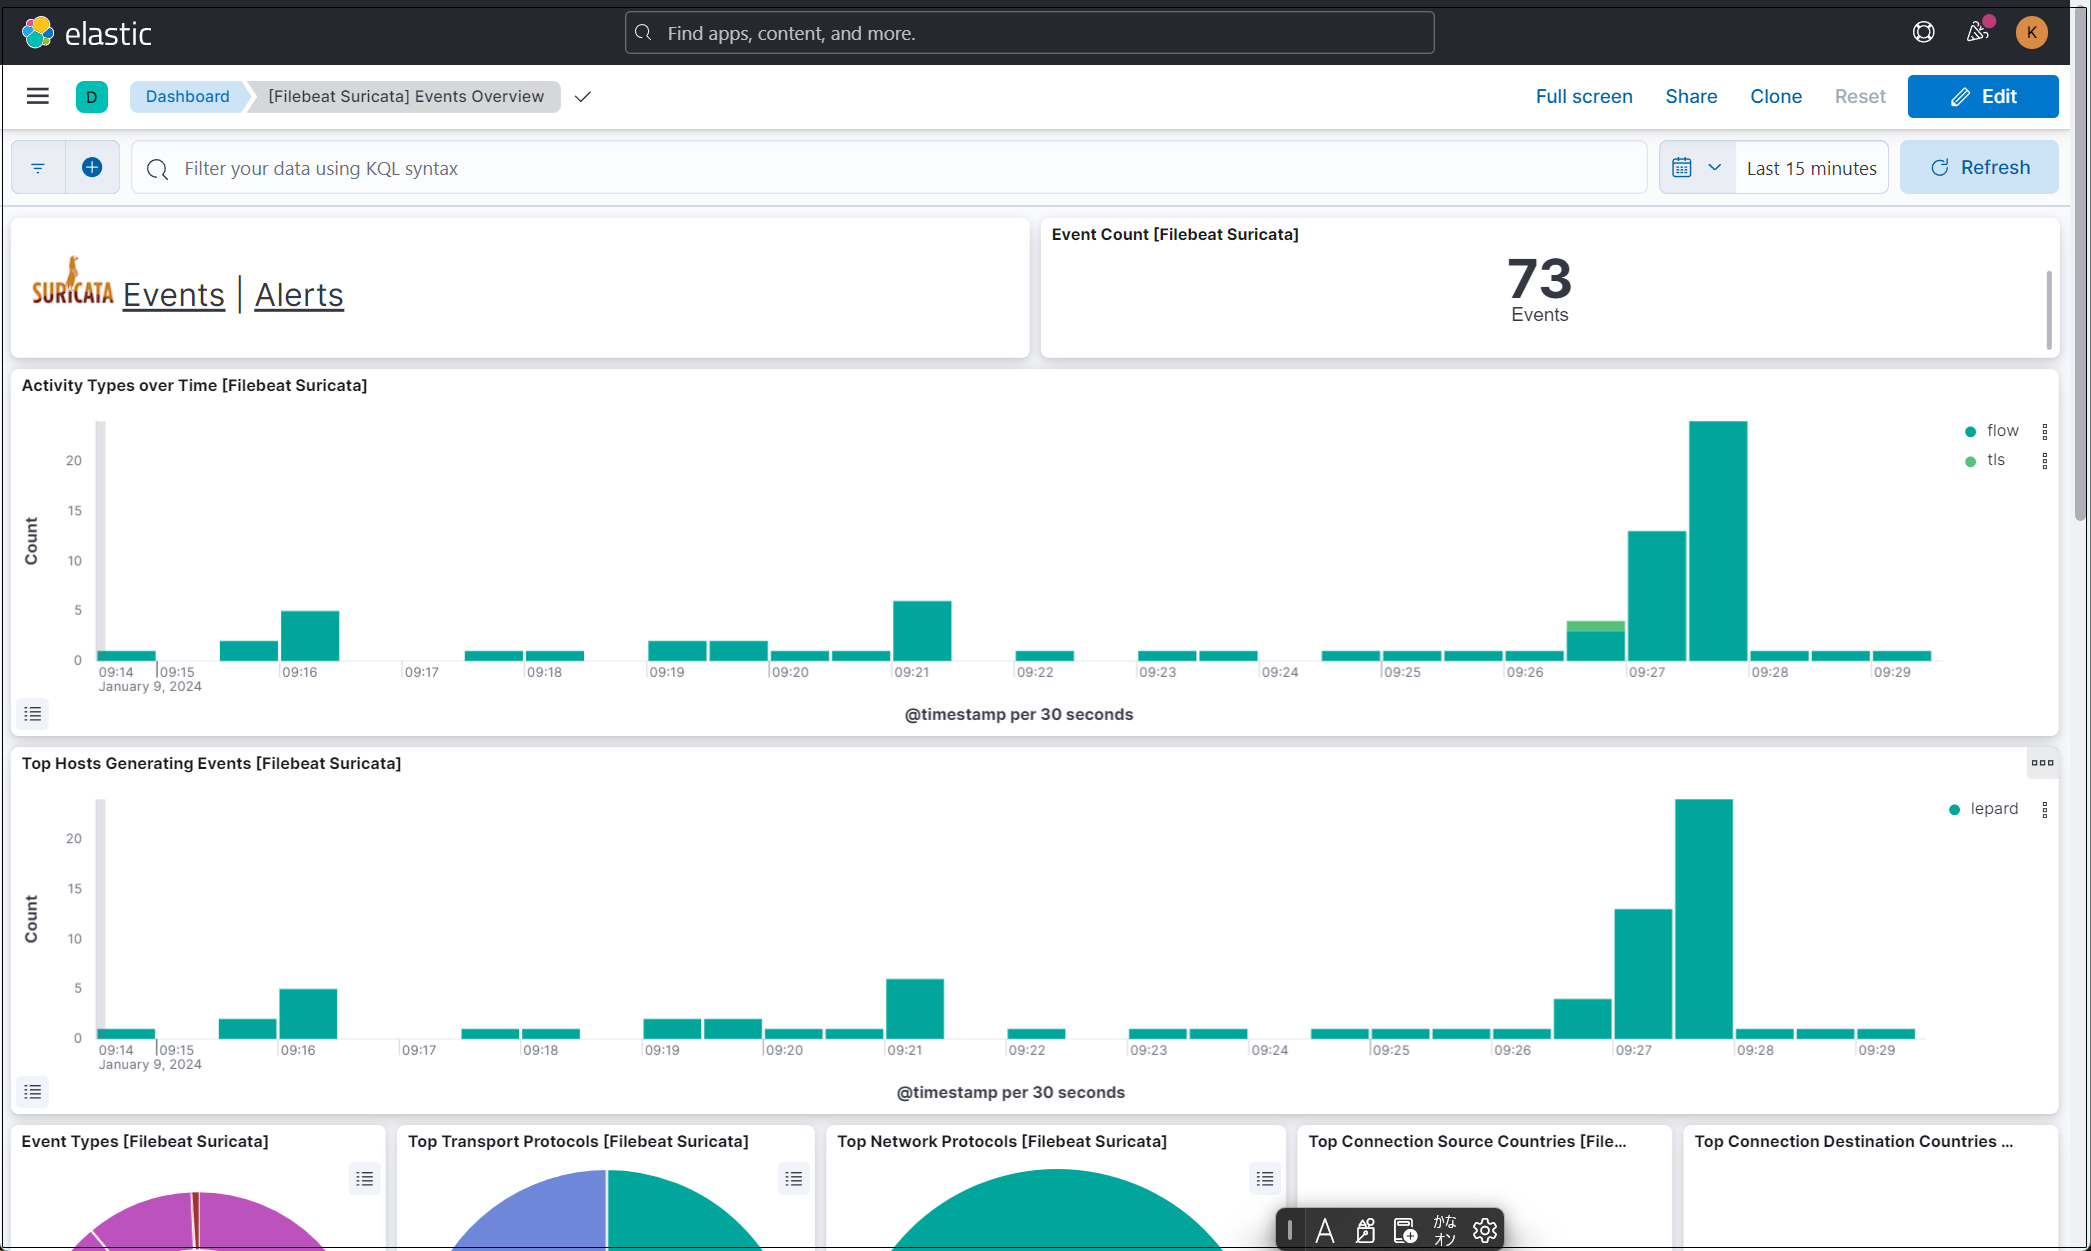
Click on the Alerts text next to the Suricata logo for malicious traffic alerts