Contents
Installation of open source integrated monitoring software "Zabbix"
Zabbix is an open source integrated monitoring software for centralized monitoring of servers, networks and applications. It provides monitoring, fault detection and notification functions required for integrated monitoring. With Zabbix agent and SNMP support for many platforms, you can monitor your entire system with a single Zabbix.
To run Zabbix, you need PHP programming language, MySQL/MariaDB as database server, and a web server such as Apache or Nginx.
In this case, we will proceed on the assumption that all of the following conditions have already been configured.
・OS : OpenSUSE15.5
・Web server : Apache2.4.51
・PHP8.0.29
・Database : MariaDB10.6
Please refer to the following to configure the above


First make sure that all packages available for the openSUSE 15 system are updated to the latest stable version
|
1 |
# zypper update |
Install required packages for Zabbix Server 6
|
1 |
# zypper install php8-zip php8-fpm php8-gd php8-gettext php8-mbstring php8-mysql |
Install Zabbix 6.x server, frontend and agent
①Install Repository
|
1 |
# rpm -Uvh https://repo.zabbix.com/zabbix/6.5/sles/15/x86_64/zabbix-release-6.5-1.sles15.noarch.rpm |
➁Import GPG key signatures from repositories
|
1 |
# zypper --gpg-auto-import-keys refresh 'Zabbix Official Repository' |
➂Install Zabbix server, front-end and agent
|
1 |
# zypper install zabbix-server-mysql zabbix-web-mysql zabbix-apache-conf zabbix-agent zabbix-sql-scripts |
Create database and user for Zabbix
Create database schema for Zabbix server.
Login to MariaDB server as root account and create MariaDB database (e.g. my_zabbix_db), user (e.g. zabbix_user) and password (e.g. ?Wabcd123).
|
1 2 3 4 5 6 7 |
# mysql -u root -p Password: > CREATE DATABASE my_zabbix_db character set utf8 collate utf8_bin; >CREATE USER 'zabbix_user'@'localhost' IDENTIFIED BY '?Wabcd123'; >grant all on my_zabbix_db.* TO 'zabbix_user'@'localhost'; >FLUSH PRIVILEGES; >exit; |
Update Zabbix configuration
Edit Zabbix server configuration file /etc/zabbix/zabbix_server.conf and update database configuration for Zabbix server to connect to database
|
1 2 3 4 5 6 7 8 9 |
# vi /etc/zabbix/zabbix_server.conf Line 95 : Uncomment and change DBHost=127.0.0.1 Line 107 : Change DBName=my_zabbix_db Line 123 : Change DBUser=zabbix_user Line 131 : Uncommented and added DBPassword='password' |
Import of Zabbix default database and initial data
Import the initial Zabbix database schema and data into the newly created database.
|
1 |
# zcat /usr/share/zabbix-sql-scripts/mysql/server.sql.gz | mysql -uzabbix_user -p'?Wabcd123' my_zabbix_db |
Monitor Zabbix server itself
|
1 2 3 |
# vi /etc/zabbix/zabbix_agentd.conf Line 182 : Change Hostname=Lerpard ←I'll go with Lepard this time. |
Restart Zabbix Server and Agent Deamon so that they are ready to run at system startup.
|
1 2 |
# systemctl enable zabbix-server zabbix-agent apache2 php-fpm # systemctl restart zabbix-server zabbix-agent apache2 httpd |
Configure Zabbix firewall
Zabbix ports 10050 (on Zabbix server side) and 10051 (on zabbix agent side) must be allowed.
|
1 2 |
# firewall-cmd --add-port={10050,10051,80,443}/tcp --permanent # firewall-cmd --reload |
Running Zabbix Web Installer
Zabbix Web Installer can be accessed via "server IP/zabbix" or "domain/zabbix".
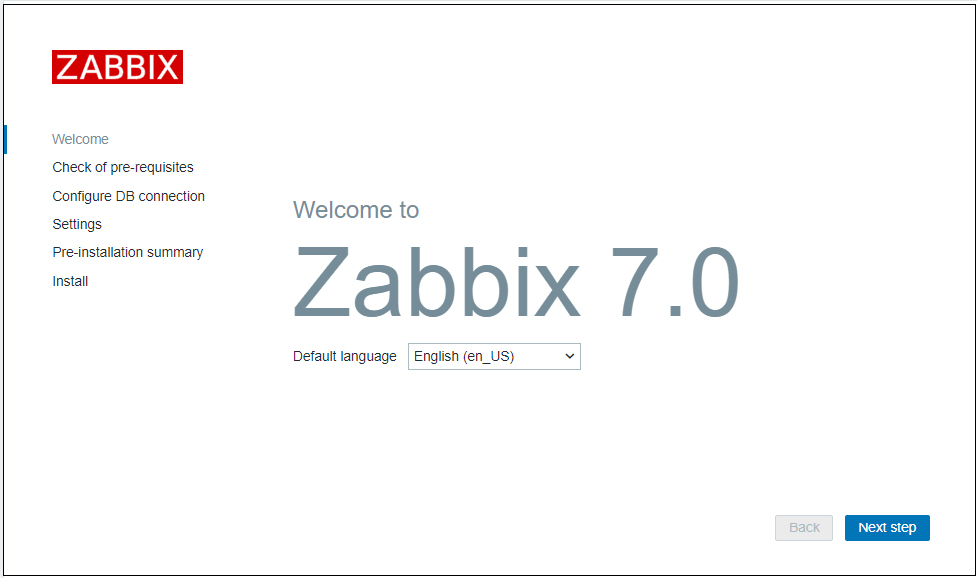
Open a web browser and enter "http: //[your-server-IP_Address]/zabbix".
You will get to the next screen. Click on [Next step]. For some reason Zabbix 7.0 will start up, but I don't know why.
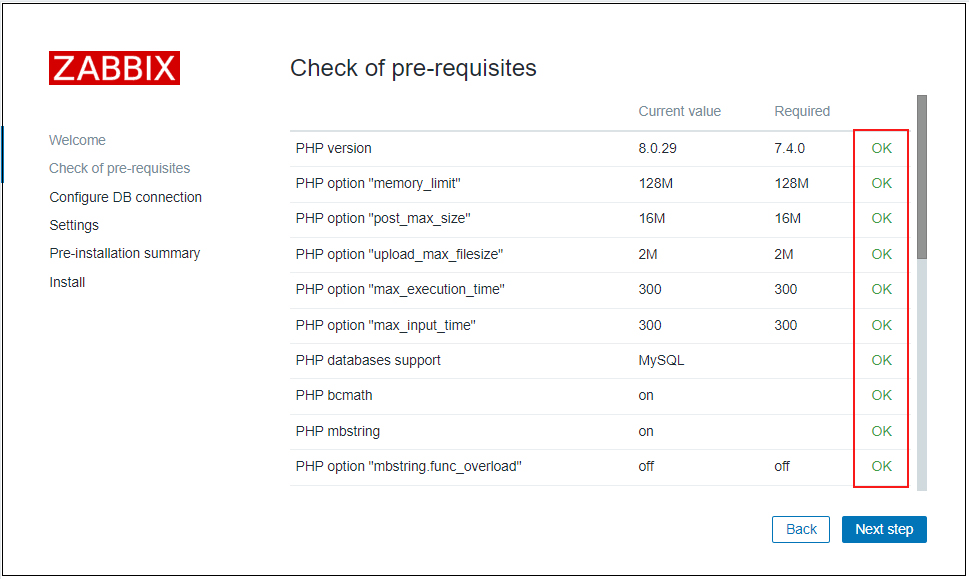
After confirming that all requirements are OK, click [ Next step]
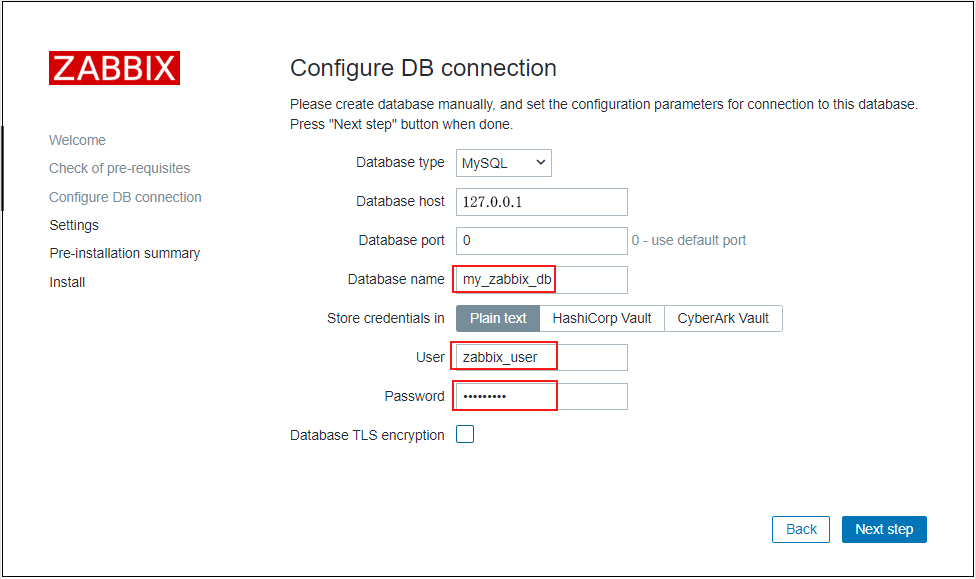
Enter the information you have set in the "Database name", "User", and "Password" fields, and click [ Next step ].
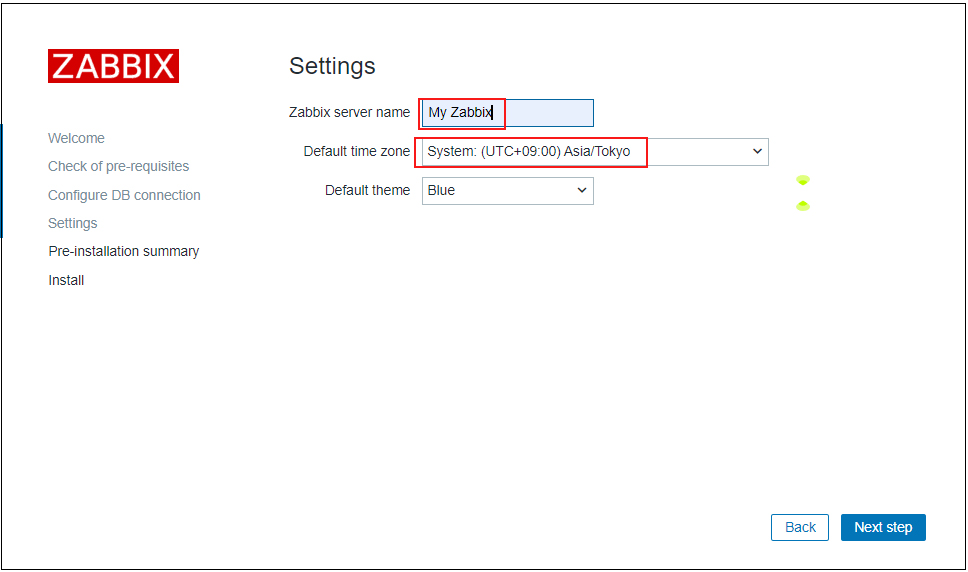
Enter any name for "Zabbix server names" and select Asia/Tokyo for time zone.
After confirming that you are in your own time zone, click [ Next step ].
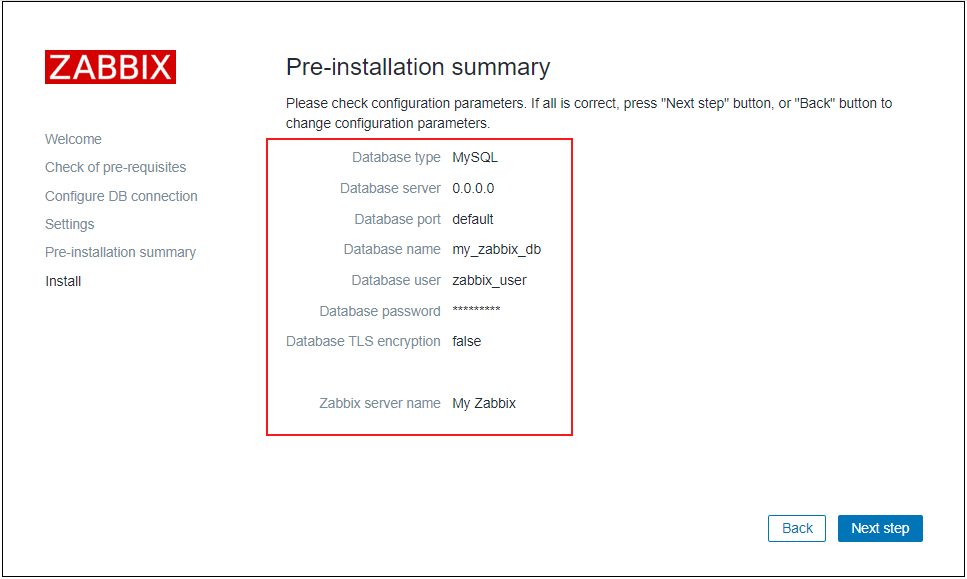
Reconfirm settings If information is correct, click [Next step]
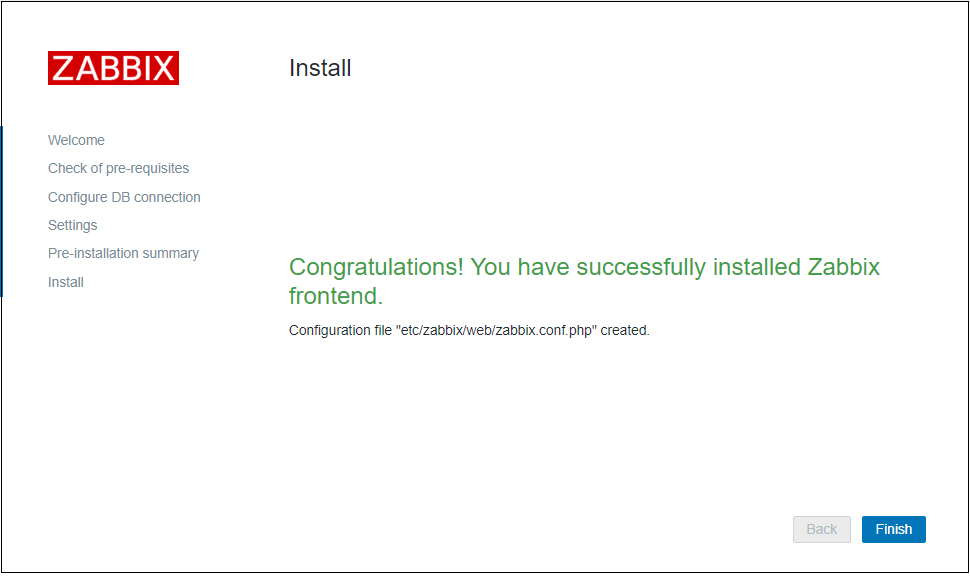
When the installation is successfully completed, the following page will appear. Click "Finish"
You will be redirected to Zabbix login page
Log in using the following default credentials
Username:Admin
Password:zabbix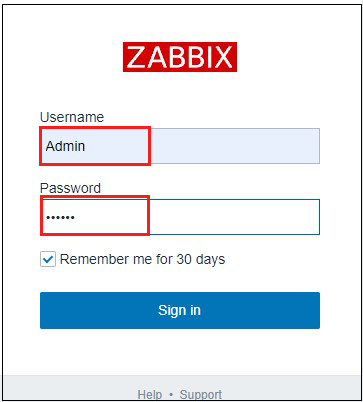
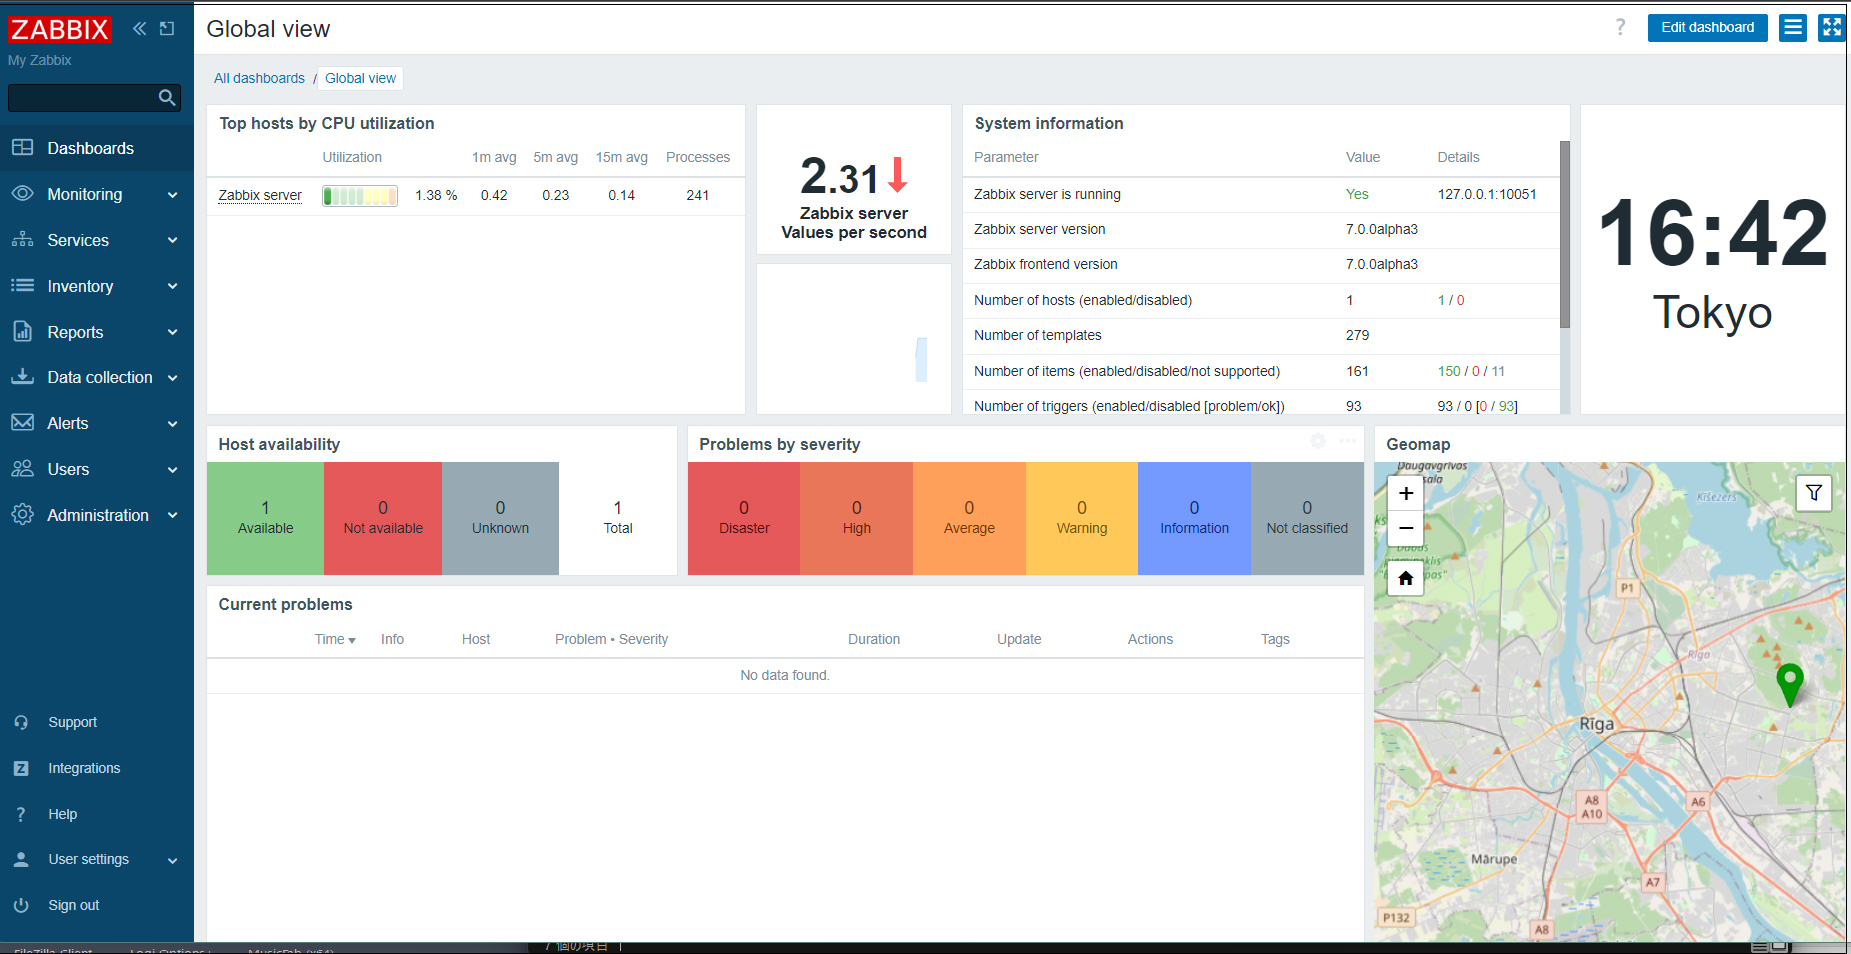
After successful login you will see the following screen (Zabbix Dashboard).
Various settings of Zabbix
Change Admin Password
For security purposes, change the default administrator password
Once the above dashboard is displayed, continue with
①Select [Users] - [Users] in the left pane and click [Admin] in the right pane
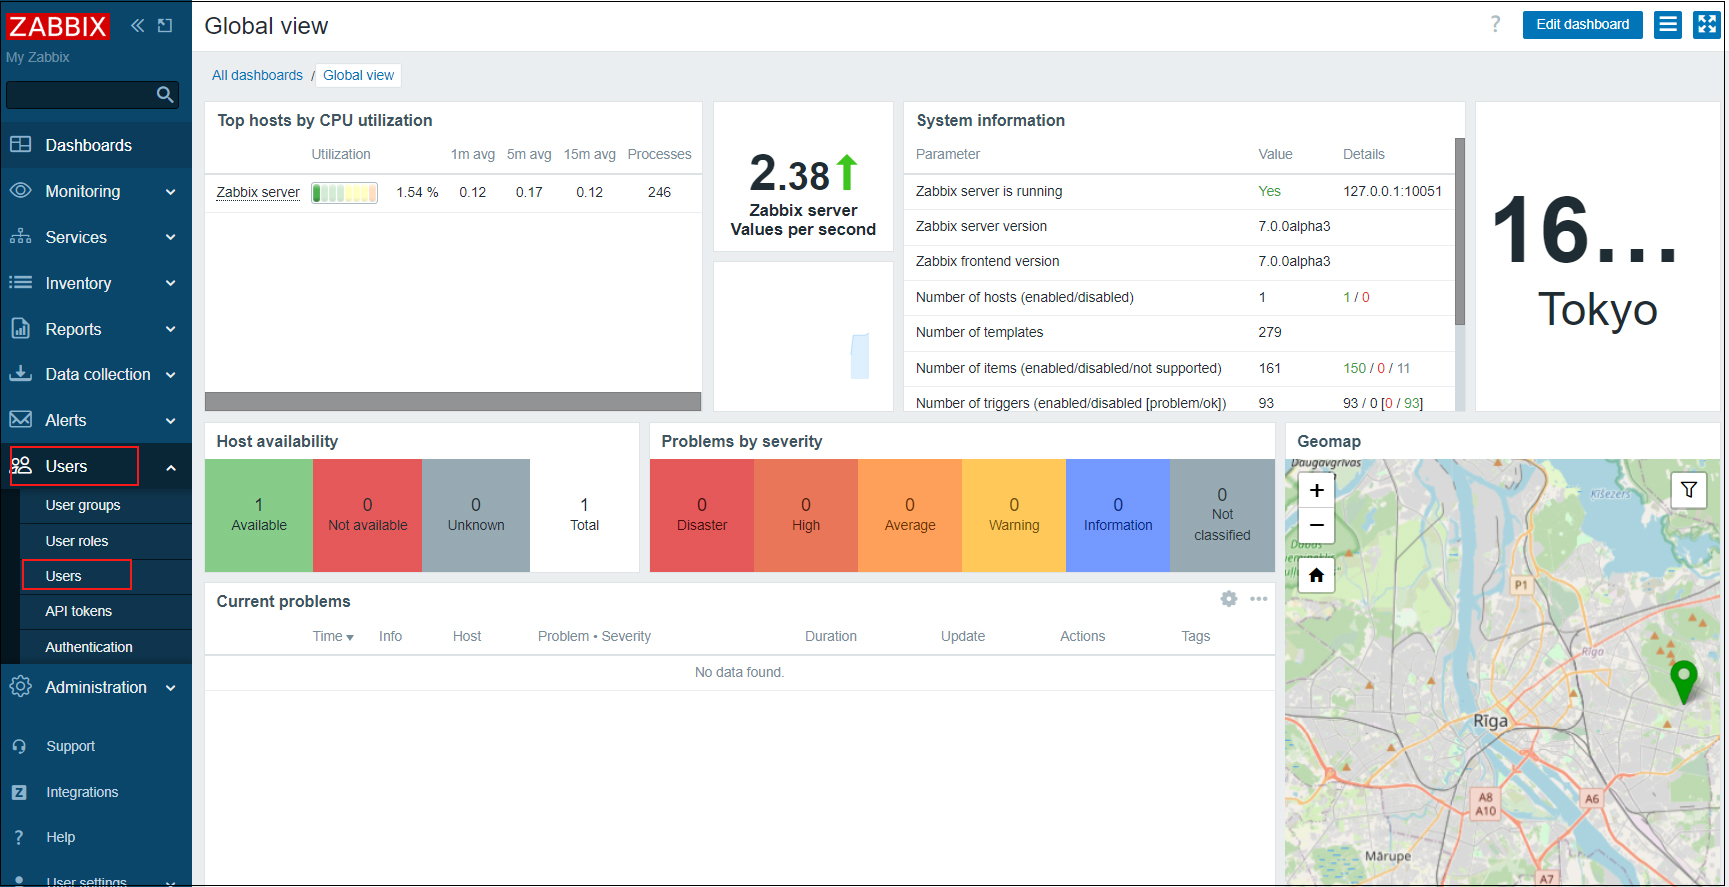
②Click [Change paddword]
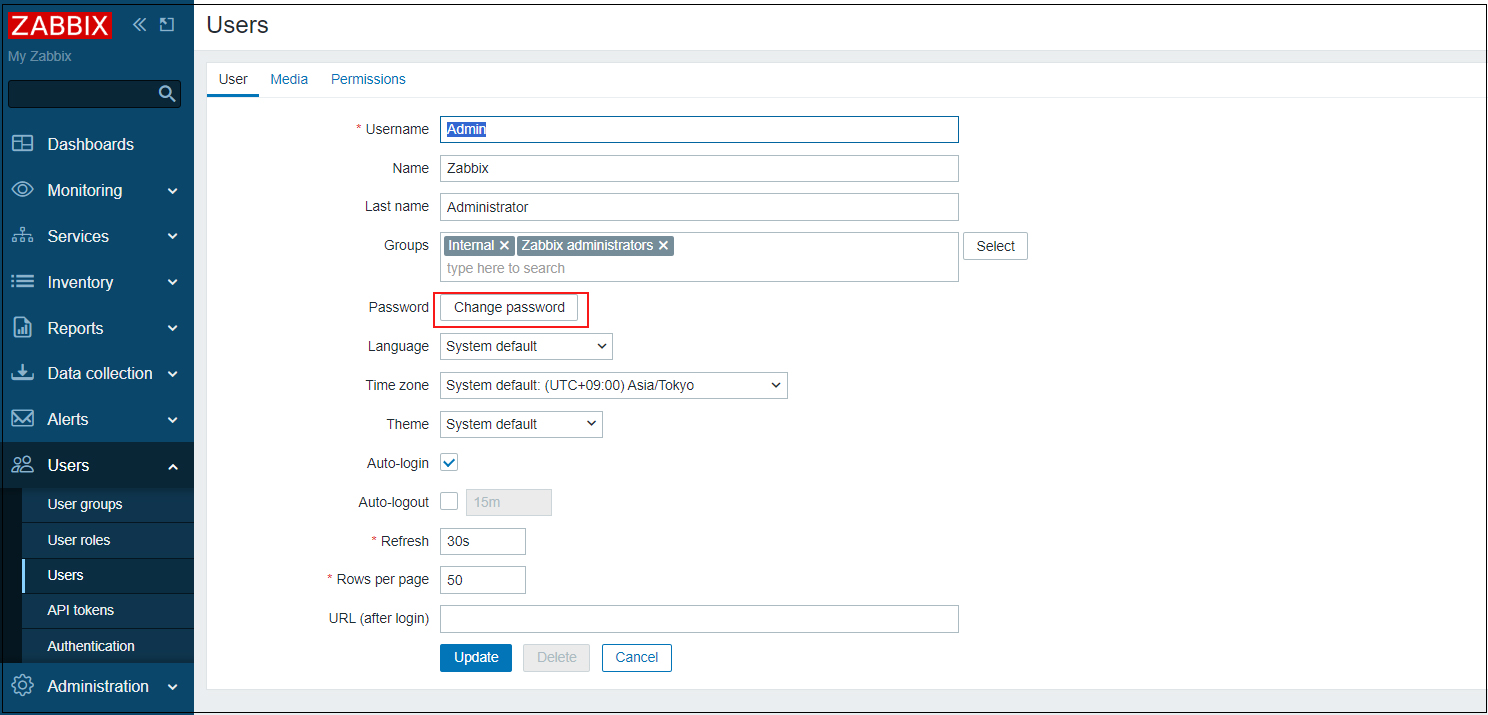
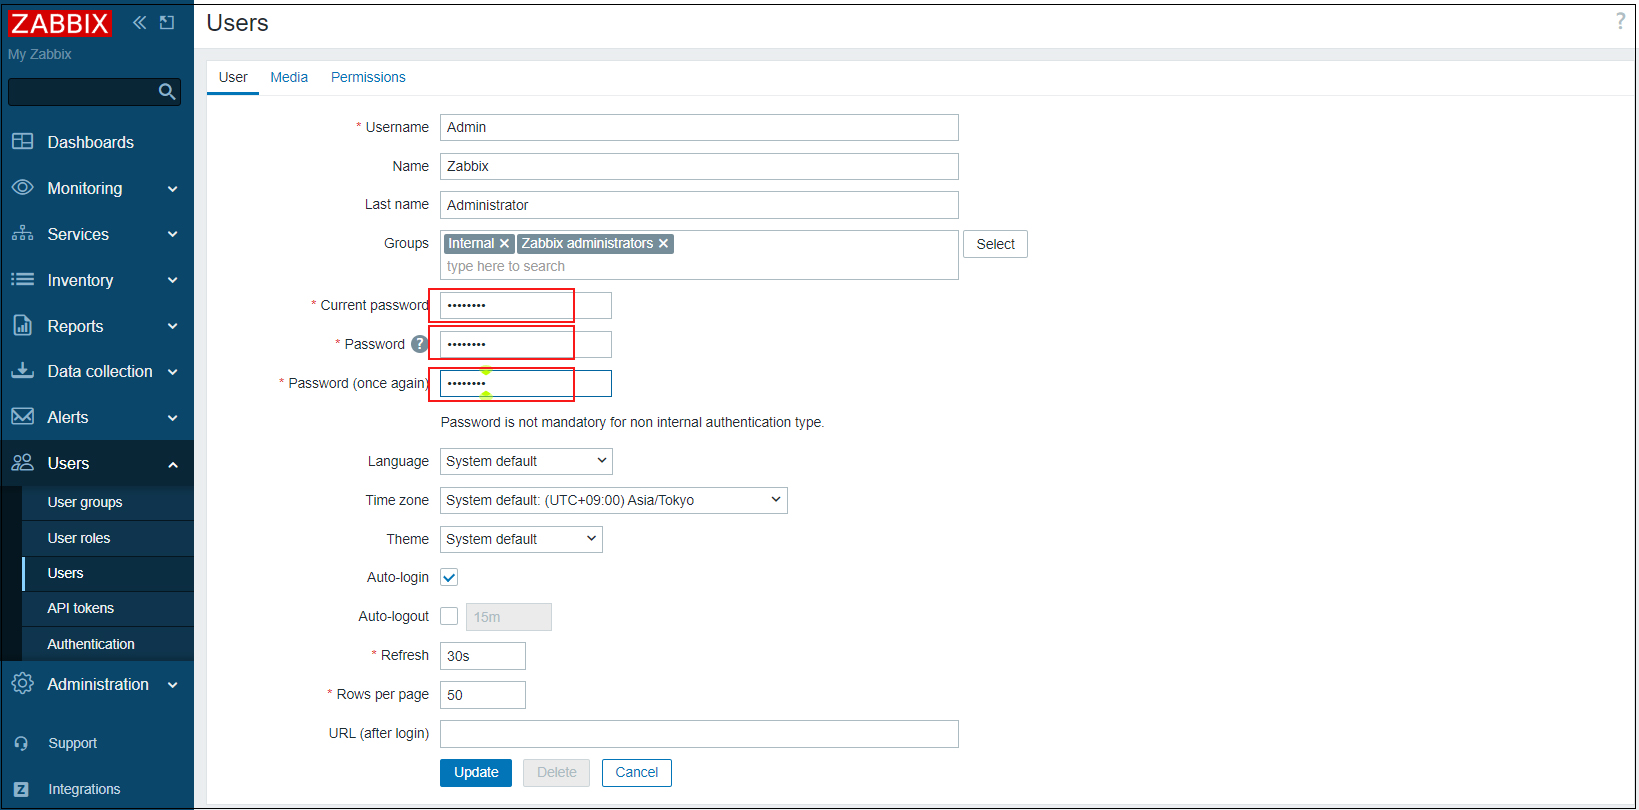
③Current password : Enter default password zabbix
Enter the password you wish to change and click Update.
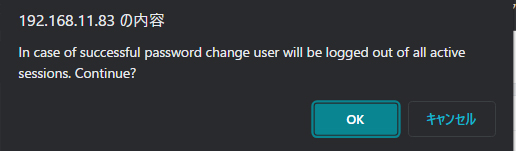
The following will be displayed and when you click "OK", you will be taken to the login authentication screen again, so log in with the changed password.
Monitoring Host Configuration
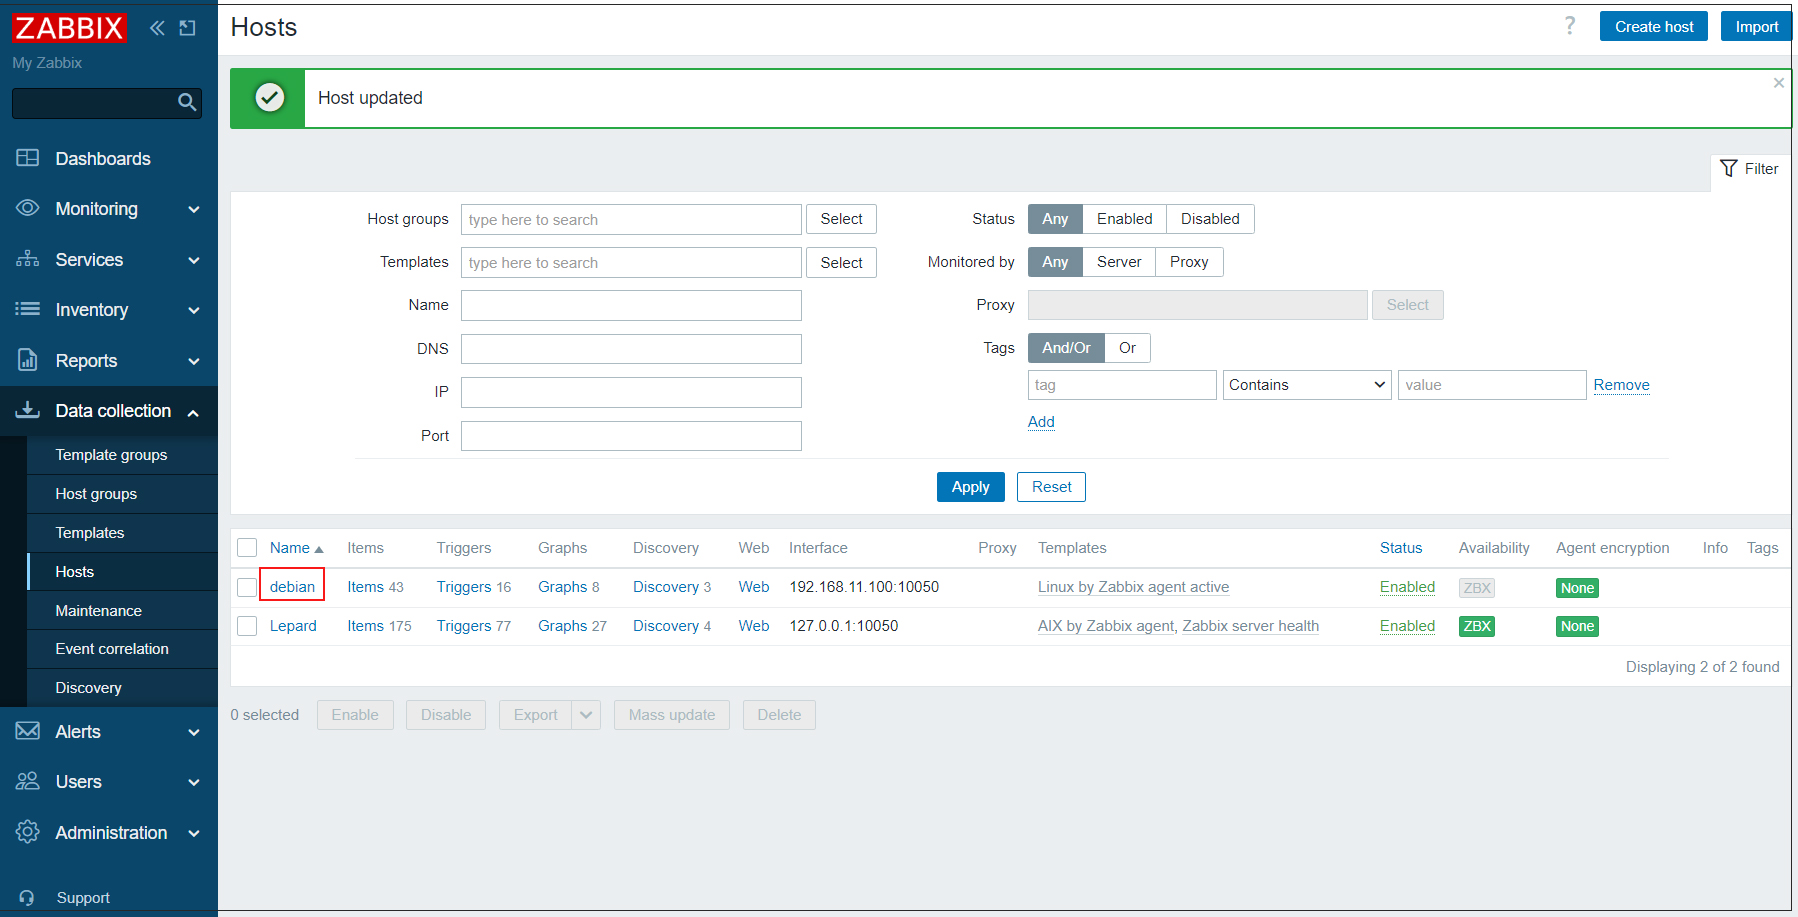
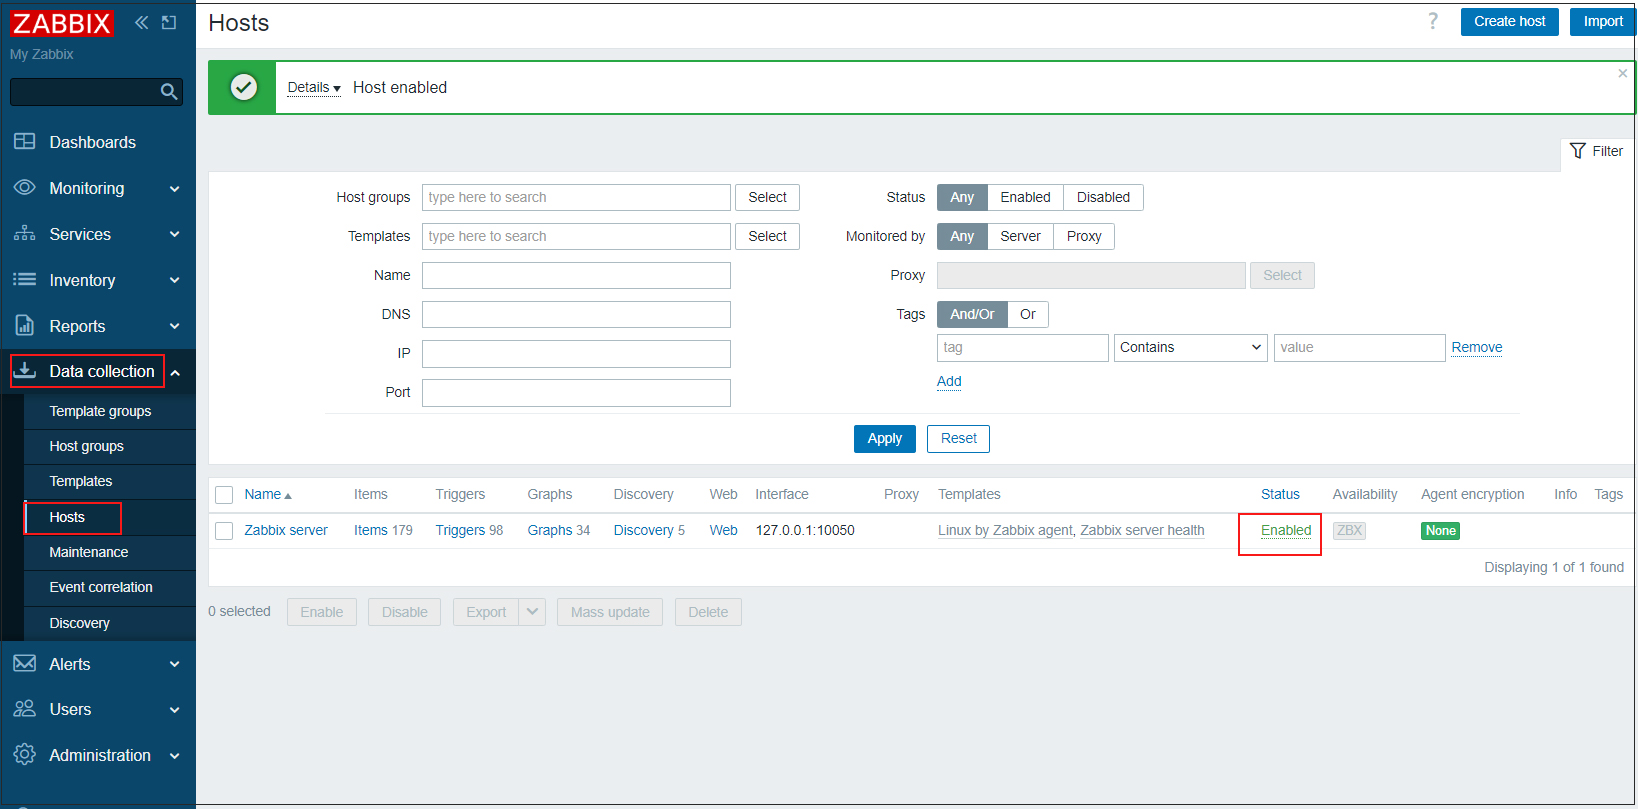
①Log in to the Zabbix administration site and select [Data collection] - [Hosts] in the left pane.
In the right pane, you should see the local hosts with Zabbix Agent installed, check them and click the "Enable" button.(Currently I think only the zabbix server itself is visible)
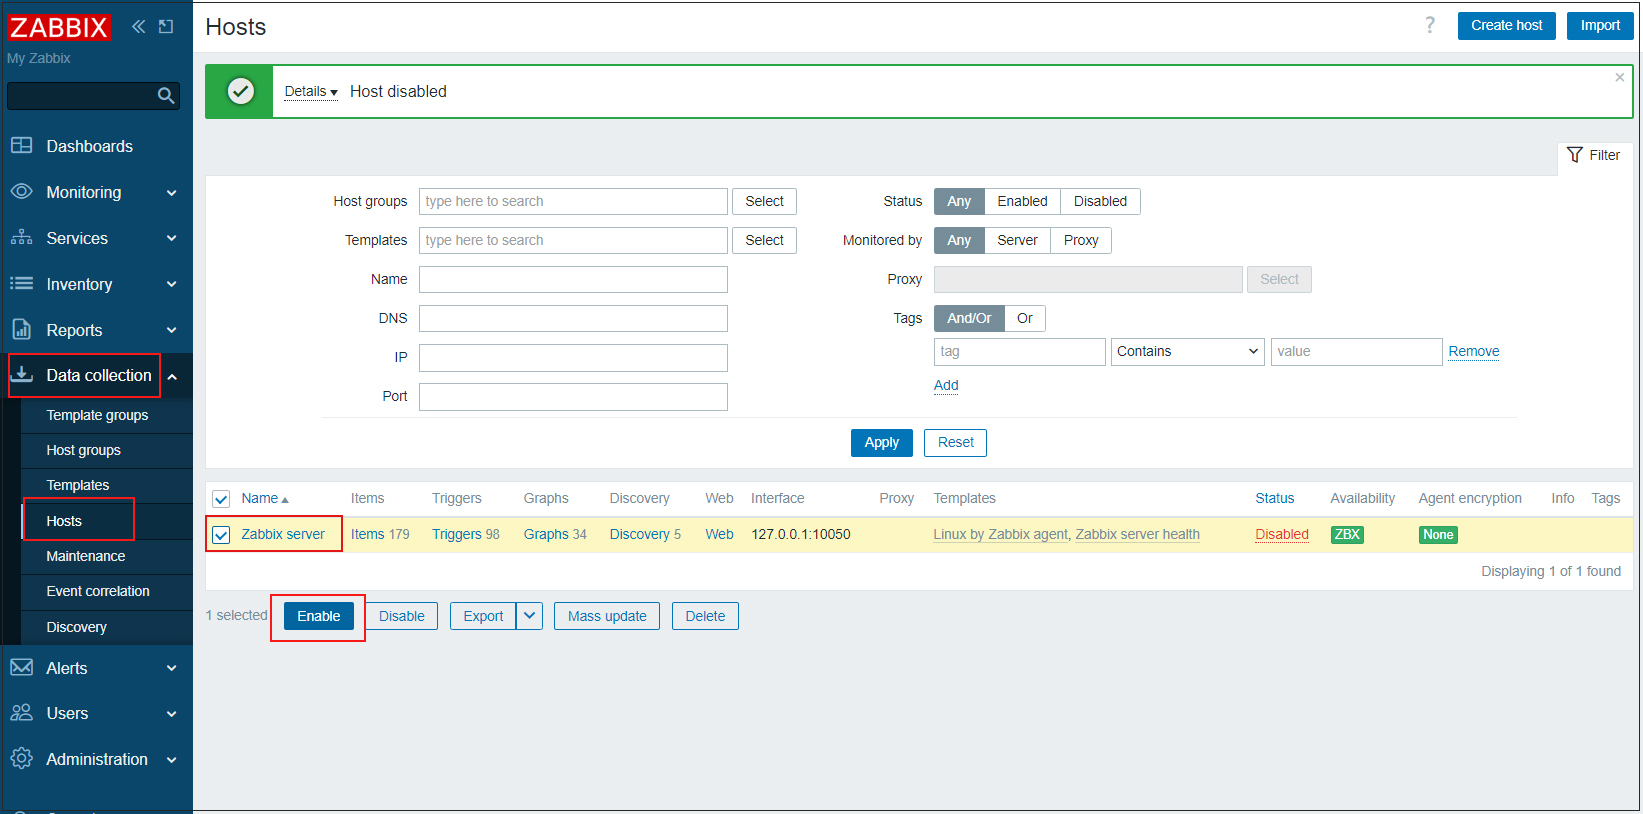
②[Status] will change to [Enabled] and the system will be monitored. Since the template for Linux is set by default, this is all that is needed to monitor major items such as CPU usage.
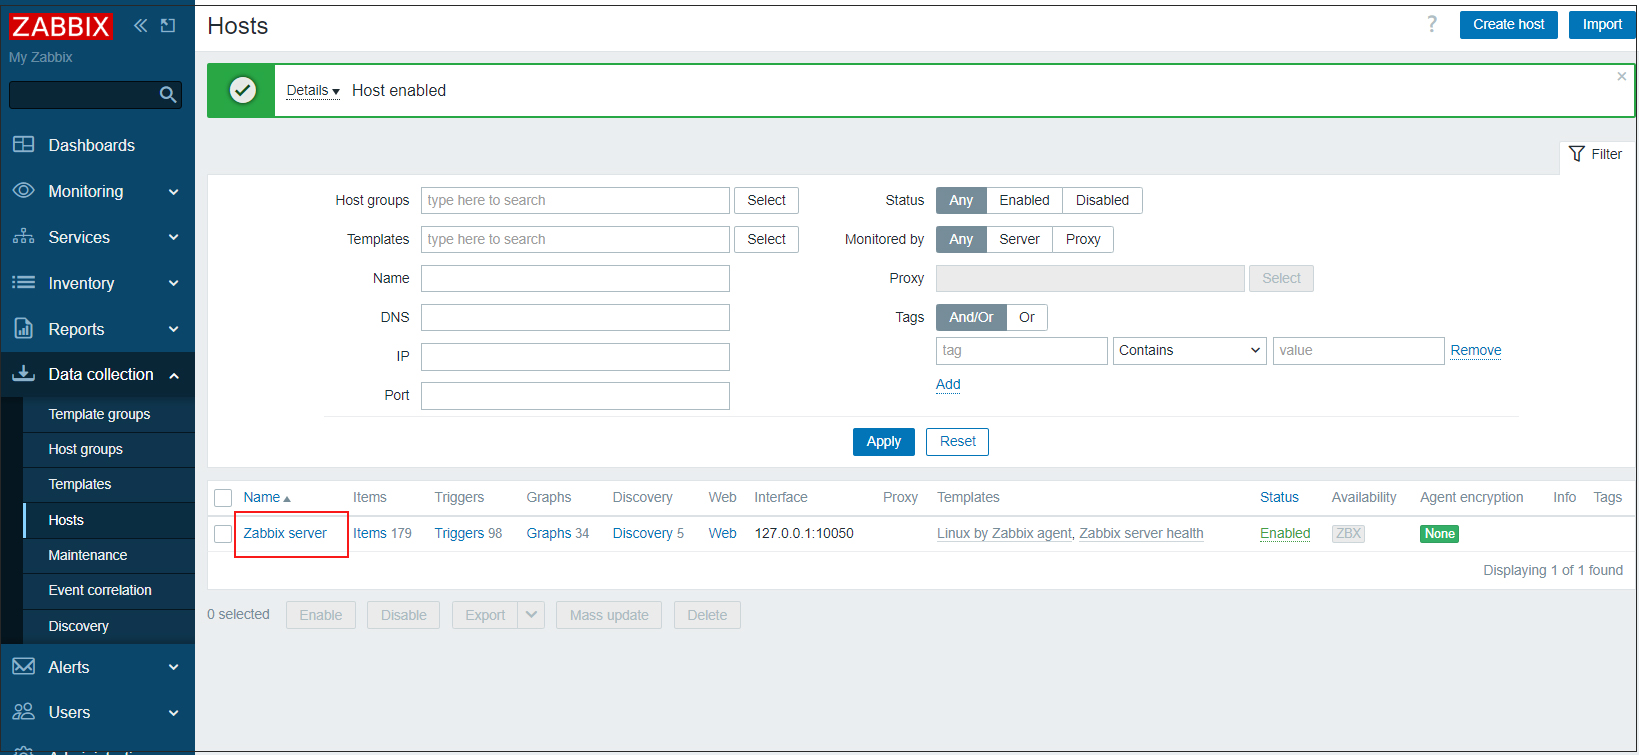
③Host name is registered with Zabbix server by default, which should match [Hostname=***] set in /etc/zabbix/zabbix_agentd.conf.Click on "Zabbix server", make changes and click on "Update" button.
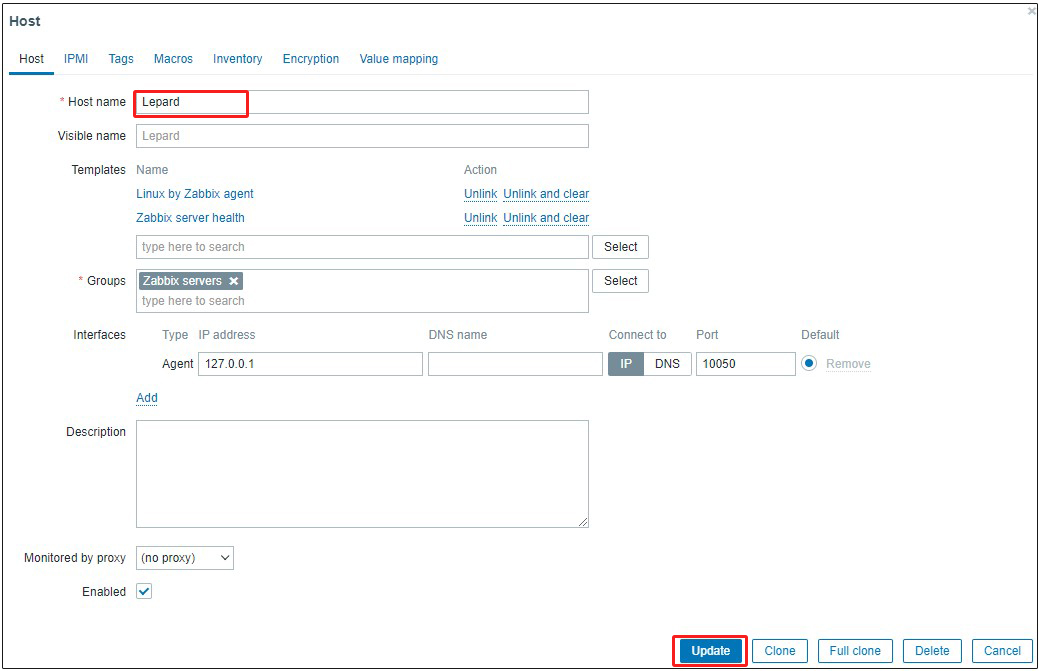
Host name has been changed to Lepard
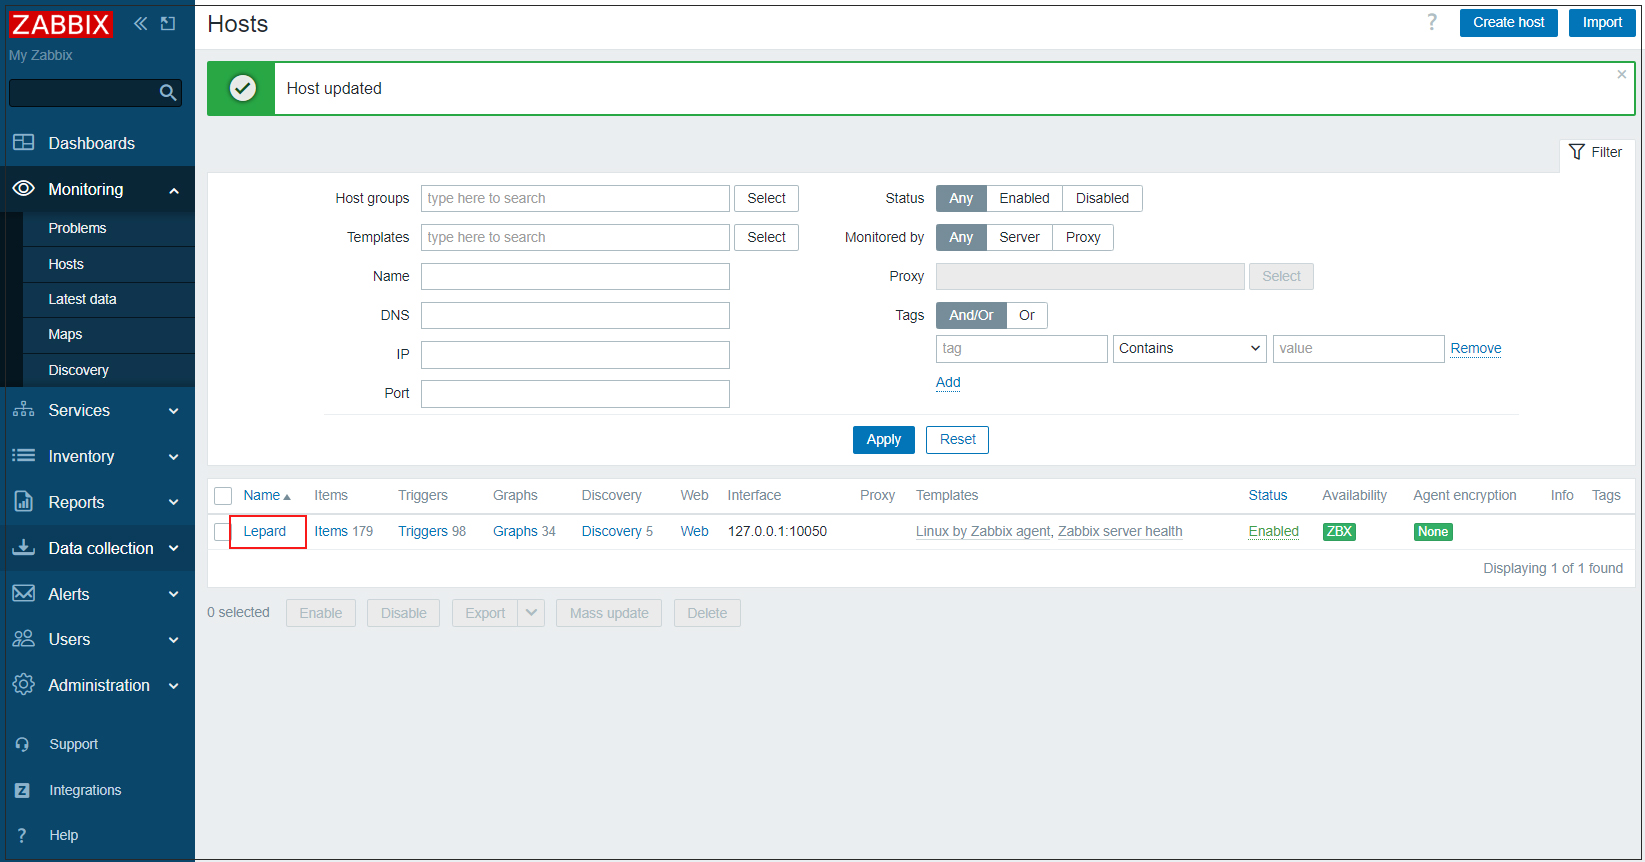
④After some time has passed, various data will be collected and the status of the server can be checked as shown below.
Left side Monitoring > Hosts Click Lepard Select [Grahs]
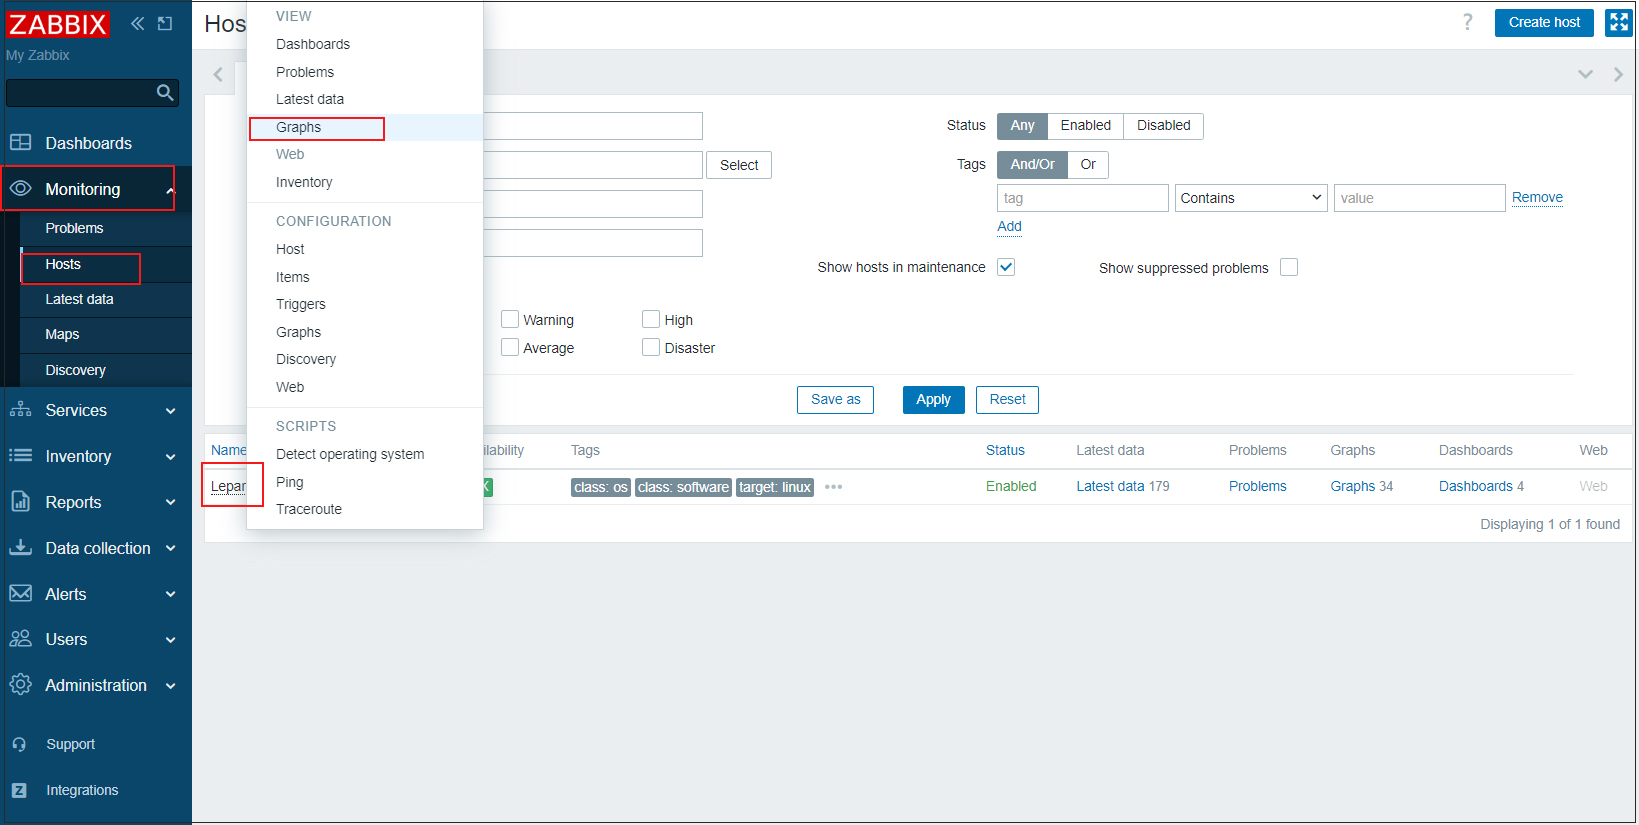
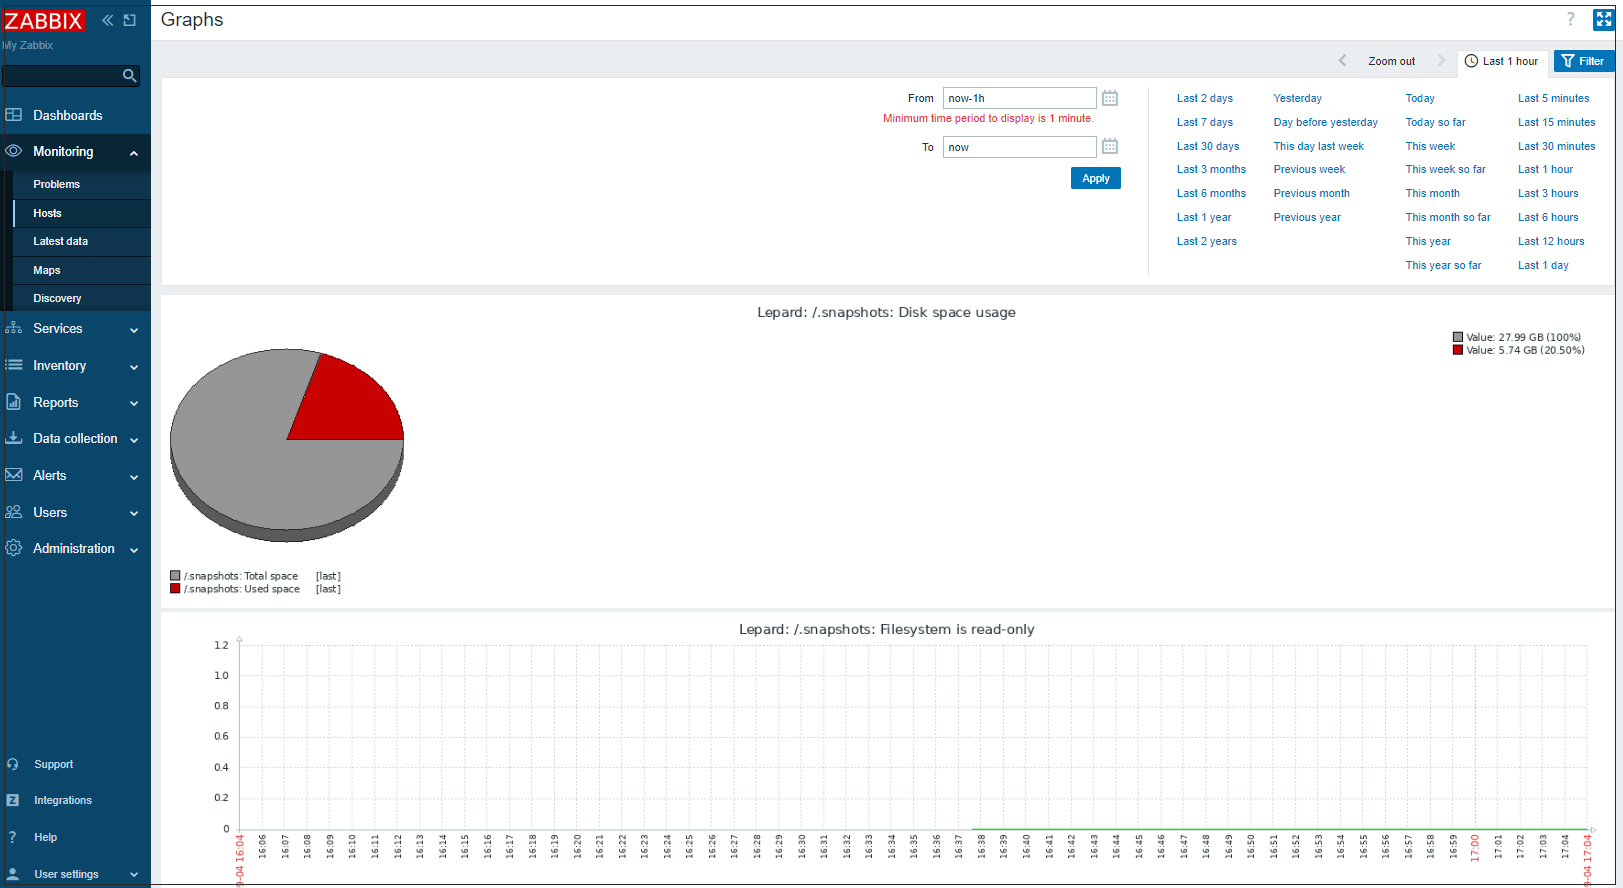
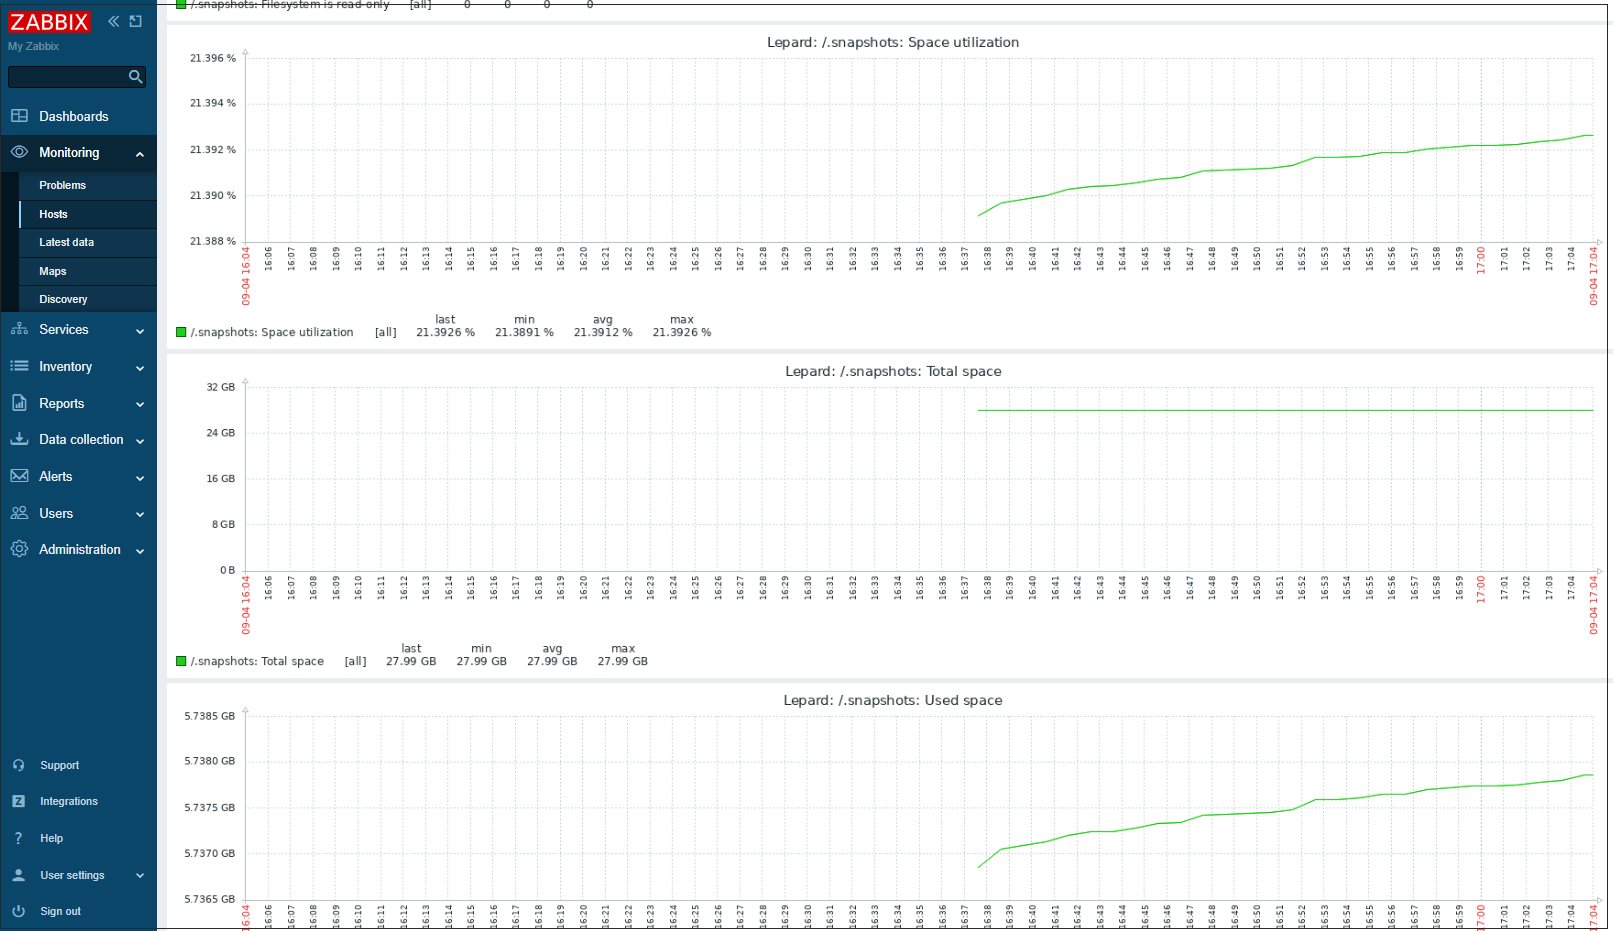
The following monitoring status screen will appear
Add monitored hosts
Added the following servers as targets
OS : Debian12
IP address : 192.168.11.100
1.Configuration on the server you want to monitor
1.1Install Zabbix Agent on the server you want to monitor
|
1 |
# wget https://repo.zabbix.com/zabbix/6.5/debian/pool/main/z/zabbix-release/zabbix-release_6.5-1%2Bdebian12_all.deb |
|
1 |
# dpkg -I zabbix-release_6.5-1+debian12_all.deb |
|
1 |
# apt update |
|
1 |
# apt -y install zabbix-agent2 |
1.2.Edit zabbix-agent configuration file
|
1 2 3 4 5 6 7 8 |
# vi /etc/zabbix/zabbix_agent2.conf # Line 78 : Zabbix Specify Zabbix server (in this case 192.168.11.83) Server=192.168.11.83 # Line 131 : Specify Zabbix server (in this case 192.168.11.83) ServerActive=192.168.11.83 # Line 142 : Change to your own hostname (debian this time) Hostname=debian |
|
1 |
# systemctl restart zabbix-agent2 |
2. Configuration in Zabbix WEB UI
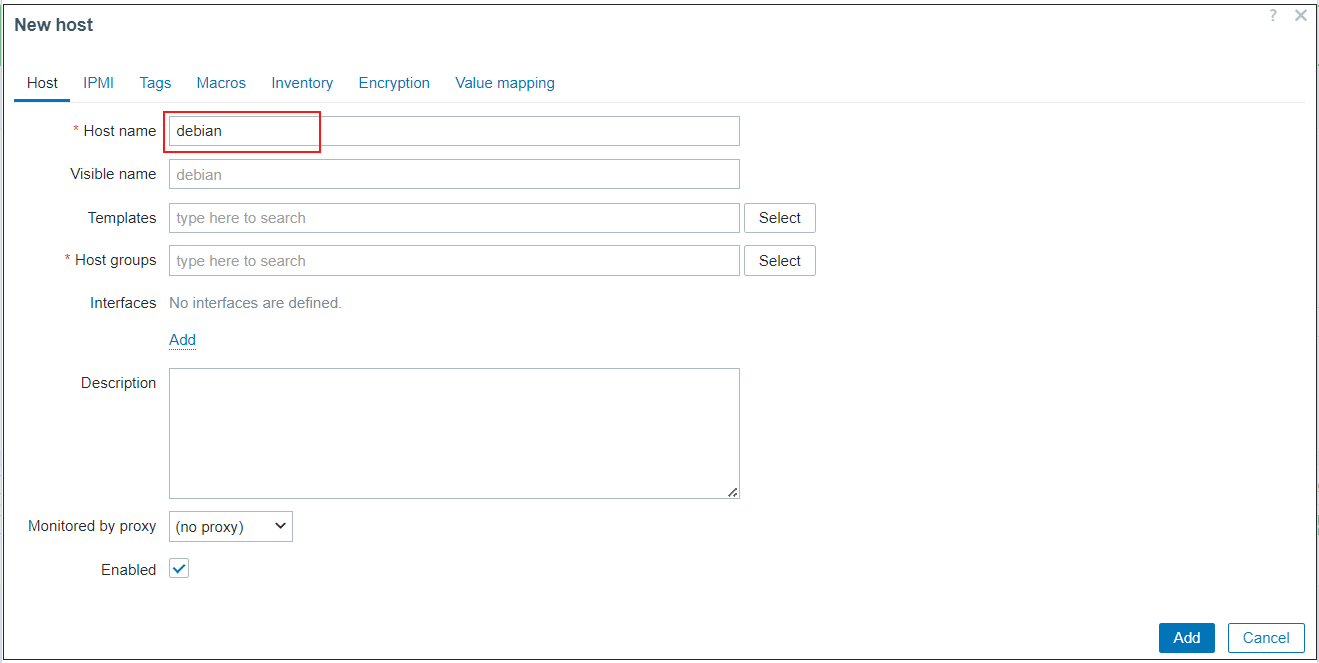
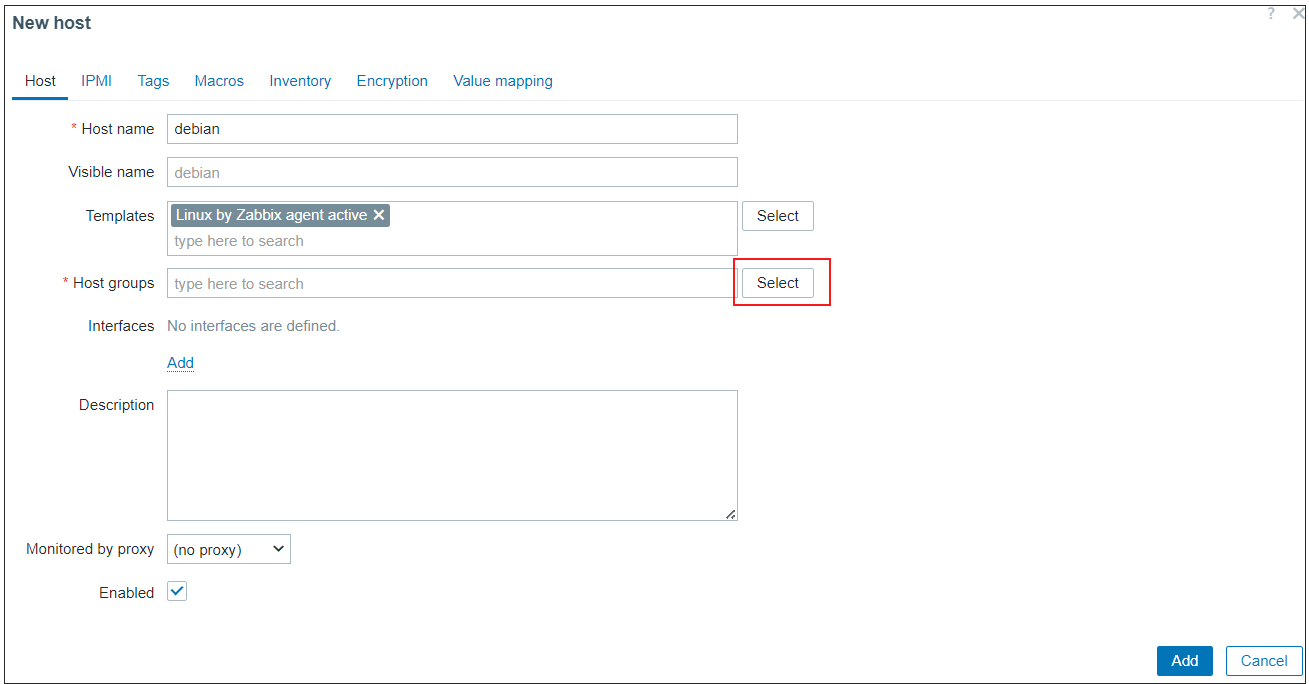
Log in to the Zabbix administration site, select [Datacollection] - [Hosts] in the left pane and click the [Create Host] button at the top of the right pane.
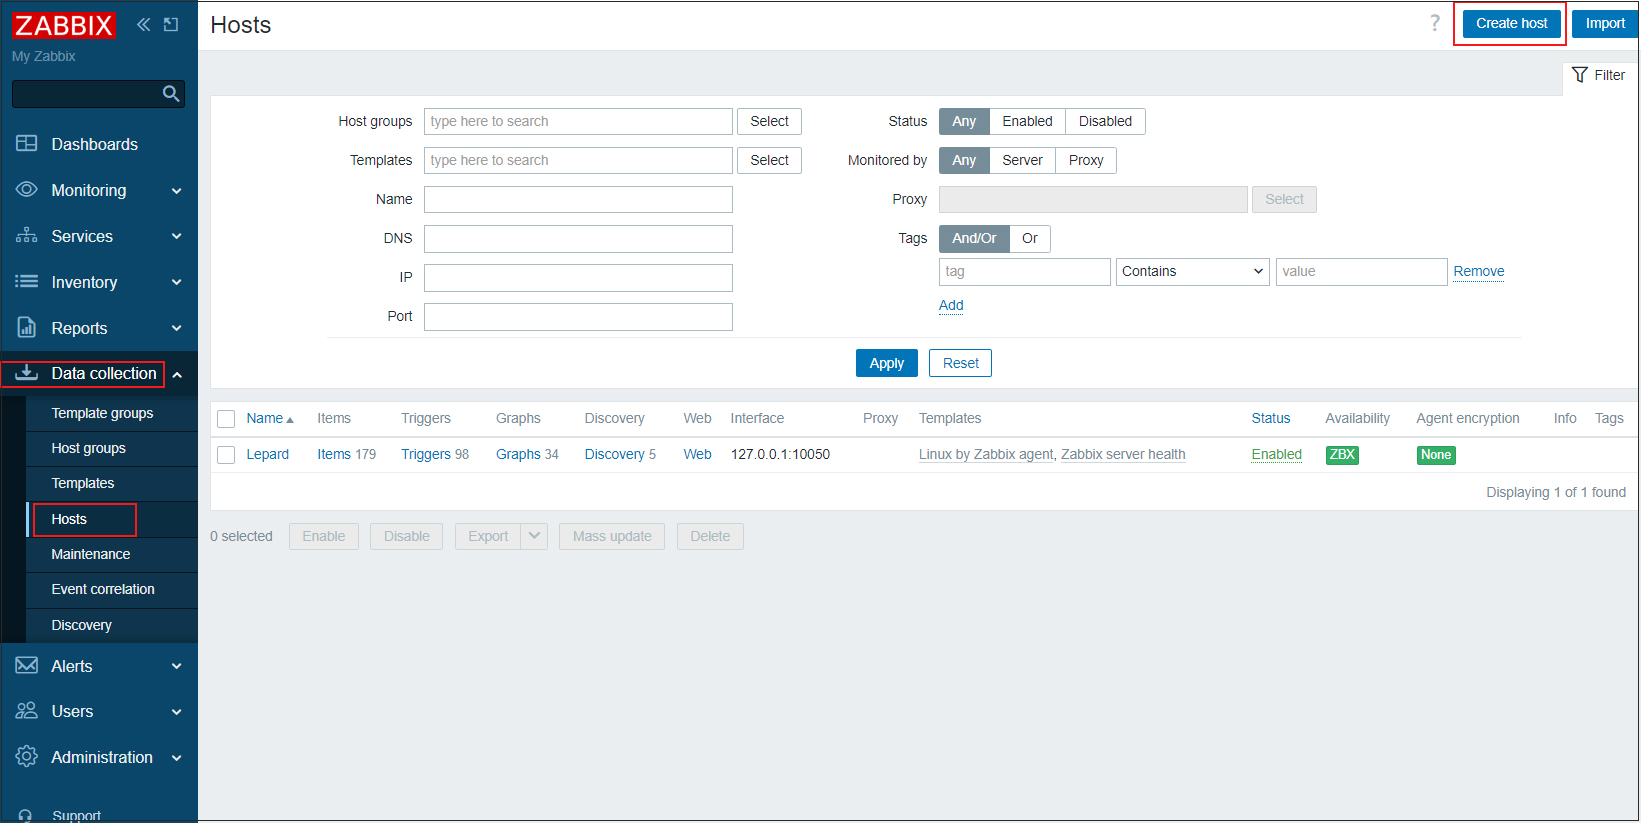
Enter a hostname in the [Hostname] field.
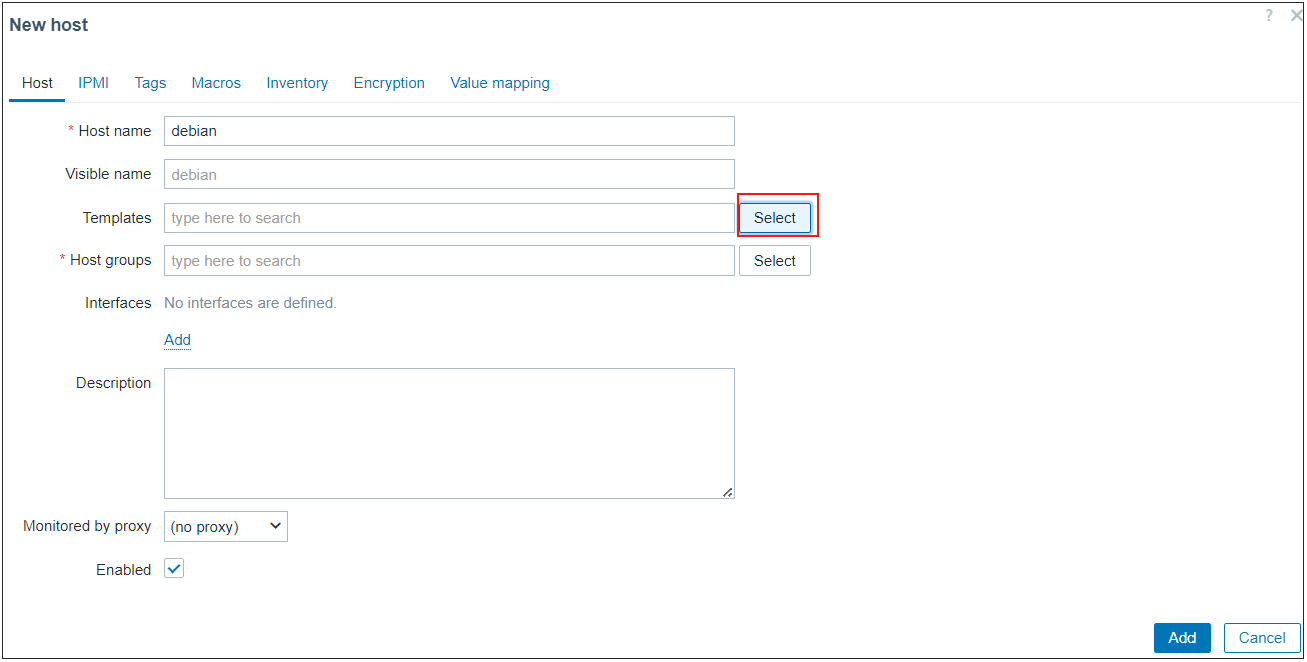
Click the [Select] button to the right of the [Templates] item.
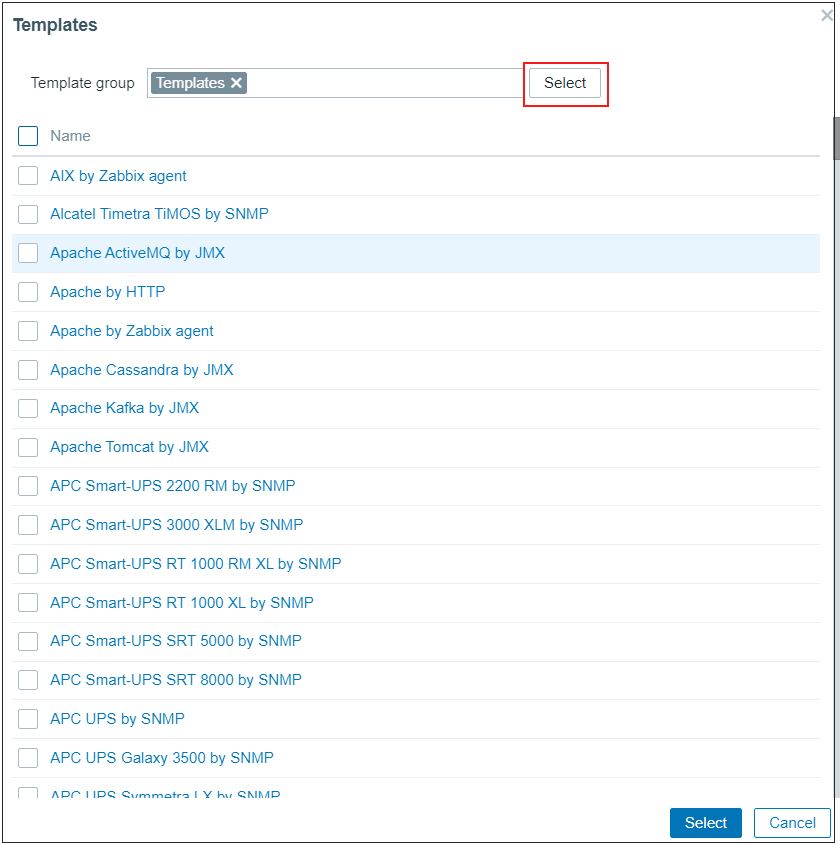
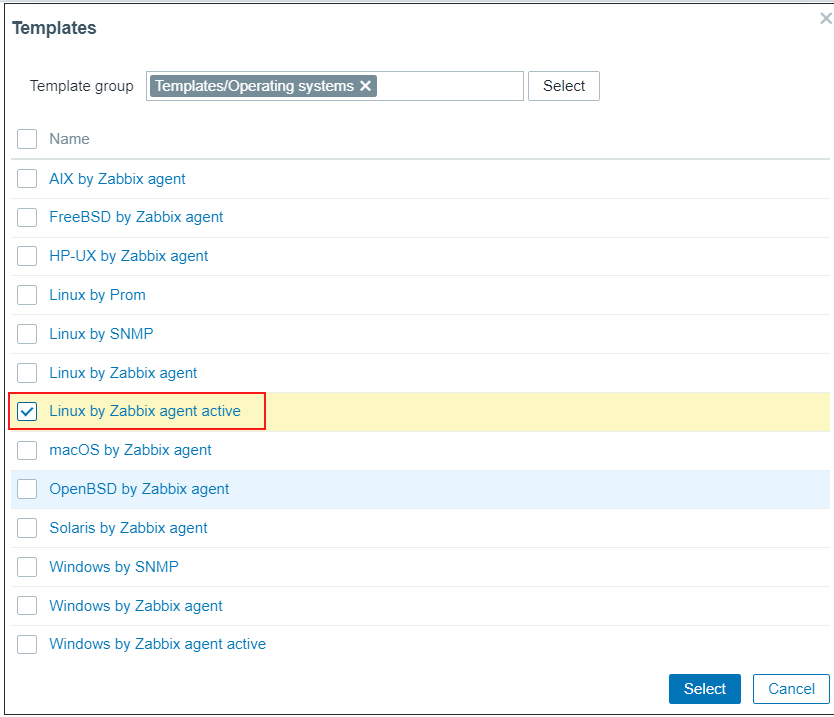
Click [Select]
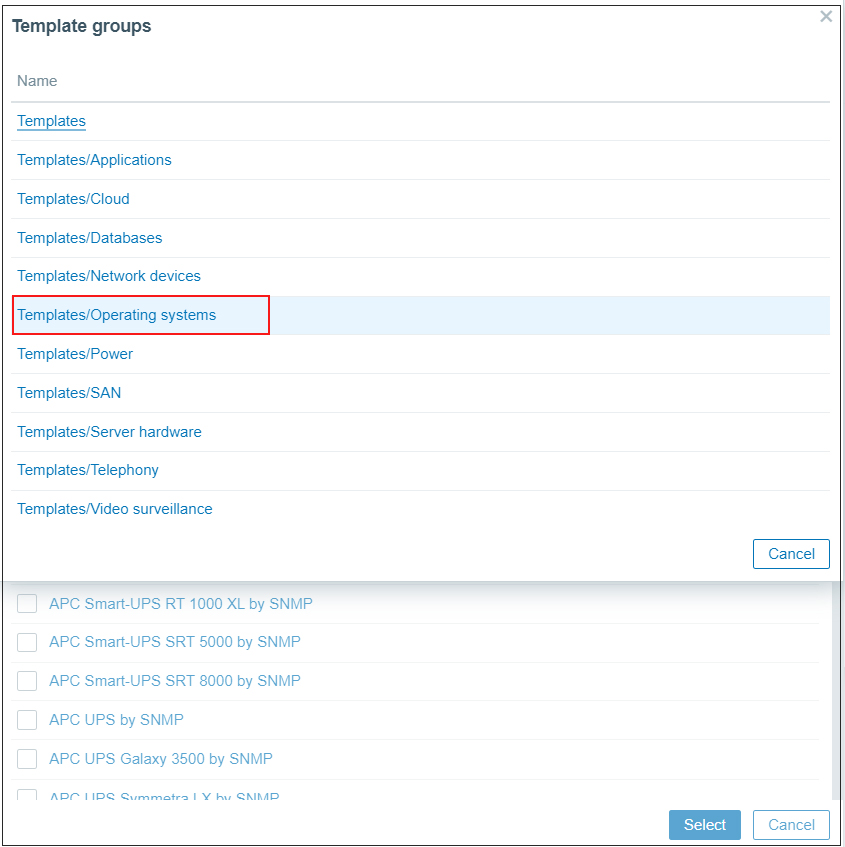
Select [Templates/Operating systems]
Select [Linux by Zabbix agent active]
Under [Host groups] click "Select"
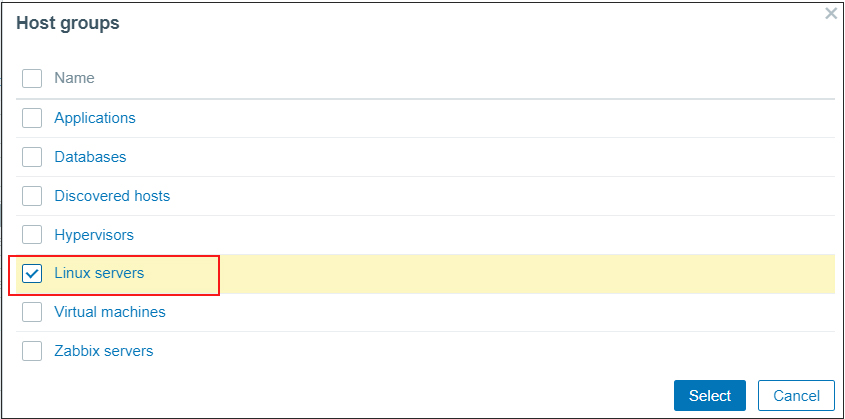
Select [Linux servers]
[Interfaces]-[Add]- [Agent] click
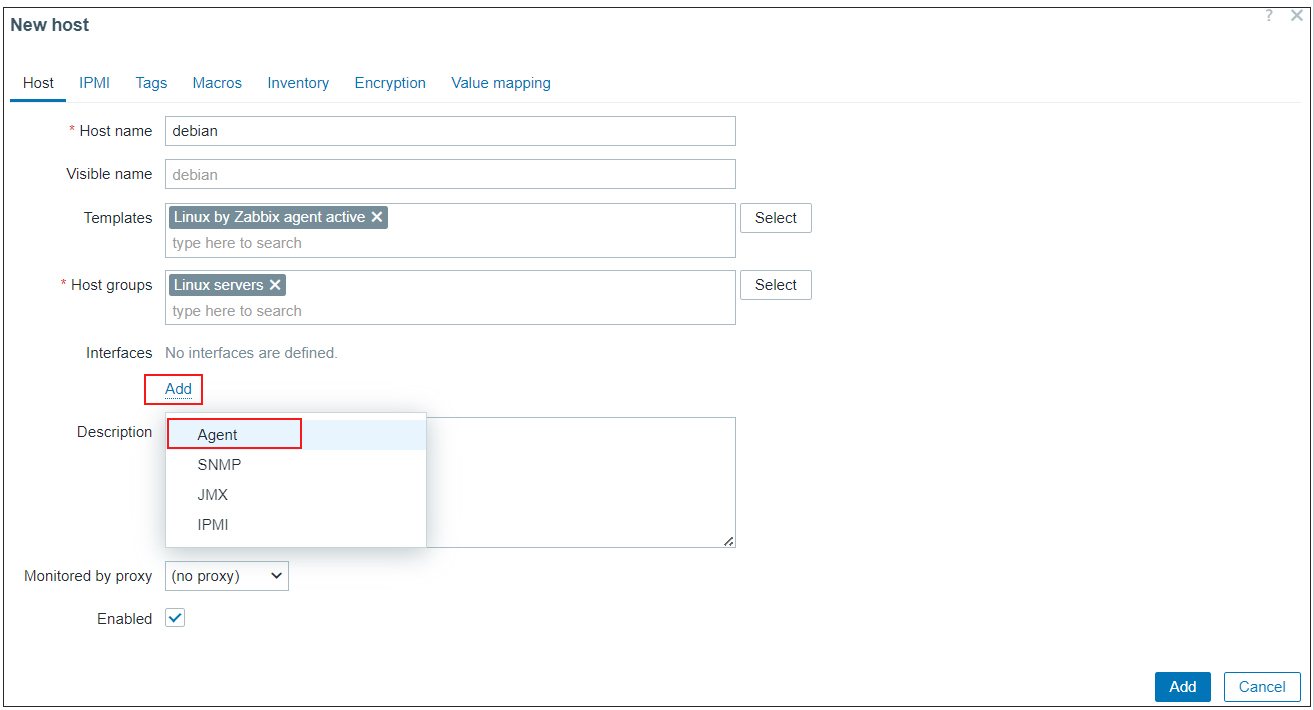
Enter the [IP address] and [DNS name] of the monitored server and click [Update].
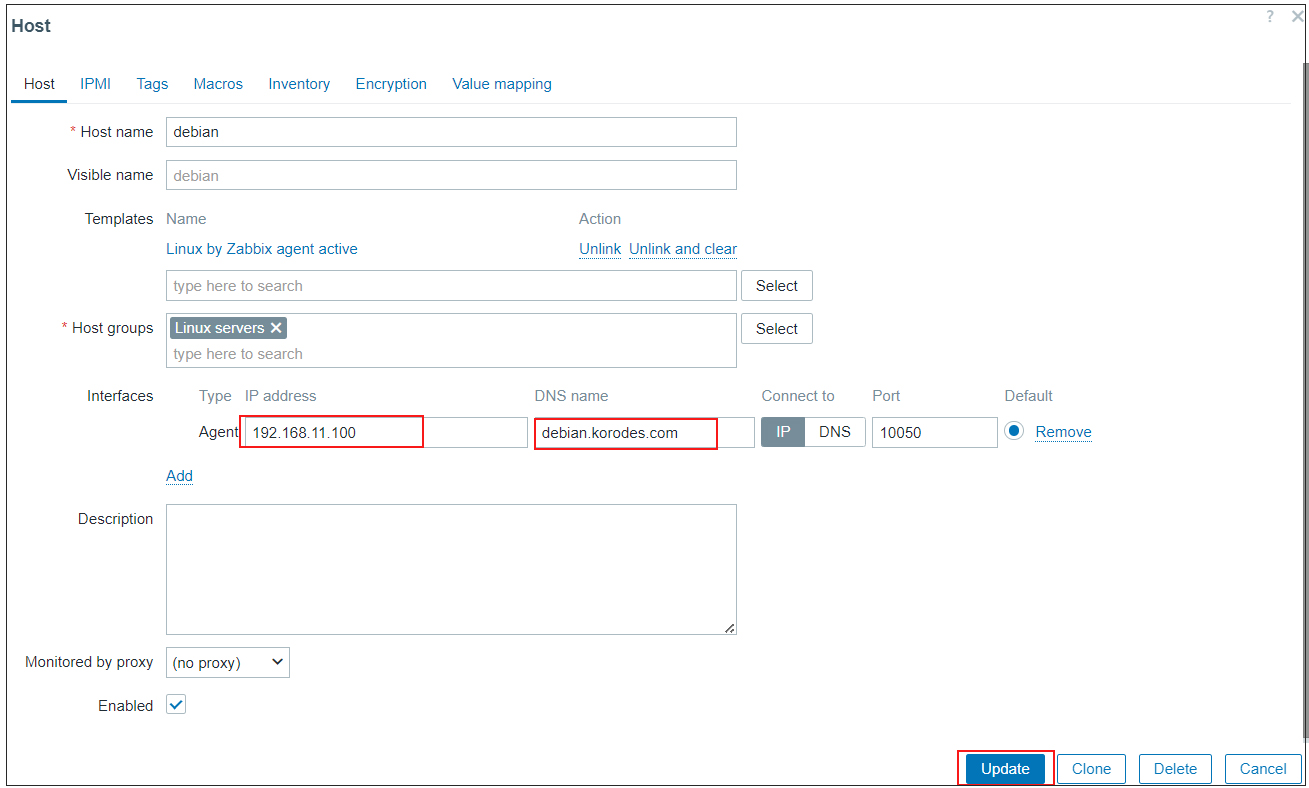
New monitored servers are registered.