

Prerequisite
We will install Suricata IDS and Elastic on the following servers
・1st server Suricata IDS & Filebeat : Debian13.5 IP(192.168.11.83)
・2nd server Elasticsearch & kibana : Debian13.1 IP(192.168.11.85)
1st server Suricata Install
SURICATA IDS/IPS is an open source IDS that monitors communications on the network and detects suspicious traffic. Its basic mechanism is signature-based, so it can detect predefined unauthorized communications. Suricata is also characterized by its ability to provide protection as well as detection.
1.Suricata
①Install required packages
# apt -y install wget curl dirmngr apt-transport-https gnupg2 ca-certificates lsb-release debian-archive-keyring unzip
➁Suricata install
# apt update
# apt -y install suricata
Check Version
# suricata -V
This is Suricata version 7.0.10 RELEASE
Enable suricata.service to run on system reboot
# systemctl enable suricata.service
Synchronizing state of suricata.service with SysV service script with /usr/lib/systemd/systemd-sysv-install.
Executing: /usr/lib/systemd/systemd-sysv-install enable suricata
Stop the Suricata service as it needs to be configured first.
# systemctl stop suricata.service
2. Configure Suricata
①Determine interface and IP address where Suricata will inspect network packets
# ip --brief add
lo               UNKNOWN        127.0.0.1/8 ::1/128
ens33            UP             192.168.11.83/24 fe80::20c:29ff:fe8b:5daa/64
Edit /etc/suricata/suricata.yaml file
# vi /etc/suricata/suricata.yaml

Line 18 : Change (own network)
HOME_NET: "[192.168.11.0/24]"

Per Line136 : change
community-id: false → community-id: true

Per Line 623 : change
af-packet:
  - interface: eth0
↓
af-packet:
  - interface: ens33 ←Change to your own interface name
➁Add rule set
Suricata has a tool called suricata-update that allows you to retrieve rulesets from external providers. You can download the latest rulesets for your suricata server by running
# suricata-update -o /var/lib/suricata/rules

-------------------------------------------------------------
21/5/2026 -- 11:03:33 - <Info> -- Loaded 66118 rules.
21/5/2026 -- 11:03:33 - <Info> -- Disabled 15 rules.
21/5/2026 -- 11:03:33 - <Info> -- Enabled 0 rules.
21/5/2026 -- 11:03:33 - <Info> -- Modified 0 rules.
21/5/2026 -- 11:03:33 - <Info> -- Dropped 0 rules.
21/5/2026 -- 11:03:33 - <Info> -- Enabled 136 rules for flowbit dependencies.
21/5/2026 -- 11:03:33 - <Info> -- Backing up current rules.
21/5/2026 -- 11:03:33 - <Info> -- Writing rules to /var/lib/suricata/rules/suricata.rules: total: 66118; enabled: 50209; added: 66118; removed 0; modified: 0
21/5/2026 -- 11:03:33 - <Info> -- Writing /var/lib/suricata/rules/classification.config
21/5/2026 -- 11:03:33 - <Info> -- Testing with suricata -T.
21/5/2026 -- 11:04:04 - <Info> -- Done.
It shows that suricata-update has retrieved the free Emerging Threats ET Open Rules and saved them in Suricata's /etc/suricata/rules/suricata.rules file. It also shows the number of rules processed, in this example 66118 were added, of which 50209 were activated.
➂Adding Rule Set Providers
List Default Providers
# suricata-update list-sources

Name: abuse.ch/feodotracker
  Vendor: Abuse.ch
  Summary: Abuse.ch Feodo Tracker Botnet C2 IP ruleset
  License: CC0-1.0
Name: abuse.ch/sslbl-blacklist
  Vendor: Abuse.ch
  Summary: Abuse.ch SSL Blacklist
  License: CC0-1.0
  Replaces: sslbl/ssl-fp-blacklist
Name: abuse.ch/sslbl-c2
  Vendor: Abuse.ch
  Summary: Abuse.ch Suricata Botnet C2 IP Ruleset
  License: CC0-1.0
Name: abuse.ch/sslbl-ja3
  Vendor: Abuse.ch
  Summary: Abuse.ch Suricata JA3 Fingerprint Ruleset
  License: CC0-1.0
  Replaces: sslbl/ja3-fingerprints
Name: abuse.ch/urlhaus
  Vendor: abuse.ch
  Summary: Abuse.ch URLhaus Suricata Rules
  License: CC0-1.0
Name: aleksibovellan/nmap
  Vendor: aleksibovellan
  Summary: Suricata IDS/IPS Detection Rules Against NMAP Scans
  License: MIT
Name: et/open
  Vendor: Proofpoint
  Summary: Emerging Threats Open Ruleset
  License: MIT
Name: et/pro
  Vendor: Proofpoint
  Summary: Emerging Threats Pro Ruleset
  License: Commercial
  Replaces: et/open
  Parameters: secret-code
  Subscription: https://www.proofpoint.com/us/threat-insight/et-pro-ruleset
Name: etnetera/aggressive
  Vendor: Etnetera a.s.
  Summary: Etnetera aggressive IP blacklist
  License: MIT
Name: oisf/trafficid
  Vendor: OISF
  Summary: Suricata Traffic ID ruleset
  License: MIT
Name: pawpatrules
  Vendor: pawpatrules
  Summary: PAW Patrules is a collection of rules for IDPS / NSM Suricata engine
  License: CC-BY-SA-4.0
Name: ptrules/open
  Vendor: Positive Technologies
  Summary: Positive Technologies Open Ruleset
  License: Custom
Name: scwx/enhanced
  Vendor: Secureworks
  Summary: Secureworks suricata-enhanced ruleset
  License: Commercial
  Parameters: secret-code
  Subscription: https://www.secureworks.com/contact/ (Please reference CTU Countermeasures)
Name: scwx/malware
  Vendor: Secureworks
  Summary: Secureworks suricata-malware ruleset
  License: Commercial
  Parameters: secret-code
  Subscription: https://www.secureworks.com/contact/ (Please reference CTU Countermeasures)
Name: scwx/security
  Vendor: Secureworks
  Summary: Secureworks suricata-security ruleset
  License: Commercial
  Parameters: secret-code
  Subscription: https://www.secureworks.com/contact/ (Please reference CTU Countermeasures)
Name: stamus/lateral
  Vendor: Stamus Networks
  Summary: Lateral movement rules
  License: GPL-3.0-only
Name: stamus/nrd-14-open
  Vendor: Stamus Networks
  Summary: Newly Registered Domains Open only - 14 day list, complete
  License: Commercial
  Parameters: secret-code
  Subscription: https://www.stamus-networks.com/stamus-labs/subscribe-to-threat-intel-feed
Name: stamus/nrd-30-open
  Vendor: Stamus Networks
  Summary: Newly Registered Domains Open only - 30 day list, complete
  License: Commercial
  Parameters: secret-code
  Subscription: https://www.stamus-networks.com/stamus-labs/subscribe-to-threat-intel-feed
Name: stamus/nrd-entropy-14-open
  Vendor: Stamus Networks
  Summary: Newly Registered Domains Open only - 14 day list, high entropy
  License: Commercial
  Parameters: secret-code
  Subscription: https://www.stamus-networks.com/stamus-labs/subscribe-to-threat-intel-feed
Name: stamus/nrd-entropy-30-open
  Vendor: Stamus Networks
  Summary: Newly Registered Domains Open only - 30 day list, high entropy
  License: Commercial
  Parameters: secret-code
  Subscription: https://www.stamus-networks.com/stamus-labs/subscribe-to-threat-intel-feed
Name: stamus/nrd-phishing-14-open
  Vendor: Stamus Networks
  Summary: Newly Registered Domains Open only - 14 day list, phishing
  License: Commercial
  Parameters: secret-code
  Subscription: https://www.stamus-networks.com/stamus-labs/subscribe-to-threat-intel-feed
Name: stamus/nrd-phishing-30-open
  Vendor: Stamus Networks
  Summary: Newly Registered Domains Open only - 30 day list, phishing
  License: Commercial
  Parameters: secret-code
  Subscription: https://www.stamus-networks.com/stamus-labs/subscribe-to-threat-intel-feed
Name: tgreen/hunting
  Vendor: tgreen
  Summary: Threat hunting rules
  License: GPLv3
If you include the tgreen/hunting ruleset as an example
# suricata-update enable-source tgreen/hunting

21/5/2026 -- 11:09:29 - <Info> -- Using data-directory /var/lib/suricata.
21/5/2026 -- 11:09:29 - <Info> -- Using Suricata configuration /etc/suricata/suricata.yaml
21/5/2026 -- 11:09:29 - <Info> -- Using /etc/suricata/rules for Suricata provided rules.
21/5/2026 -- 11:09:30 - <Info> -- Found Suricata version 7.0.10 at /usr/bin/suricata.
21/5/2026 -- 11:09:30 - <Warning> -- Source index does not exist, will use bundled one.
21/5/2026 -- 11:09:30 - <Warning> -- Please run suricata-update update-sources.
21/5/2026 -- 11:09:30 - <Info> -- Creating directory /var/lib/suricata/update/sources
21/5/2026 -- 11:09:30 - <Info> -- Enabling default source et/open
21/5/2026 -- 11:09:30 - <Info> -- Source tgreen/hunting enabled
Perform update
# suricata-update -o /var/lib/suricata/rules
3.Suricata Configuration Testing
①Testing the configuration file
# suricata -T -c /etc/suricata/suricata.yaml -v

Notice: suricata: This is Suricata version 7.0.10 RELEASE running in SYSTEM mode
Info: cpu: CPUs/cores online: 2
Info: suricata: Running suricata under test mode
Info: suricata: Setting engine mode to IDS mode by default
Info: exception-policy: master exception-policy set to: auto
Info: logopenfile: fast output device (regular) initialized: fast.log
Info: logopenfile: eve-log output device (regular) initialized: eve.json
Info: logopenfile: stats output device (regular) initialized: stats.log
Info: detect: 1 rule files processed. 50465 rules successfully loaded, 0 rules failed, 0
Info: threshold-config: Threshold config parsed: 0 rule(s) found
Info: detect: 50470 signatures processed. 1287 are IP-only rules, 4606 are inspecting packet payload, 44342 inspect application layer, 109 are decoder event only
Notice: suricata: Configuration provided was successfully loaded. Exiting.
Suricata service restart
# systemctl start suricata
Check Status
# systemctl status suricata

● suricata.service - Suricata IDS/IDP daemon
     Loaded: loaded (/usr/lib/systemd/system/suricata.service; enabled; preset: enabled)
     Active: active (running) since Thu 2026-05-21 12:28:54 JST; 1min 10s ago
 Invocation: d7097ad741fd4717acd8f8e4787f3e4d
       Docs: man:suricata(8)
             man:suricatasc(8)
             https://suricata.io/documentation/
    Process: 39425 ExecStart=/usr/bin/suricata -D --af-packet -c /etc/suricata/suricata.yaml --pidfile /run/suricata.pid (code=exited, status=0/SUCCESS)
   Main PID: 39426 (Suricata-Main)
      Tasks: 8 (limit: 4593)
     Memory: 499.2M (peak: 502.8M)
        CPU: 31.363s
     CGroup: /system.slice/suricata.service
             └─39426 /usr/bin/suricata -D --af-packet -c /etc/suricata/suricata.yaml --pidfile /run/suricata.pid

May 21 12:28:54 Lepard systemd[1]: Starting suricata.service - Suricata IDS/IDP daemon...
May 21 12:28:54 Lepard suricata[39425]: i: suricata: This is Suricata version 7.0.10 RELEASE running in SYSTEM mode
May 21 12:28:54 Lepard systemd[1]: Started suricata.service - Suricata IDS/IDP daemon.
Check log files
# tail -f /var/log/suricata/suricata.log

[39426 - Suricata-Main] 2026-05-21 12:28:54 Info: logopenfile: fast output device (regular) initialized: fast.log
[39426 - Suricata-Main] 2026-05-21 12:28:54 Info: logopenfile: eve-log output device (regular) initialized: eve.json
[39426 - Suricata-Main] 2026-05-21 12:28:54 Info: logopenfile: stats output device (regular) initialized: stats.log
[39426 - Suricata-Main] 2026-05-21 12:29:11 Info: detect: 1 rule files processed. 50465 rules successfully loaded, 0 rules failed, 0
[39426 - Suricata-Main] 2026-05-21 12:29:11 Info: threshold-config: Threshold config parsed: 0 rule(s) found
[39426 - Suricata-Main] 2026-05-21 12:29:11 Info: detect: 50470 signatures processed. 1287 are IP-only rules, 4606 are inspecting packet payload, 44342 inspect application layer, 109 are decoder event only
[39426 - Suricata-Main] 2026-05-21 12:29:24 Warning: af-packet: ens33: AF_PACKET tpacket-v3 is recommended for non-inline operation
[39426 - Suricata-Main] 2026-05-21 12:29:24 Info: runmodes: ens33: creating 2 threads
[39426 - Suricata-Main] 2026-05-21 12:29:24 Info: unix-manager: unix socket '/var/run/suricata-command.socket'
[39426 - Suricata-Main] 2026-05-21 12:29:24 Notice: threads: Threads created -> W: 2 FM: 1 FR: 1   Engine started.
4.Testing the Suricata Rule
①Use the following command to test using ET Open Signature ID 2100498
# curl http://testmynids.org/uid/index.html
uid=0(root) gid=0(root) groups=0(root)
②Check the log file using the specified rule number.
Suricata comes with the following two log files enabled by default.
/var/log/suricata/fast.log
/var/log/suricata/eve.log
To check the log entries corresponding to the curl request, use the grep command to examine the /var/log/suricata/fast.log log file.
2100498 Searches for log entries using the rule identifier. (For IPv4)
# grep 2100498 /var/log/suricata/fast.log
05/21/2026-12:31:34.700348  [**] [1:2100498:7] GPL ATTACK_RESPONSE id check returned root [**] [Classification: Potentially Bad Traffic] [Priority: 2] {TCP} 13.227.50.46:80 -> 192.168.11.83:46960
③Check events in /var/log/suricata/eve.log
Install jq
# apt -y install jq
Filter EVE Log events by searching for 2100498 signatures
Display alert objects with signature_id keys that match the values in 2100498
# jq 'select(.alert .signature_id==2100498)' /var/log/suricata/eve.json

{
  "timestamp": "2026-05-21T12:31:34.700348+0900",
  "flow_id": 1780181192263334,
  "in_iface": "ens33",
  "event_type": "alert",
  "src_ip": "13.227.50.46",
  "src_port": 80,
  "dest_ip": "192.168.11.83",
  "dest_port": 46960,
  "proto": "TCP",
  "pkt_src": "wire/pcap",
  "community_id": "1:L3saF9i5SQYK+zoxXK73kwojWVE=",
  "tx_id": 0,
  "tx_guessed": true,
  "alert": {
    "action": "allowed",
    "gid": 1,
    "signature_id": 2100498,
    "rev": 7,
    "signature": "GPL ATTACK_RESPONSE id check returned root",
    "category": "Potentially Bad Traffic",
    "severity": 2,
    "metadata": {
      "confidence": [
        "Medium"
      ],
      "created_at": [
        "2010_09_23"
      ],
      "signature_severity": [
        "Informational"
      ],
      "updated_at": [
        "2019_07_26"
      ]
    }
  },
  "http": {
    "hostname": "testmynids.org",
    "url": "/uid/index.html",
    "http_user_agent": "curl/8.14.1",
    "http_content_type": "text/html",
    "http_method": "GET",
    "protocol": "HTTP/1.1",
    "status": 200,
    "length": 39
  },
  "files": [
    {
      "filename": "/uid/index.html",
      "gaps": false,
      "state": "CLOSED",
      "stored": false,
      "size": 39,
      "tx_id": 0
    }
  ],
  "app_proto": "http",
  "direction": "to_client",
  "flow": {
    "pkts_toserver": 5,
    "pkts_toclient": 4,
    "bytes_toserver": 430,
    "bytes_toclient": 810,
    "start": "2026-05-21T12:31:34.676624+0900",
    "src_ip": "192.168.11.83",
    "dest_ip": "13.227.50.46",
    "src_port": 46960,
    "dest_port": 80
  }
}
5.Reset SURICATA and restart it in IPS mode.
SURICATA operates in IDS mode by default and does not actively block network traffic. To switch to IPS mode, you must modify SURICATA's default settings.
5.1 Enabling nfqueue mode
# vi /usr/lib/systemd/system/suricata.service
The following changes will be made
[Service]
#ExecStart=/usr/bin/suricata -D --af-packet -c /etc/suricata/suricata.yaml - -pidfile /run/suricata.pid
ExecStart=/usr/bin/suricata -D -q 0 -c /etc/suricata/suricata.yaml --pidfile /run/suricata.pid
Reload the configuration and restart Suricata.
# systemctl daemon-reload
# systemctl restart suricata.service
5.2 Configuring UFW to Send Traffic to Suricata
# vi /etc/ufw/before.rules

Add to line 18
# Don't delete these required lines, otherwise there will be errors
*filter
:ufw-before-input - [0:0]
:ufw-before-output - [0:0]
:ufw-before-forward - [0:0]
:ufw-not-local - [0:0]
# End required lines

## Start Suricata NFQUEUE rules
-I INPUT 1 -p tcp --dport 2244 -j NFQUEUE --queue-bypass
-I OUTPUT 1 -p tcp --sport 2244 -j NFQUEUE --queue-bypass
-I FORWARD -j NFQUEUE
-I INPUT 2 -j NFQUEUE
-I OUTPUT 2 -j NFQUEUE
## End Suricata NFQUEUE rules
# systemctl restart ufw.service
5.3 Create local rules and define them in the Suricata configuration file
First, to avoid conflicts, disable packets that match the signature sid:2100498 defined in suricata.rules.
Find the line matching sid:2100498 and comment it out.
# vi /var/lib/suricata/rules/suricata.rules

#alert ip any any -> any any (msg:"GPL ATTACK_RESPONSE id check returned root"; content:"uid=0|28|root|29|"; classtype:bad-unknown; sid:2100498; rev:7; metadata:created_at 2010_09_23, confidence Medium, signature_severity Informational, updated_at 2019_07_26;)
Create a new local rule(Set the action to "drop"
# vi /var/lib/suricata/rules/local.rules
drop ip any any -> any any (msg:"GPL ATTACK_RESPONSE id check returned root"; content:"uid=0|28|root|29|"; classtype:bad-unknown; sid:2100498; rev:7; metadata:created_at 2010_09_23, confidence Medium, signature_severity Informational, updated_at 2019_07_26;)
Define in the Suricata configuration file
# vi /etc/suricata/suricata.yaml

Add around line 2201
rule-files:
     - suricata.rules
     - local.rules
# systemctl restart suricata
5.4 Test this rule using curl
# curl --max-time 5 http://testmynids.org/uid/index.html
curl: (28) Operation timed out after 5000 milliseconds with 0 out of 39 bytes received
Using jq to check eve.log for "action": "blocked"
# jq 'select(.alert .signature_id==2100498)' /var/log/suricata/eve.json

{
  "timestamp": "2026-05-21T12:53:54.897032+0900",
  "flow_id": 663288747226485,
  "event_type": "alert",
  "src_ip": "13.227.50.36",
  "src_port": 80,
  "dest_ip": "192.168.11.83",
  "dest_port": 37202,
  "proto": "TCP",
  "pkt_src": "wire/pcap",
  "community_id": "1:YLuF3vx/5CMPhKHC3pRstRKAC68=",
  "tx_id": 0,
  "tx_guessed": true,
  "alert": {
    "action": "blocked",
    "gid": 1,
    "signature_id": 2100498,
    "rev": 7,
    "signature": "GPL ATTACK_RESPONSE id check returned root",
    "category": "Potentially Bad Traffic",
    "severity": 2,
    "metadata": {
      "confidence": [
        "Medium"
      ],
      "created_at": [
        "2010_09_23"
      ],
      "signature_severity": [
        "Informational"
      ],
      "updated_at": [
        "2019_07_26"
      ]
    }
  },
  "http": {
    "hostname": "testmynids.org",
    "url": "/uid/index.html",
    "http_user_agent": "curl/8.14.1",
    "http_content_type": "text/html",
    "http_method": "GET",
    "protocol": "HTTP/1.1",
    "status": 200,
    "length": 39
  },
  "files": [
    {
      "filename": "/uid/index.html",
      "gaps": false,
      "state": "CLOSED",
      "stored": false,
      "size": 39,
      "tx_id": 0
    }
  ],
  "app_proto": "http",
  "direction": "to_client",
  "flow": {
    "pkts_toserver": 3,
    "pkts_toclient": 4,
    "bytes_toserver": 256,
    "bytes_toclient": 754,
    "start": "2026-05-21T12:53:54.875329+0900",
    "src_ip": "192.168.11.83",
    "dest_ip": "13.227.50.36",
    "src_port": 37202,
    "dest_port": 80
  }
}
Elastic stack 9.x installation
Install & configure Elastic Stack to visualize & search SURICATA logs
This section is basically done on a second Debian13.1 server
①Install Elastic stack 9.x repository signing key
# apt update
# apt -y install gnupg2
# wget -qO - https://artifacts.elastic.co/GPG-KEY-elasticsearch | \
gpg --dearmor -o /etc/apt/trusted.gpg.d/elastic.gpg
➁Install Elastic Stack 9.x repository
# echo "deb https://artifacts.elastic.co/packages/9.x/apt stable main" > /etc/apt/sources.list.d/elastic-9.x.list
update
# apt update
➂Installing Elasticsearch 9.x
# apt install elasticsearch -y
During installation, security features are enabled by default;
--------------------------- Security autoconfiguration information ------------------------------

Authentication and authorization are enabled.
TLS for the transport and HTTP layers is enabled and configured.

The generated password for the elastic built-in superuser is : CBi8fqc-xxEcryc2Gf4_

If this node should join an existing cluster, you can reconfigure this with
'/usr/share/elasticsearch/bin/elasticsearch-reconfigure-node --enrollment-token <token-here>'
after creating an enrollment token on your existing cluster.

You can complete the following actions at any time:

Reset the password of the elastic built-in superuser with
'/usr/share/elasticsearch/bin/elasticsearch-reset-password -u elastic'.

Generate an enrollment token for Kibana instances with
 '/usr/share/elasticsearch/bin/elasticsearch-create-enrollment-token -s kibana'.

Generate an enrollment token for Elasticsearch nodes with
'/usr/share/elasticsearch/bin/elasticsearch-create-enrollment-token -s node'.

-------------------------------------------------------------------------------------------------
Certifications and authorizations are in effect.
TLS at the transport and HTTP layers is enabled and configured.
An Elastic super user account (elastic) and its password will be created.
④Configuring Elasticsearch 9.x
Since this is a basic single-node cluster, we will use the default settings.
Check the Elasticsearch configuration file /etc/elasticsearch/elasticsearch.yml and you will see that the security settings are enabled
# cat /etc/elasticsearch/elasticsearch.yml

#----------------------- BEGIN SECURITY AUTO CONFIGURATION -----------------------
#
# The following settings, TLS certificates, and keys have been automatically
# generated to configure Elasticsearch security features on 21-05-2026 04:38:54
#
# --------------------------------------------------------------------------------

# Enable security features
xpack.security.enabled: true

xpack.security.enrollment.enabled: true

# Enable encryption for HTTP API client connections, such as Kibana, Logstash, and Agents
xpack.security.http.ssl:
  enabled: true
  keystore.path: certs/http.p12

# Enable encryption and mutual authentication between cluster nodes
xpack.security.transport.ssl:
  enabled: true
  verification_mode: certificate
  keystore.path: certs/transport.p12
  truststore.path: certs/transport.p12
# Create a new cluster with the current node only
# Additional nodes can still join the cluster later
cluster.initial_master_nodes: ["Lion"]

# Allow HTTP API connections from anywhere
# Connections are encrypted and require user authentication
http.host: 0.0.0.0

# Allow other nodes to join the cluster from anywhere
# Connections are encrypted and mutually authenticated
#transport.host: 0.0.0.0

#----------------------- END SECURITY AUTO CONFIGURATION -------------------------
⑤Start Elasticsearch
Start Elasticsearch and allow it to run at system startup
# systemctl daemon-reload
# systemctl enable --now elasticsearch
# systemctl start elasticsearch
Check Status
# systemctl status elasticsearch

● elasticsearch.service - Elasticsearch
     Loaded: loaded (/usr/lib/systemd/system/elasticsearch.service; enabled; preset: enabled)
     Active: active (running) since Thu 2026-05-21 13:43:43 JST; 29s ago
 Invocation: 0b1b5e065baa4c17a5607b7554fdabbf
       Docs: https://www.elastic.co
   Main PID: 2215 (server-launcher)
      Tasks: 102 (limit: 4553)
     Memory: 2.3G (peak: 2.3G)
        CPU: 1min 3.962s
     CGroup: /system.slice/elasticsearch.service
             tq2215 /usr/share/elasticsearch/lib/tools/server-launcher/server-launcher -p /var/run/elasticsearch/elasticsear>
             tq2266 /usr/share/elasticsearch/jdk/bin/java -Des.networkaddress.cache.ttl=60 -Des.networkaddress.cache.negativ>
             mq2288 /usr/share/elasticsearch/modules/x-pack-ml/platform/linux-x86_64/bin/controller

May 21 13:42:34 Lion systemd[1]: Starting elasticsearch.service - Elasticsearch...
May 21 13:43:34 Lion systemd-entrypoint[2215]: WARNING: A terminally deprecated method in sun.misc.Unsafe has been called
May 21 13:43:34 Lion systemd-entrypoint[2215]: WARNING: sun.misc.Unsafe::arrayBaseOffset has been called by com.google.proto>
May 21 13:43:34 Lion systemd-entrypoint[2215]: WARNING: Please consider reporting this to the maintainers of class com.googl>
May 21 13:43:34 Lion systemd-entrypoint[2215]: WARNING: sun.misc.Unsafe::arrayBaseOffset will be removed in a future release
May 21 13:43:43 Lion systemd[1]: Started elasticsearch.service - Elasticsearch.
You can also check the status of the ES using the curl command; replace IP as appropriate
# curl https://192.168.11.85:9200 --cacert /etc/elasticsearch/certs/http_ca.crt -u elastic
When prompted, enter the Elasticsearch password generated during the Elasticsearch installation
The output will look like this
Enter host password for user 'elastic':  ←Password
{
  "name" : "Lion",
  "cluster_name" : "elasticsearch",
  "cluster_uuid" : "Ta2Kt1tZRJG92f2lQb-1sA",
  "version" : {
    "number" : "9.4.1",
    "build_flavor" : "default",
    "build_type" : "deb",
    "build_hash" : "3c7c6027c5769d860d87448e2749f4c550a239da",
    "build_date" : "2026-05-08T10:08:29.383338563Z",
    "build_snapshot" : false,
    "lucene_version" : "10.4.0",
    "minimum_wire_compatibility_version" : "8.19.0",
    "minimum_index_compatibility_version" : "8.0.0"
  },
  "tagline" : "You Know, for Search"
}
Also, make sure that both the HTTP and transport ports are open;
# ss -altnp | grep -E "9200|9300"

LISTEN 0      4096                    *:9200             *:*    users:(("java",pid=2266,fd=840))
LISTEN 0      4096   [::ffff:127.0.0.1]:9300             *:*    users:(("java",pid=2266,fd=838))
LISTEN 0      4096                [::1]:9300          [::]:*    users:(("java",pid=2266,fd=837))
⑥Reset Elasticsearch Password
The auto-generated Elastic user password is too complex, reset it using the command /usr/share/elasticsearch/bin/elasticsearch-reset-password
To reset the password, run the command
# /usr/share/elasticsearch/bin/elasticsearch-reset-password -u elastic -i

This tool will reset the password of the [elastic] user.
You will be prompted to enter the password.
Please confirm that you would like to continue [y/N]y


Enter password for [elastic]:
Re-enter password for [elastic]:
Password for the [elastic] user successfully reset.
⑦Elasticsearch Logs
Elasticsearch writes logs to the /var/log/elasticsearch path; the log you need to check if there is a problem with your Elasticsearch instance is /var/log/elasticsearch/CLUSTER_NAME.log The logs you need to check if there is a problem with your Elasticsearch instance are
CLUSTER_NAME is the value of the cluster.name option in the elasticsearch.yaml file. If this value is not changed, the default is elasticsearch and the log file is /var/log/elasticsearch/elasticsearch.log.
# tail -f /var/log/elasticsearch/elasticsearch.log

[2026-05-21T13:43:48,316][INFO ][o.e.x.i.IndexLifecycleTransition] [Lion] moving index [.ds-.logs-elasticsearch.deprecation-default-2026.05.21-000001] from [{"phase":"hot","action":"unfollow","name":"branch-check-unfollow-prerequisites"}] to [{"phase":"hot","action":"rollover","name":"check-rollover-ready"}] in policy [.deprecation-indexing-ilm-policy]
[2026-05-21T13:43:48,361][INFO ][o.e.c.m.MetadataMappingService] [Lion] [.ds-.logs-elasticsearch.deprecation-default-2026.05.21-000001/7zZvo2g-S-mh4Ve9uRzR8A] update_mapping [_doc]
[2026-05-21T13:43:53,267][INFO ][o.e.c.m.MetadataCreateIndexService] [Lion] creating index [.ds-ilm-history-7-2026.05.21-000001] in project [default], cause [initialize_data_stream], templates [provided in request], shards [1]/[1]
[2026-05-21T13:43:53,268][INFO ][o.e.c.m.MetadataCreateDataStreamService] [Lion] adding data stream [ilm-history-7] with write index [.ds-ilm-history-7-2026.05.21-000001], backing indices [], and aliases []
[2026-05-21T13:43:53,268][INFO ][o.e.c.r.a.AllocationService] [Lion] in project [default] updating number_of_replicas to [0] for indices [.ds-ilm-history-7-2026.05.21-000001]
[2026-05-21T13:43:53,542][INFO ][o.e.c.r.a.AllocationService] [Lion] current.health="GREEN" message="Cluster health status changed from [YELLOW] to [GREEN] (reason: [shards started [[.ds-ilm-history-7-2026.05.21-000001][0]]])." previous.health="YELLOW" reason="shards started [[.ds-ilm-history-7-2026.05.21-000001][0]]"
[2026-05-21T13:48:58,638][INFO ][o.e.x.s.a.f.FileUserPasswdStore] [Lion] users file [/etc/elasticsearch/users] changed. updating users...
[2026-05-21T13:48:58,645][INFO ][o.e.x.s.a.f.FileUserRolesStore] [Lion] users roles file [/etc/elasticsearch/users_roles] changed. updating users roles...
[2026-05-21T13:49:13,660][INFO ][o.e.x.s.a.f.FileUserPasswdStore] [Lion] users file [/etc/elasticsearch/users] changed. updating users...
[2026-05-21T13:49:13,661][INFO ][o.e.x.s.a.f.FileUserRolesStore] [Lion] users roles file [/etc/elasticsearch/users_roles] changed. updating users roles...
Kibana 9.x installation
We will also perform this section on the second Debian 13.1 server.
①Install
# apt -y install kibana

The following package was automatically installed and is no longer required:
  linux-image-6.12.43+deb13-amd64
Use 'apt autoremove' to remove it.

Installing:
  kibana

Summary:
  Upgrading: 0, Installing: 1, Removing: 0, Not Upgrading: 90
  Download size: 452 MB
  Space needed: 1,428 MB / 14.4 GB available

Get:1 https://artifacts.elastic.co/packages/9.x/apt stable/main amd64 kibana amd64 9.4.1 [452 MB]
Fetched 452 MB in 11s (39.7 MB/s)
Selecting previously unselected package kibana.
(Reading database ... 47717 files and directories currently installed.)
Preparing to unpack .../kibana_9.4.1_amd64.deb ...
Unpacking kibana (9.4.1) ...
Setting up kibana (9.4.1) ...
Creating kibana group... OK
Creating kibana user... OK
Created Kibana keystore in /etc/kibana/kibana.keystore
➁Configure Kibana 9
Kibana is configured by default to run on localhost:5601. To allow external access, edit the configuration file and replace the server.host value with the interface IP.
# vi /etc/kibana/kibana.yml

Line 6: Uncomment
server.port: 5601
Add around line 12
# To allow connections from remote users, set this parameter to a non-loopback address.
#server.host: "localhost"
server.host: "192.168.11.85"
➂Generate Kibana-Elasticsearch Enrollment Token
To configure your Kibana instance to communicate with an existing Elasticsearch cluster with security features enabled, you need an Enrollment Token.
# /usr/share/elasticsearch/bin/elasticsearch-create-enrollment-token -s kibana

eyJ2ZXIiOiI4LjE0LjAiLCJhZHIiOlsiMTkyLjE2OC4xMS44NTo5MjAwIl0sImZnciI6IjYxNjc1ZTk4Nzg5ZWRmZDE4NTA1YjA4NWY4OWQzZmIwM2IzNjNlNzUzNmY5MWRjZWQwM2M5NzBiNjgzMDQzMGQiLCJrZXkiOiJodGJrU0o0QnM3TlFFVVBrZnRBdDpNcll4Szg1VmE4NlROTjFrUlM2QW5nIn0=
Generate Kibana encryption keys
Kibana uses encryption keys in several areas, from encrypting data for Kibana-related indexes to storing session information. The required keys are as follows
xpack.encryptedSavedObjects.encryptionKey:Used to encrypt stored objects such as dashboards and visualizationsxpack.reporting.encryptionKey: Used to encrypt saved reportsxpack.security.encryptionKey: Used to encrypt session information
These can be generated using the command below
# /usr/share/kibana/bin/kibana-encryption-keys generate

Settings:
xpack.encryptedSavedObjects.encryptionKey: 579c1312de03e39a4f274423b5b6945ddf2ef101f7d44d4be055afb85ecd298b
xpack.reporting.encryptionKey: 90a744f9ebf23d32e893c93e329b8ab79515fbfd493fed8f48091ec17e88f74f
xpack.security.encryptionKey: 8f12e448c0685b666fed7bdbc7b6852256bd0beb02f44b888267938e9f0a0eaf
Insert these lines into Kibana config file, kibana.yml
# echo -e "xpack.encryptedSavedObjects.encryptionKey: 579c1312de03e39a4f274423b5b6945ddf2ef101f7d44d4be055afb85ecd298b
xpack.reporting.encryptionKey: 90a744f9ebf23d32e893c93e329b8ab79515fbfd493fed8f48091ec17e88f74f
xpack.security.encryptionKey: 8f12e448c0685b666fed7bdbc7b6852256bd0beb02f44b888267938e9f0a0eaf" >> /etc/kibana/kibana.yml
⑤Running Kibana
Start Kibana 9 and allow it to run at system startup.
# systemctl enable --now kibana
# systemctl start kibana
Check Status
# systemctl status kibana

● kibana.service - Kibana
     Loaded: loaded (/usr/lib/systemd/system/kibana.service; enabled; preset: enabled)
     Active: active (running) since Thu 2026-05-21 14:00:14 JST; 1min 46s ago
 Invocation: f4aae1a5d5e24151a1a7d503e40224dd
       Docs: https://www.elastic.co
   Main PID: 2667 (MainThread)
      Tasks: 11 (limit: 4553)
     Memory: 703.6M (peak: 704.9M)
        CPU: 17.067s
     CGroup: /system.slice/kibana.service
             mq2667 /usr/share/kibana/bin/../node/default/bin/node /usr/share/kibana/bin/../src/cli/kibana/dist

May 21 14:00:20 Lion kibana[2667]: Native global console methods have been overridden in production environment.
May 21 14:00:30 Lion kibana[2667]: [2026-05-21T14:00:30.769+09:00][INFO ][root] Kibana is starting
May 21 14:00:31 Lion kibana[2667]: [2026-05-21T14:00:31.027+09:00][INFO ][node] Kibana process configured with roles: [backg>
May 21 14:01:40 Lion kibana[2667]: [2026-05-21T14:01:40.535+09:00][INFO ][plugins-service] The following plugins are disable>
May 21 14:01:40 Lion kibana[2667]: [2026-05-21T14:01:40.639+09:00][INFO ][http.server.Preboot] http server running at http:/>
May 21 14:01:41 Lion kibana[2667]: [2026-05-21T14:01:41.035+09:00][INFO ][plugins-system.preboot] Setting up [1] plugins: [i>
May 21 14:01:41 Lion kibana[2667]: [2026-05-21T14:01:41.098+09:00][INFO ][preboot] "interactiveSetup" plugin is holding setu>
May 21 14:01:41 Lion kibana[2667]: [2026-05-21T14:01:41.130+09:00][INFO ][root] Holding setup until preboot stage is complet>
May 21 14:01:49 Lion kibana[2667]: i Kibana has not been configured.
May 21 14:01:49 Lion kibana[2667]: Go to http://192.168.11.85:5601/?code=879206 to get started.
The following appears at the end of the output
Go to http://192.168.11.85:5601/?code=879206 to get started.
Copy the provided Kibana URL (including code) and use it in your browser to access Kibana and complete the setup.
Similarly, Kibana logs are available in /var/log/kibana/kibana.log and /var/log/syslog.
⑥Accessing the Kibana9 Dashboard
You can now access http://192.168.11.85:5601/?code=879206
(copy the appropriate address for each person)
If UFW is running, open Kibana port
# ufw allow 5601/tcp
Rule added
# ufw reload
Firewall reloaded
When you access Kibana 9, the welcome page asks you to configure Elastic.
First, enter the generated registration token.
Copy the Kibana token generated using the command /usr/share/elasticsearch/bin/elasticsearch-create-enrollment-token -s kibana, and paste it into the box
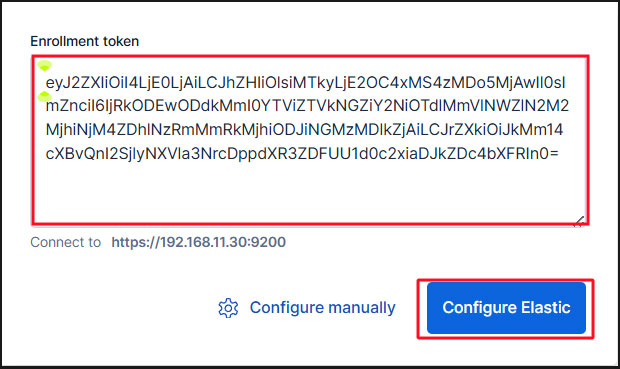
Paste the token and Kibana will automatically connect to Elasticsearch.
Click Configure Elastic. Your settings will be saved and Elasticsearch will be configured and restarted.
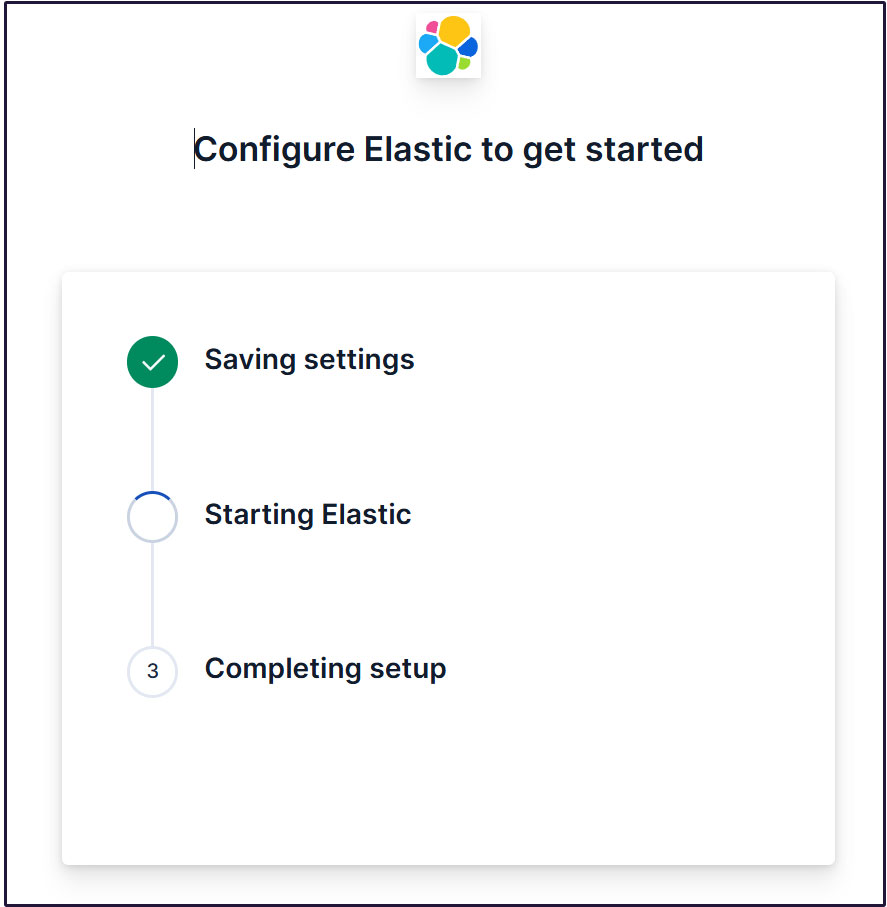
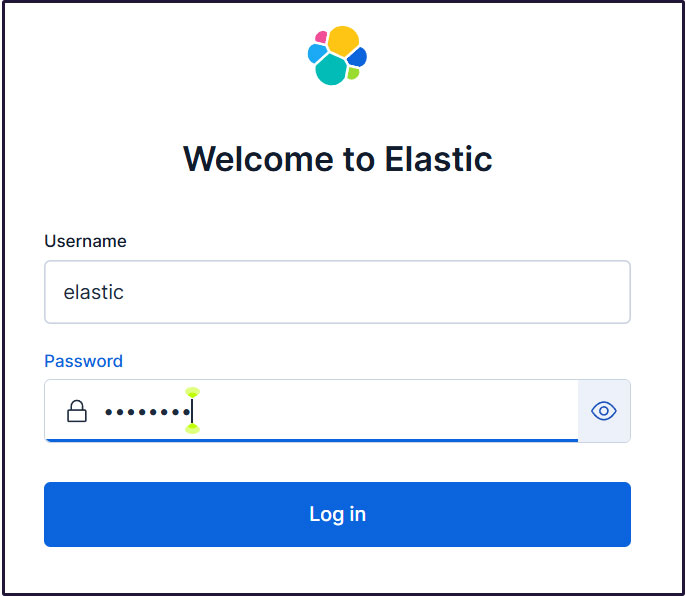
Go to the login page. Log in using the generated Elastic user credentials.
Username : elastic
Password : Easy-to-understand regenerated passwords
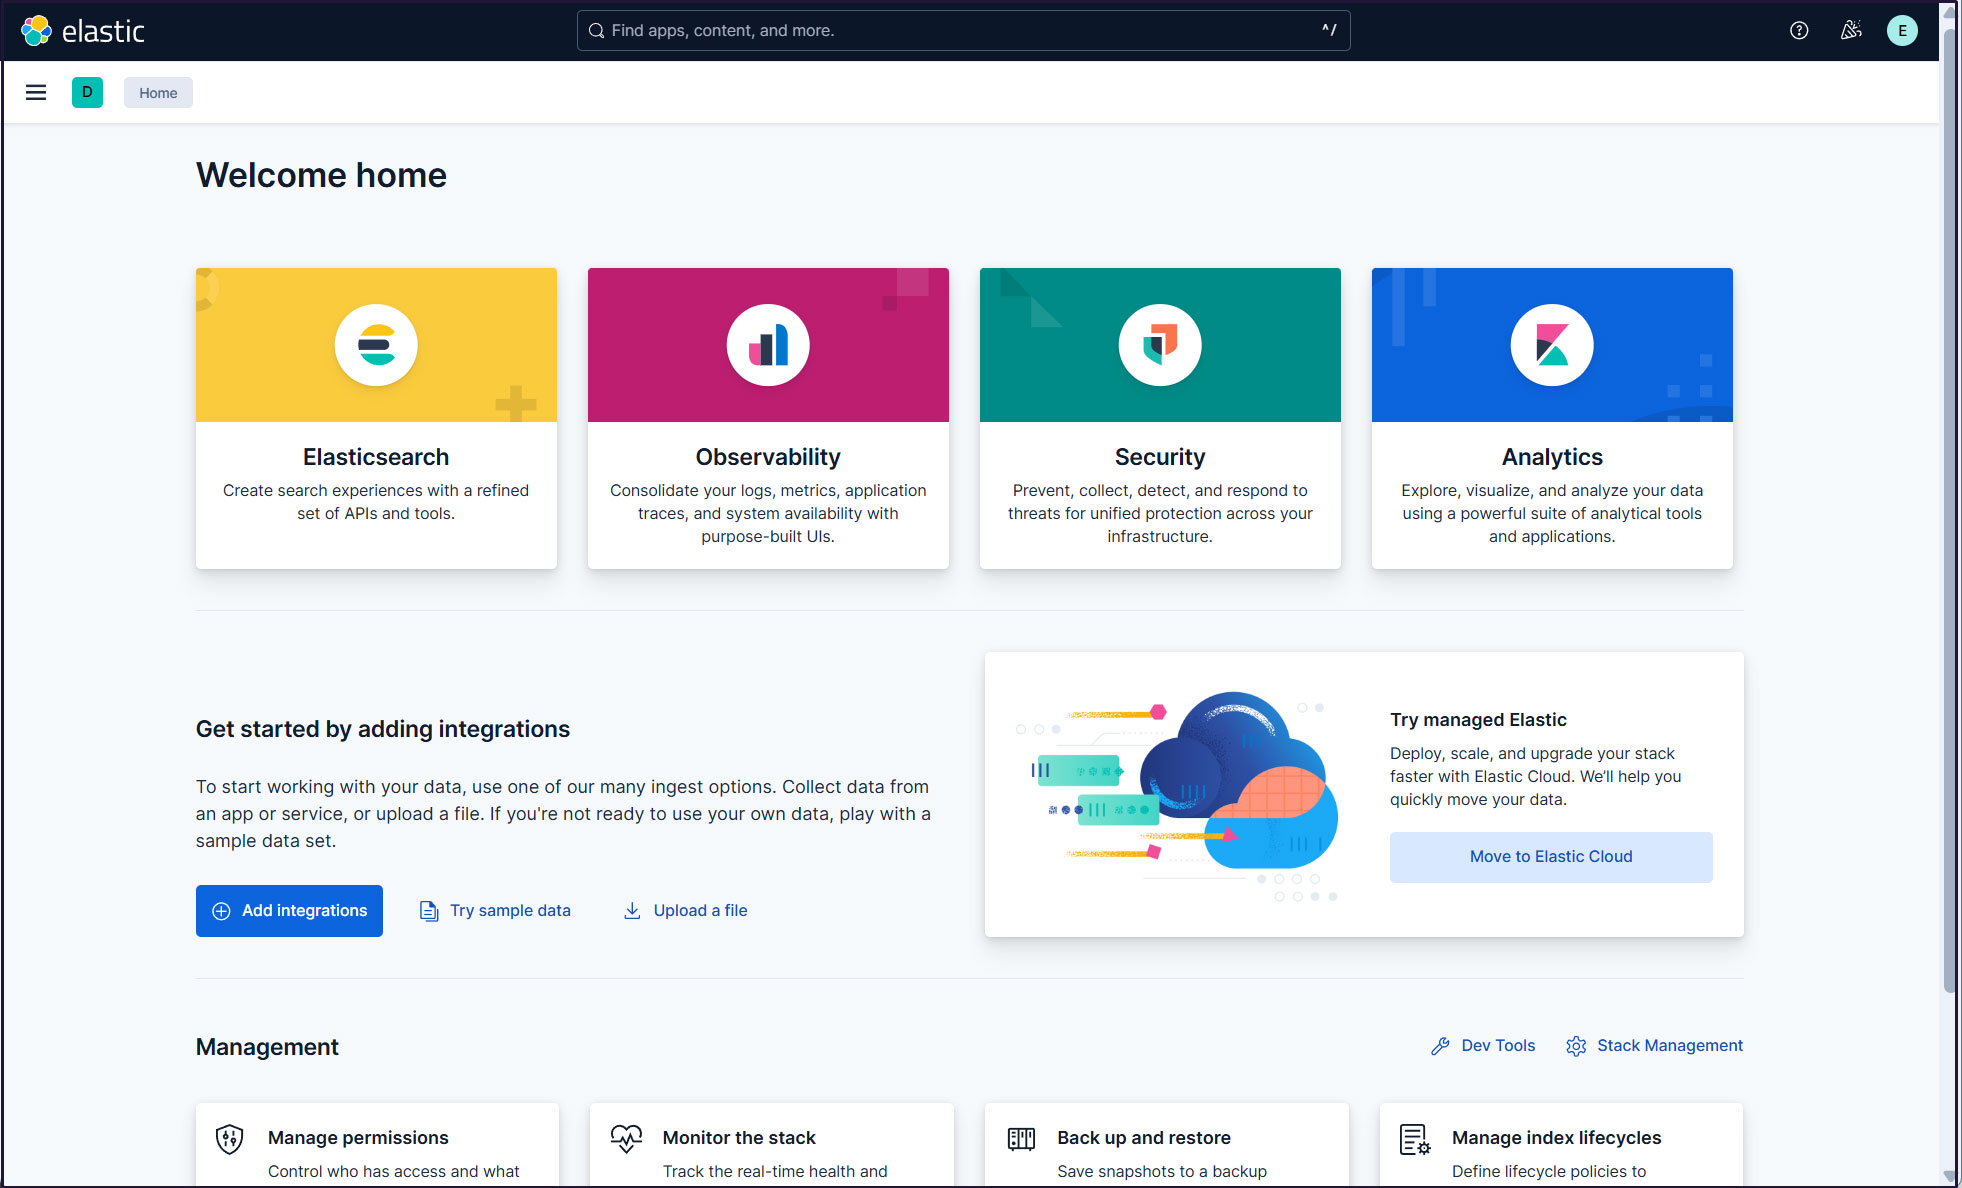
On the welcome page, click "Explore on my own" to proceed to the Kibana 9.x dashboard.。

Installing Filebeat 9
To collect logs and monitor the first-generation server running Debian 13.5, you need to install Filebeat.
This procedure will be performed on the first server, running Debian 13.5 with the IP address 192.168.11.83.
①Install Elastic Repos
To install Filebeat 9, install the Elastic 9.x repository
# wget -qO - https://artifacts.elastic.co/GPG-KEY-elasticsearch | \
gpg --dearmor > /etc/apt/trusted.gpg.d/elk.gpg

# echo "deb https://artifacts.elastic.co/packages/9.x/apt stable main" \
> /etc/apt/sources.list.d/elastic-9.list
update
# apt update
Install Filebeat 9
# apt -y install filebeat
➁Configuring Filebeat Logging
The default filebeat configuration file is /etc/filebeat/filebeat.yml
To make Filebeat write logs to its own log file, enter the following settings in the configuration file
# cat >> /etc/filebeat/filebeat.yml << 'EOL'
logging.level: info
logging.to_files: true
logging.files:
  path: /var/log/filebeat
  name: filebeat
  keepfiles: 7
  permissions: 0640
EOL
➂Connecting Filebeat to the data processing system
Configure Filebeat to connect to a data processing system. In this case, it is Elasticsearch.
To send logs directly to Elasticsearch, edit the Filebeat configuration file and update the Output Settings section.
Connecting to Elasticsearch 9 requires SSL and authentication.
Verify that you can connect to Elasticsearch on port 9200/tcp (make sure to open port 9200 on the second server beforehand)
# telnet 192.168.11.85 9200

Trying 192.168.11.85...
Connected to 192.168.11.85.
Escape character is '^]'.
④Elasticsearch CA certificate creation
Download the Elasticsearch CA certificate and save it in a directory of your choice (this time as /etc/filebeat/elastic-ca.crt)
# openssl s_client -connect 192.168.11.85:9200 \
-showcerts </dev/null 2>/dev/null | \
openssl x509 -outform PEM > /etc/filebeat/elastic-ca.crt
Get the credentials that Filebeat uses to authenticate to Elasticsearch. In this case, we will use the default superadmin and Elastic user credentials.
# vi /etc/filebeat/filebeat.yml

Around line 138, modify the Kibana section as follows:
#host: "localhost:5601"
host: "192.168.11.85:5601"

Change the Elasticsearch Output section around line 164 as follows:
output.elasticsearch:
  # Array of hosts to connect to.
  #hosts: ["localhost:9200"]
  hosts: ["192.168.11.85:9200"]

Uncomment around line 171 and specify the location of the Elasticsearch CA certificate
  # Protocol - either `http` (default) or `https`.
  protocol: "https"
  ssl.certificate_authorities: ["/etc/filebeat/elastic-ca.crt"]

Uncomment the lines around lines 175 and 176 and enter the password
  # Authentication credentials - either API key or username/password.
  #api_key: "id:api_key"
  username: "elastic"
  password: "Password"   ←The Elastic password created on the second server
⑤Configuration File Test
# filebeat test config
Config OK
⑥Test Filebeat output connections
# filebeat test output

elasticsearch: https://192.168.11.85:9200...
  parse url... OK
  connection...
    parse host... OK
    dns lookup... OK
    addresses: 192.168.11.85
    dial up... OK
  TLS...
    security: server's certificate chain verification is enabled
    handshake... OK
    TLS version: TLSv1.3
    dial up... OK
  talk to server... OK
  version: 9.4.1
⑦Enable the Suricata module for Filebeat
When you enable the Suricata module, /etc/filebeat/modules.d/suricata.yml.disabled becomes /etc/filebeat/modules.d/suricata.yml, but the contents remain unchanged, so modify it as follows:
# filebeat modules enable suricata

# vi /etc/filebeat/modules.d/suricata.yml
Change lines 7–8 as follows
- module: suricata
  # All logs
  eve:
    enabled: true
    var.paths: ["/var/log/suricata/eve.json"]
⑧Set up the initial environment
Load the SIEM dashboard and pipeline into Elasticsearch
filebeat setup command
# filebeat setup -e

{"log.level":"info","@timestamp":"2026-05-21T14:40:42.116+0900","log.logger":"modules","log.origin":{"function":"github.com/elastic/beats/v7/filebeat/fileset.LoadPipeline","file.name":"fileset/pipelines.go","file.line":134},"message":"Elasticsearch pipeline loaded.","service.name":"filebeat","pipeline":"filebeat-9.4.1-suricata-eve-pipeline","ecs.version":"1.6.0"}
{"log.level":"info","@timestamp":"2026-05-21T14:40:42.173+0900","log.logger":"modules","log.origin":{"function":"github.com/elastic/beats/v7/filebeat/fileset.LoadPipeline","file.name":"fileset/pipelines.go","file.line":134},"message":"Elasticsearch pipeline loaded.","service.name":"filebeat","pipeline":"filebeat-9.4.1-suricata-eve-dns","ecs.version":"1.6.0"}
{"log.level":"info","@timestamp":"2026-05-21T14:40:42.222+0900","log.logger":"modules","log.origin":{"function":"github.com/elastic/beats/v7/filebeat/fileset.LoadPipeline","file.name":"fileset/pipelines.go","file.line":134},"message":"Elasticsearch pipeline loaded.","service.name":"filebeat","pipeline":"filebeat-9.4.1-suricata-eve-dns-answer-v1","ecs.version":"1.6.0"}
{"log.level":"info","@timestamp":"2026-05-21T14:40:42.272+0900","log.logger":"modules","log.origin":{"function":"github.com/elastic/beats/v7/filebeat/fileset.LoadPipeline","file.name":"fileset/pipelines.go","file.line":134},"message":"Elasticsearch pipeline loaded.","service.name":"filebeat","pipeline":"filebeat-9.4.1-suricata-eve-dns-answer-v2","ecs.version":"1.6.0"}
{"log.level":"info","@timestamp":"2026-05-21T14:40:42.323+0900","log.logger":"modules","log.origin":{"function":"github.com/elastic/beats/v7/filebeat/fileset.LoadPipeline","file.name":"fileset/pipelines.go","file.line":134},"message":"Elasticsearch pipeline loaded.","service.name":"filebeat","pipeline":"filebeat-9.4.1-suricata-eve-tls","ecs.version":"1.6.0"}
{"log.level":"info","@timestamp":"2026-05-21T14:40:42.373+0900","log.logger":"modules","log.origin":{"function":"github.com/elastic/beats/v7/filebeat/fileset.LoadPipeline","file.name":"fileset/pipelines.go","file.line":134},"message":"Elasticsearch pipeline loaded.","service.name":"filebeat","pipeline":"filebeat-9.4.1-suricata-eve-http","ecs.version":"1.6.0"}
⑨Filebeat service launched
# systemctl start filebeat.service
# systemctl enable filebeat.service
⑩Check with Kibana
Log back into Kibana at accsess http://192.168.11.85:5601
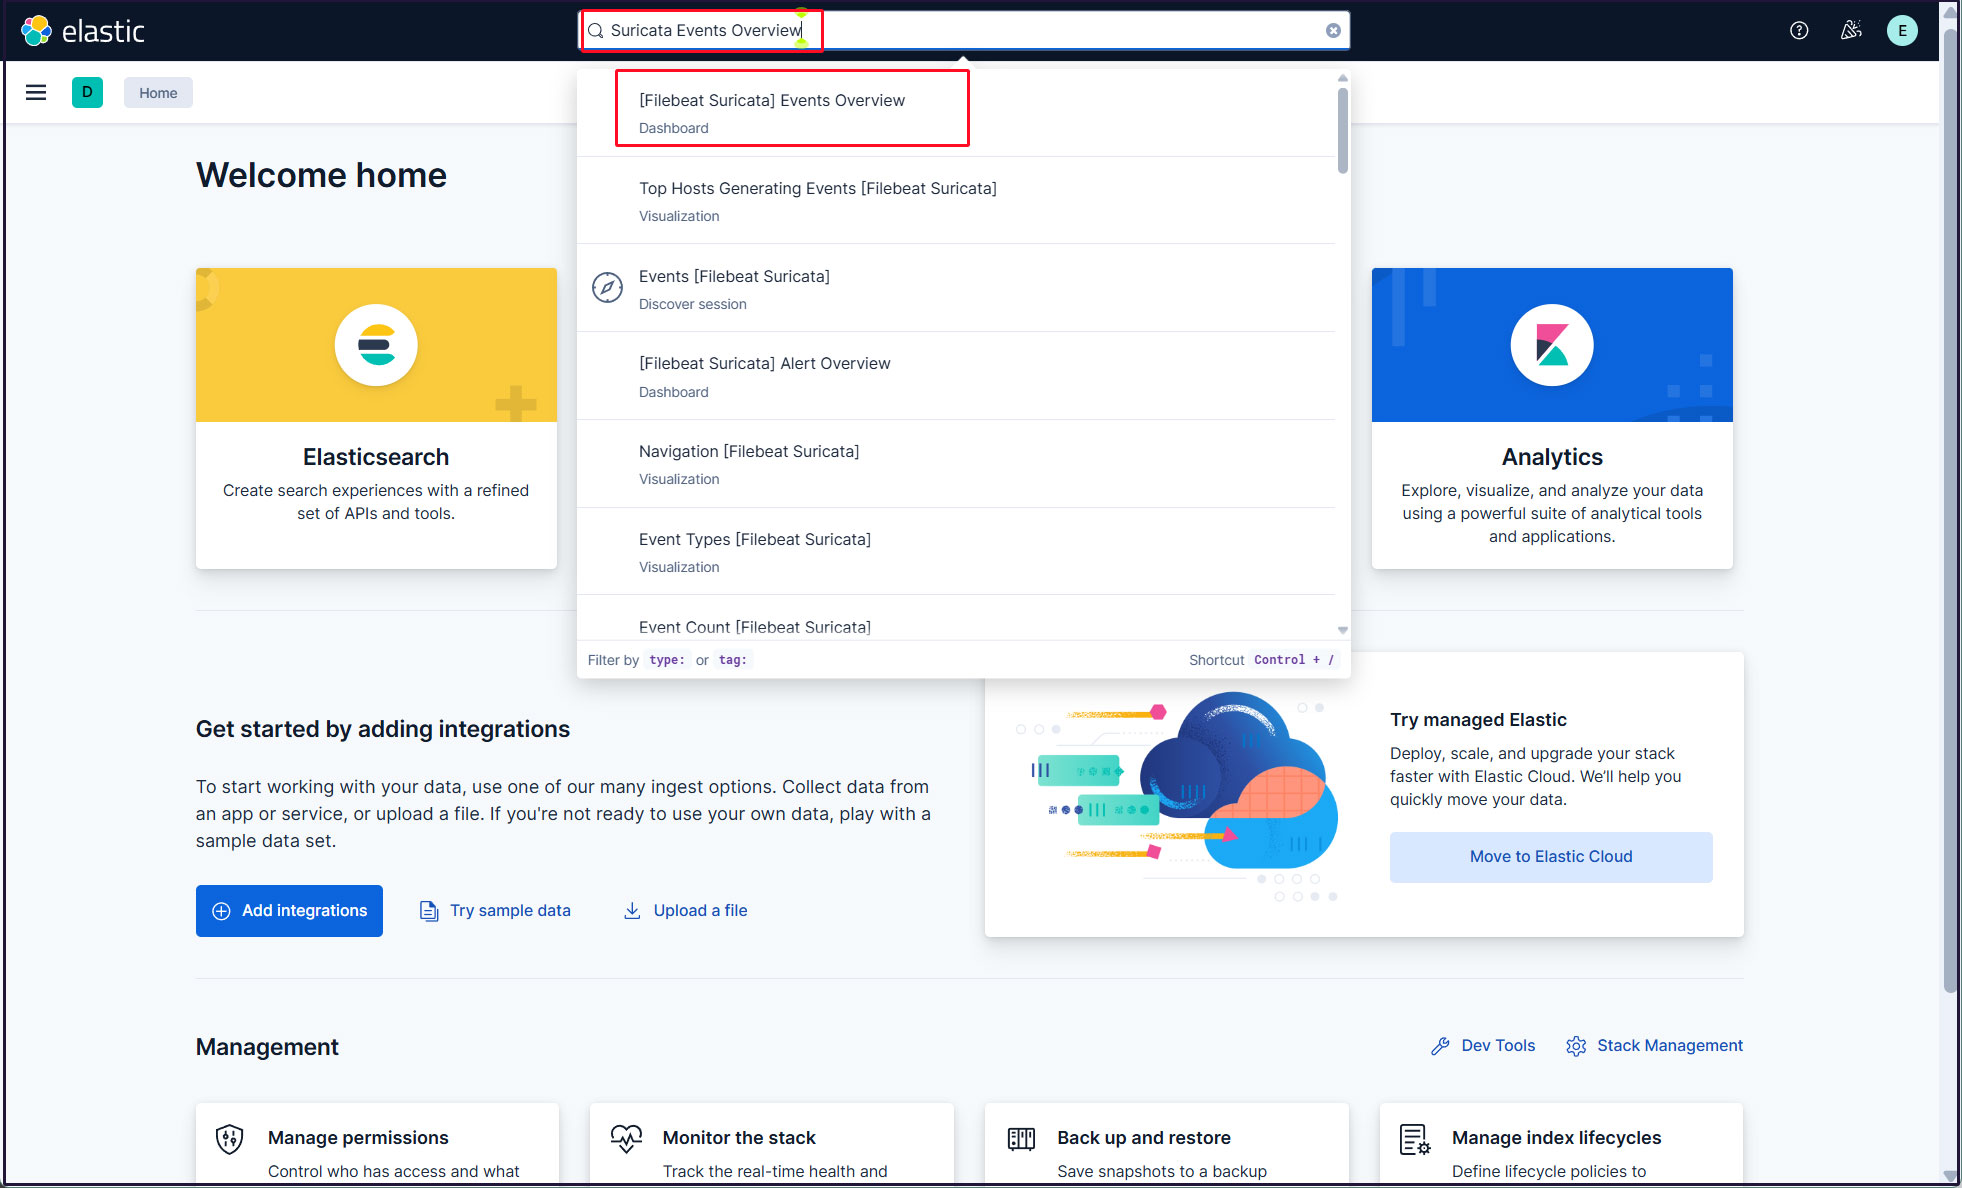
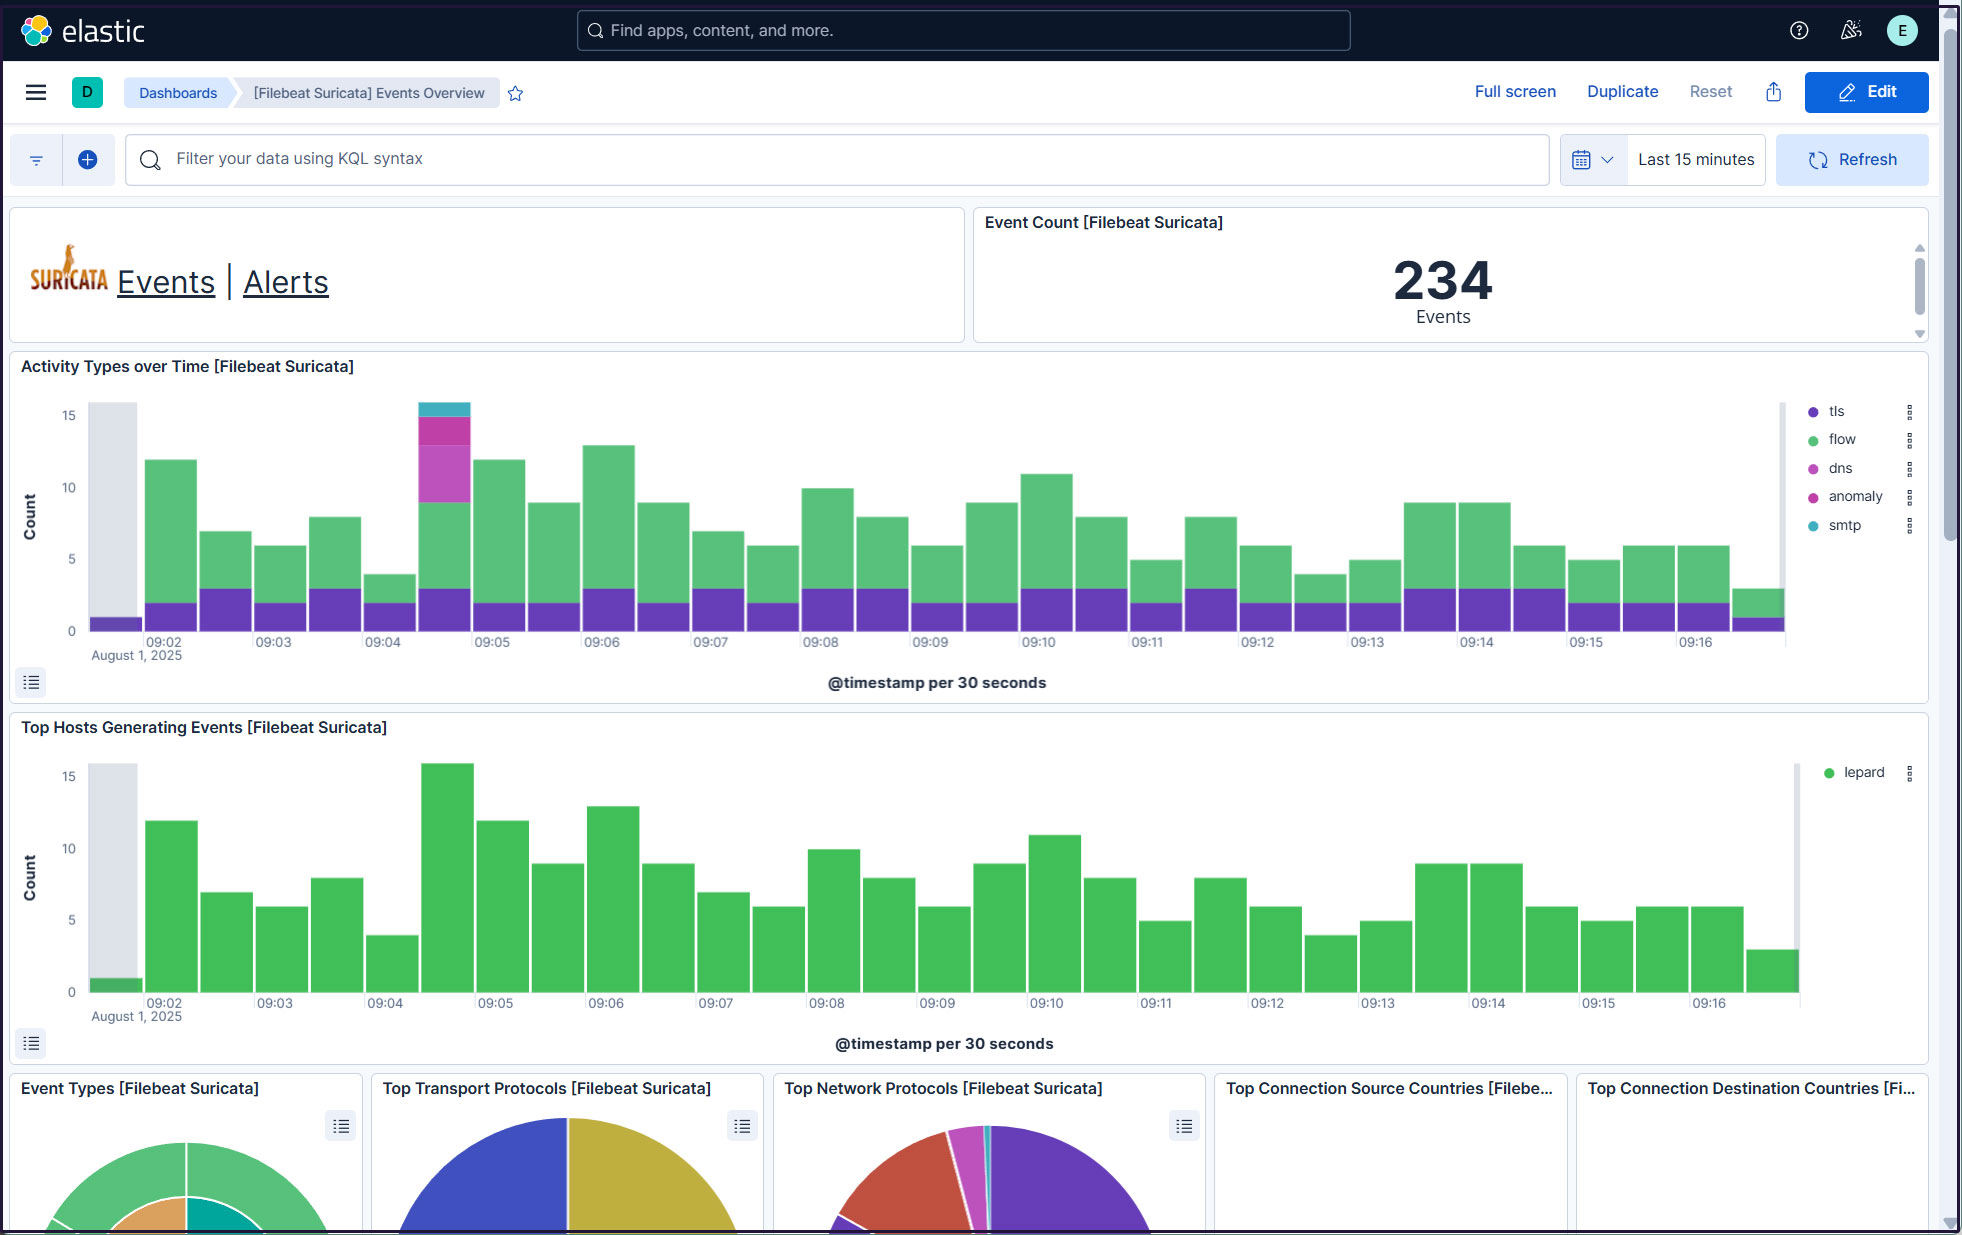
Type "Suricata Events Overview" in the top search field and click [Filebeat Suricata]Events Overview
All Suricata events in the last 15 minutes are displayed
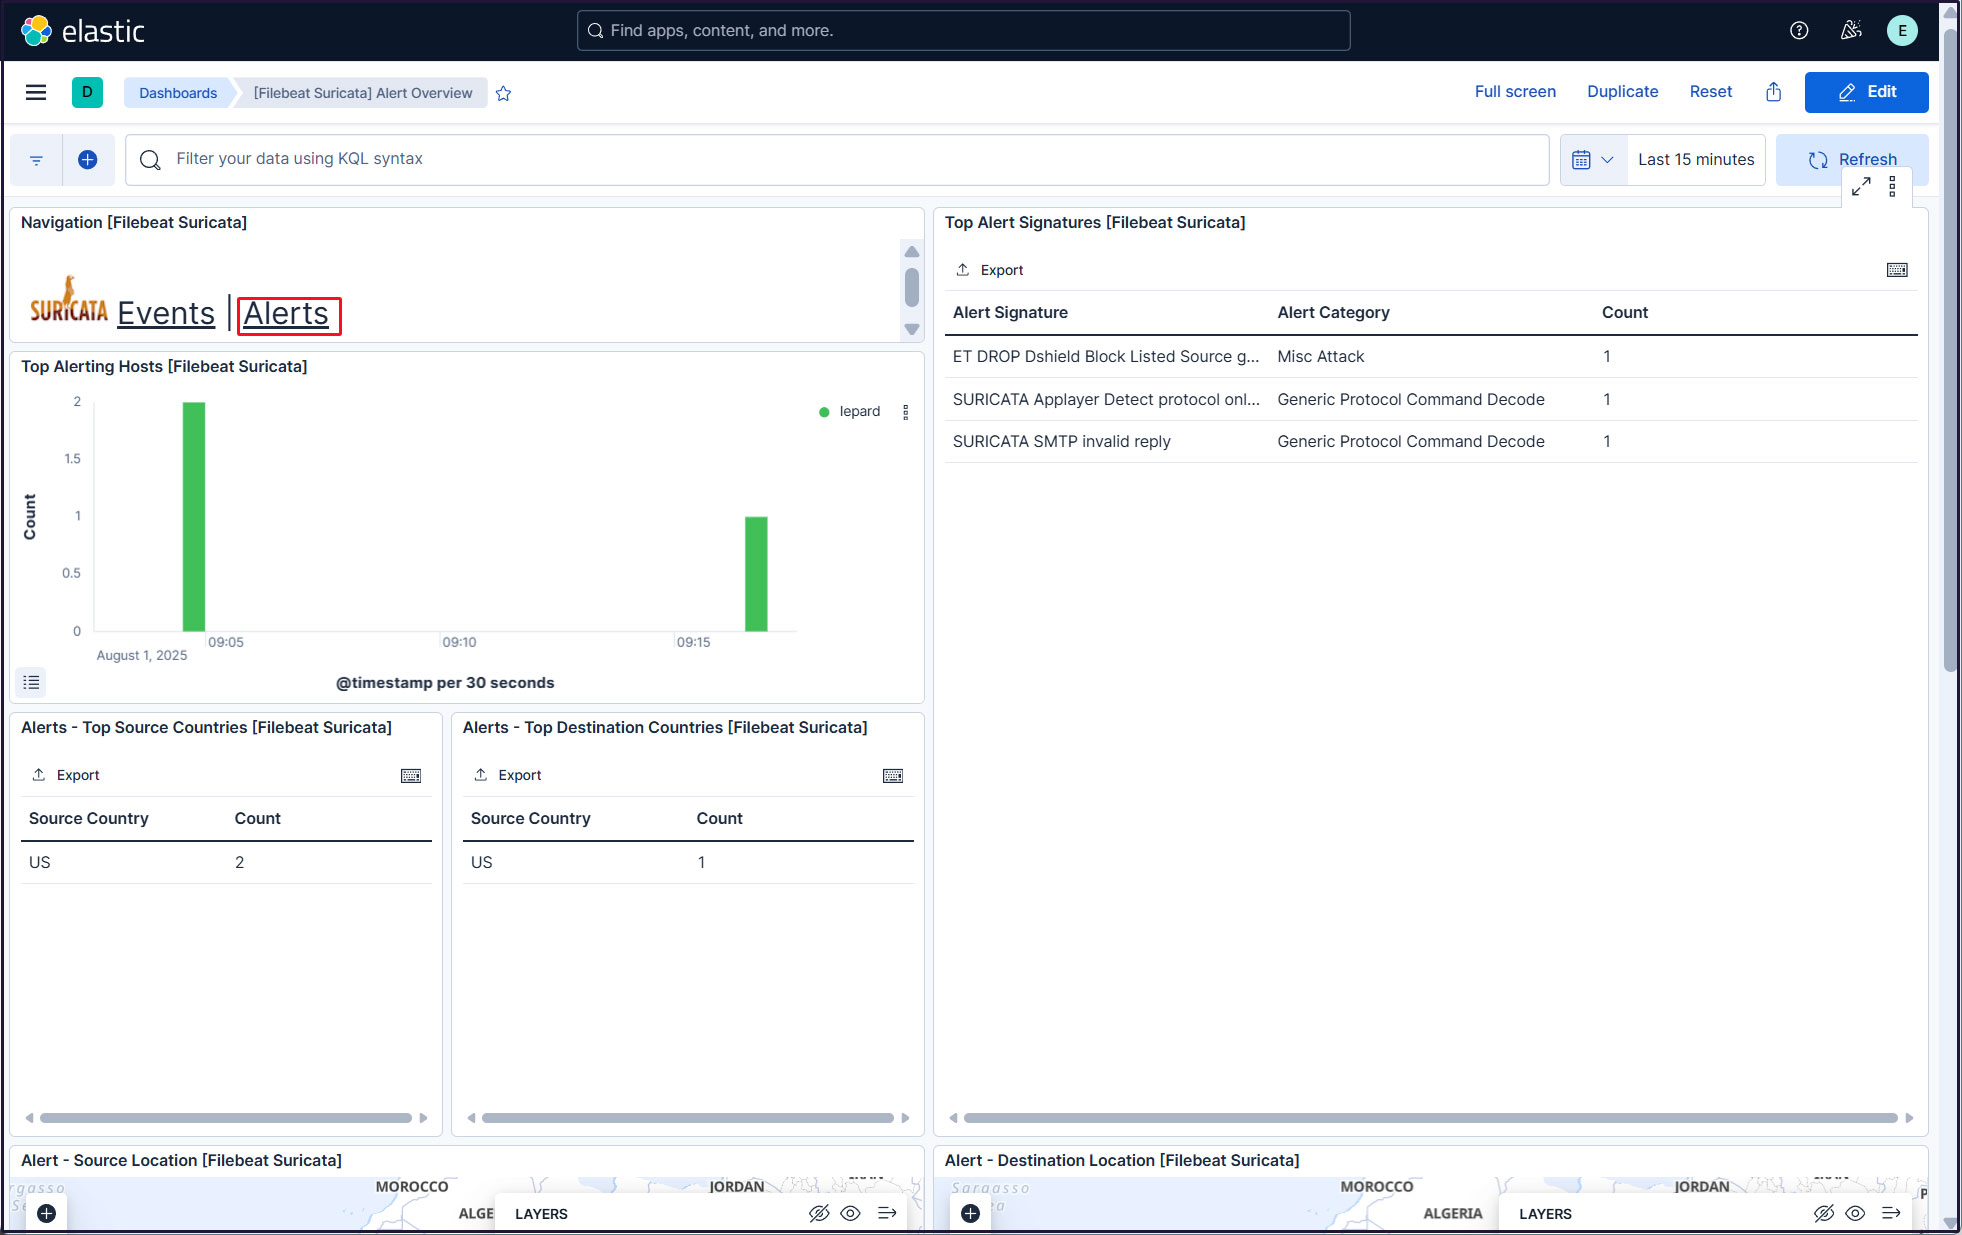
Click on the Alerts text next to the Suricata logo for malicious traffic alerts
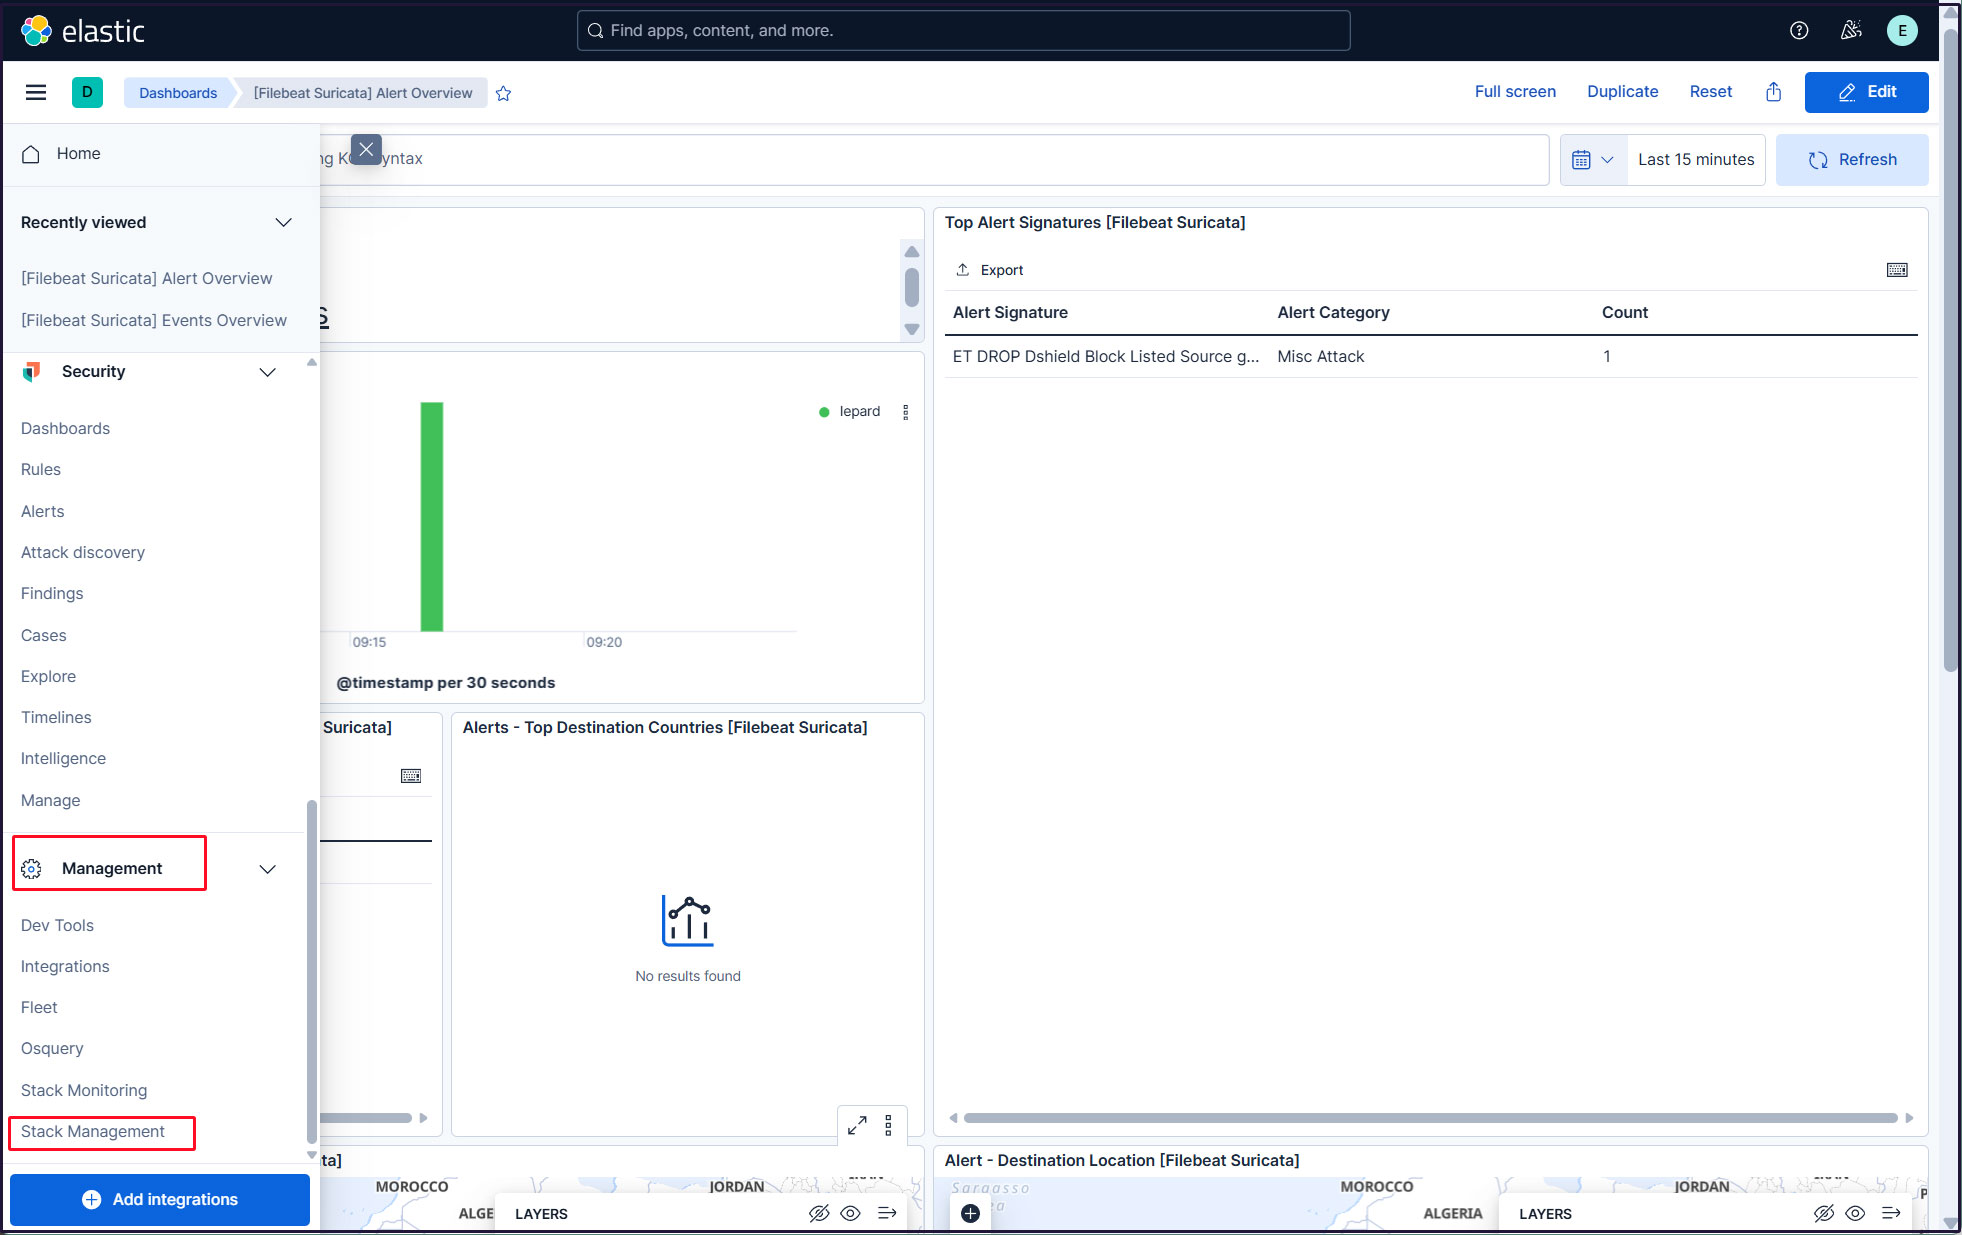
Create a new user account so that you do not have to use the elastic superuser account.
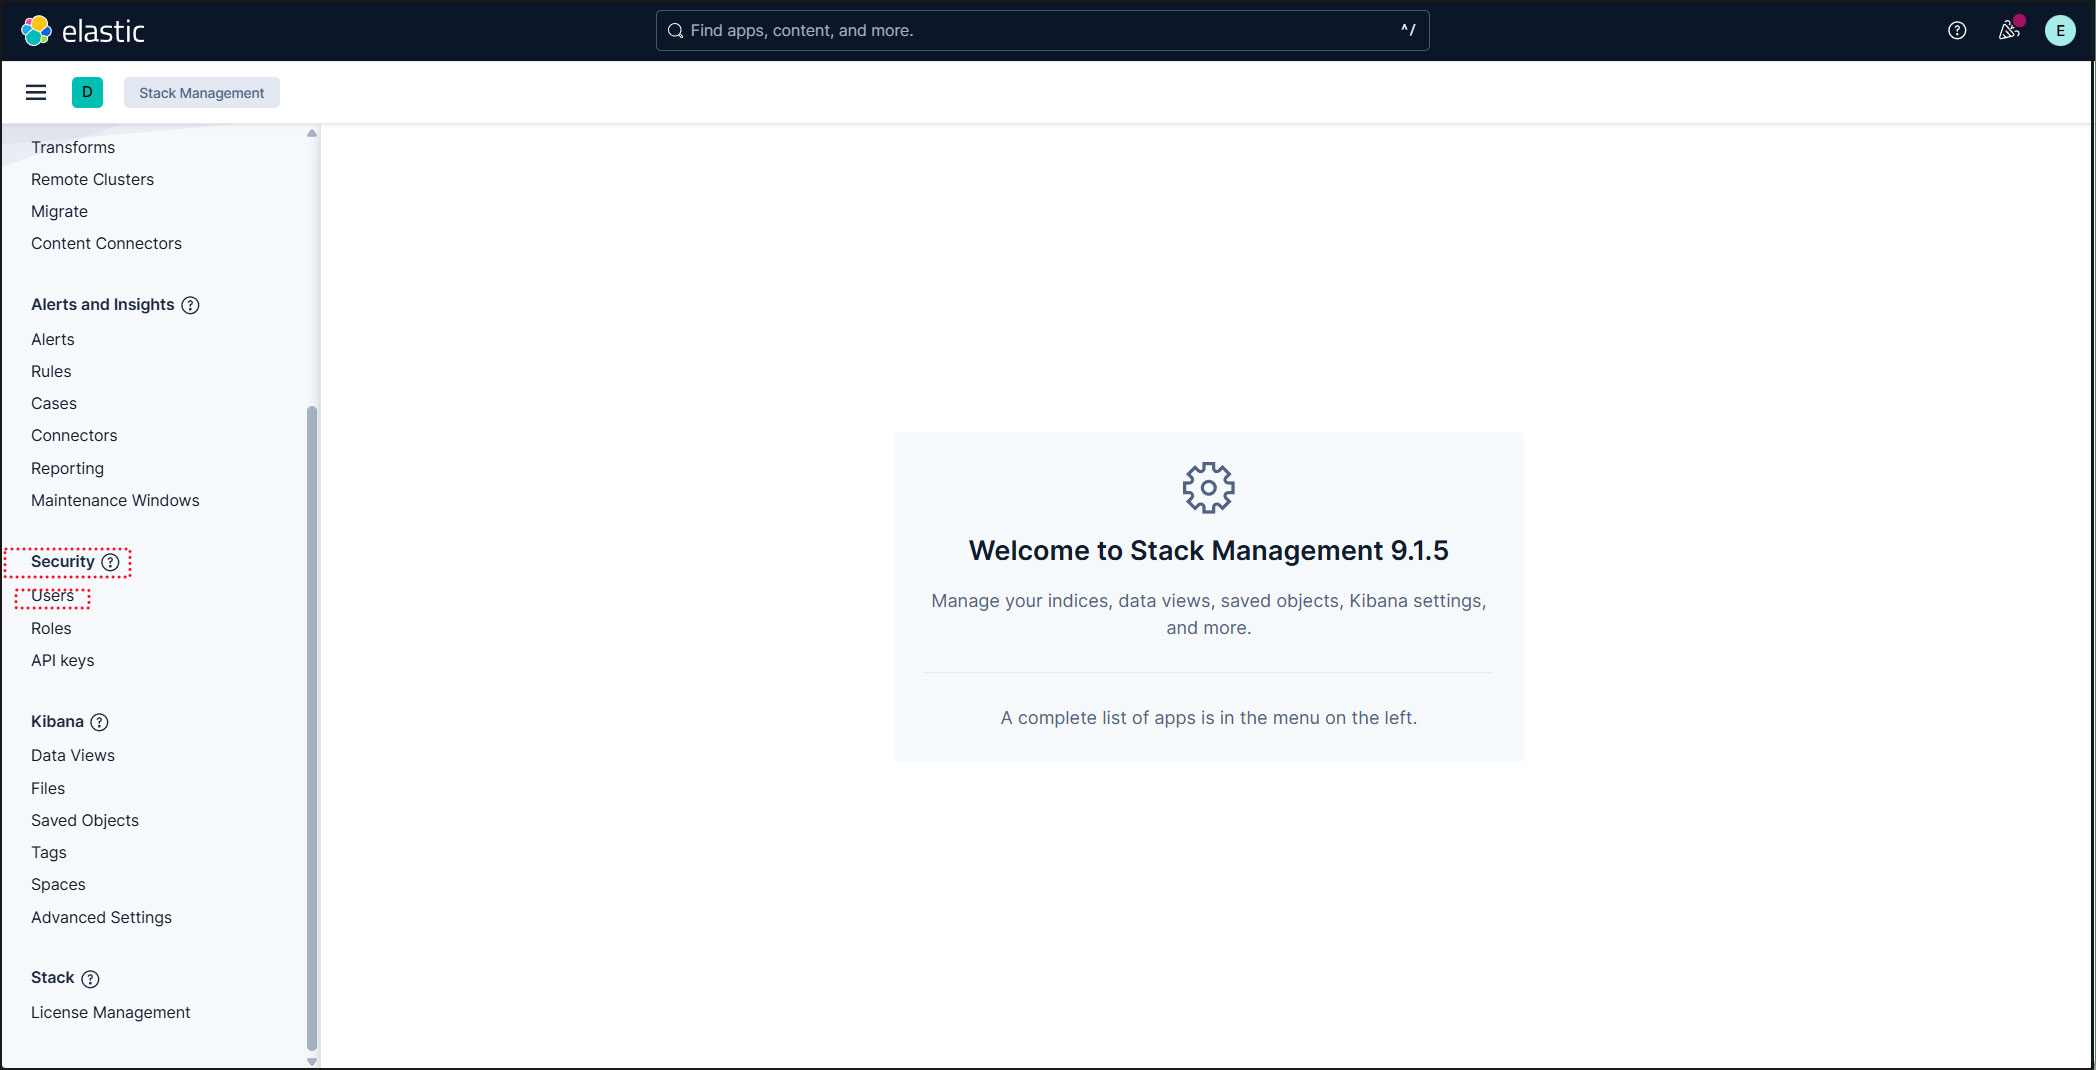
Click on the three-line mark in the upper left corner and select "Stack Management" under "Management"
Select "security" and "Users"
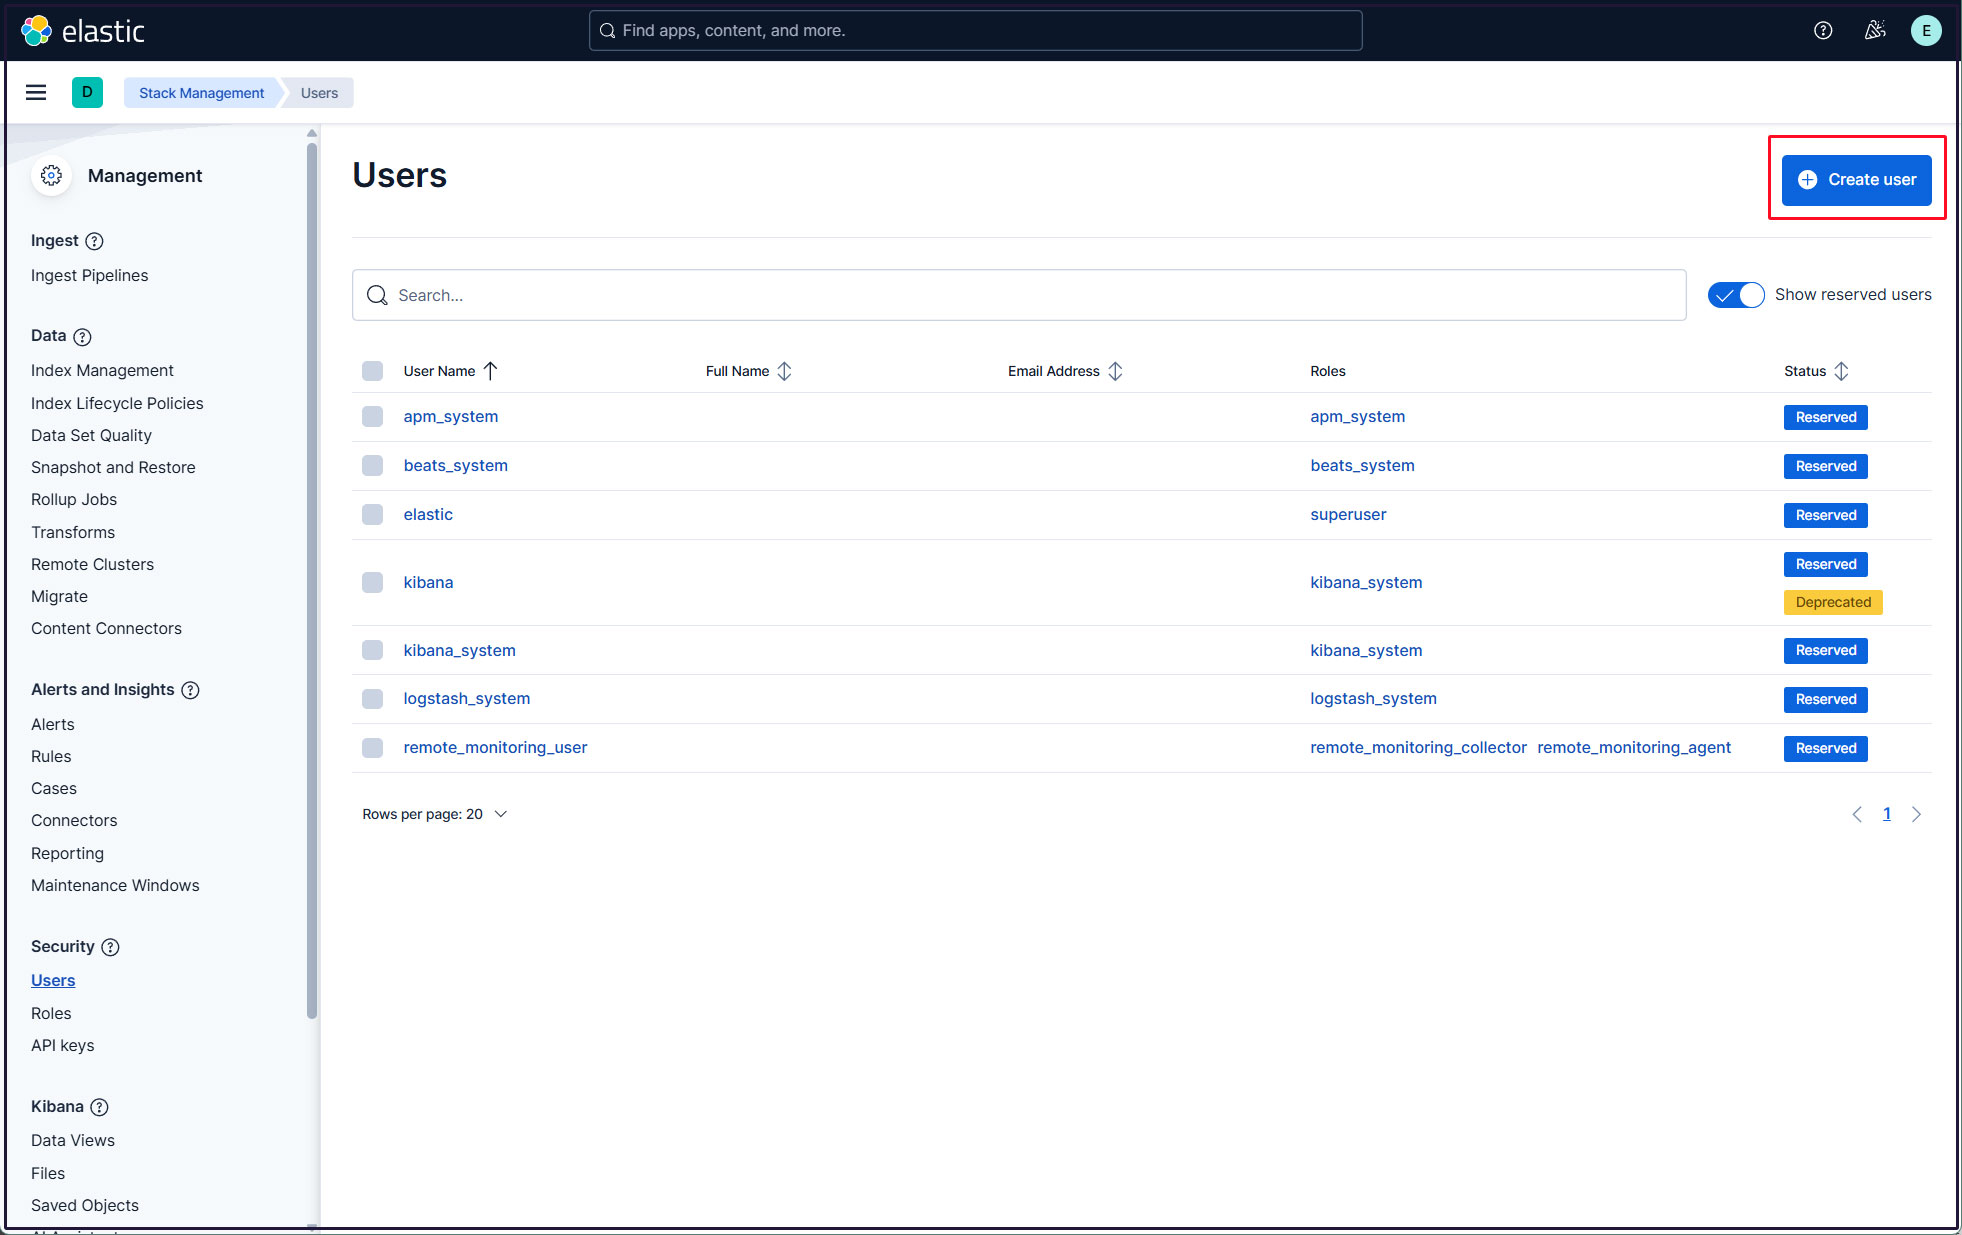
Click on the "Create user" button in the upper right corner
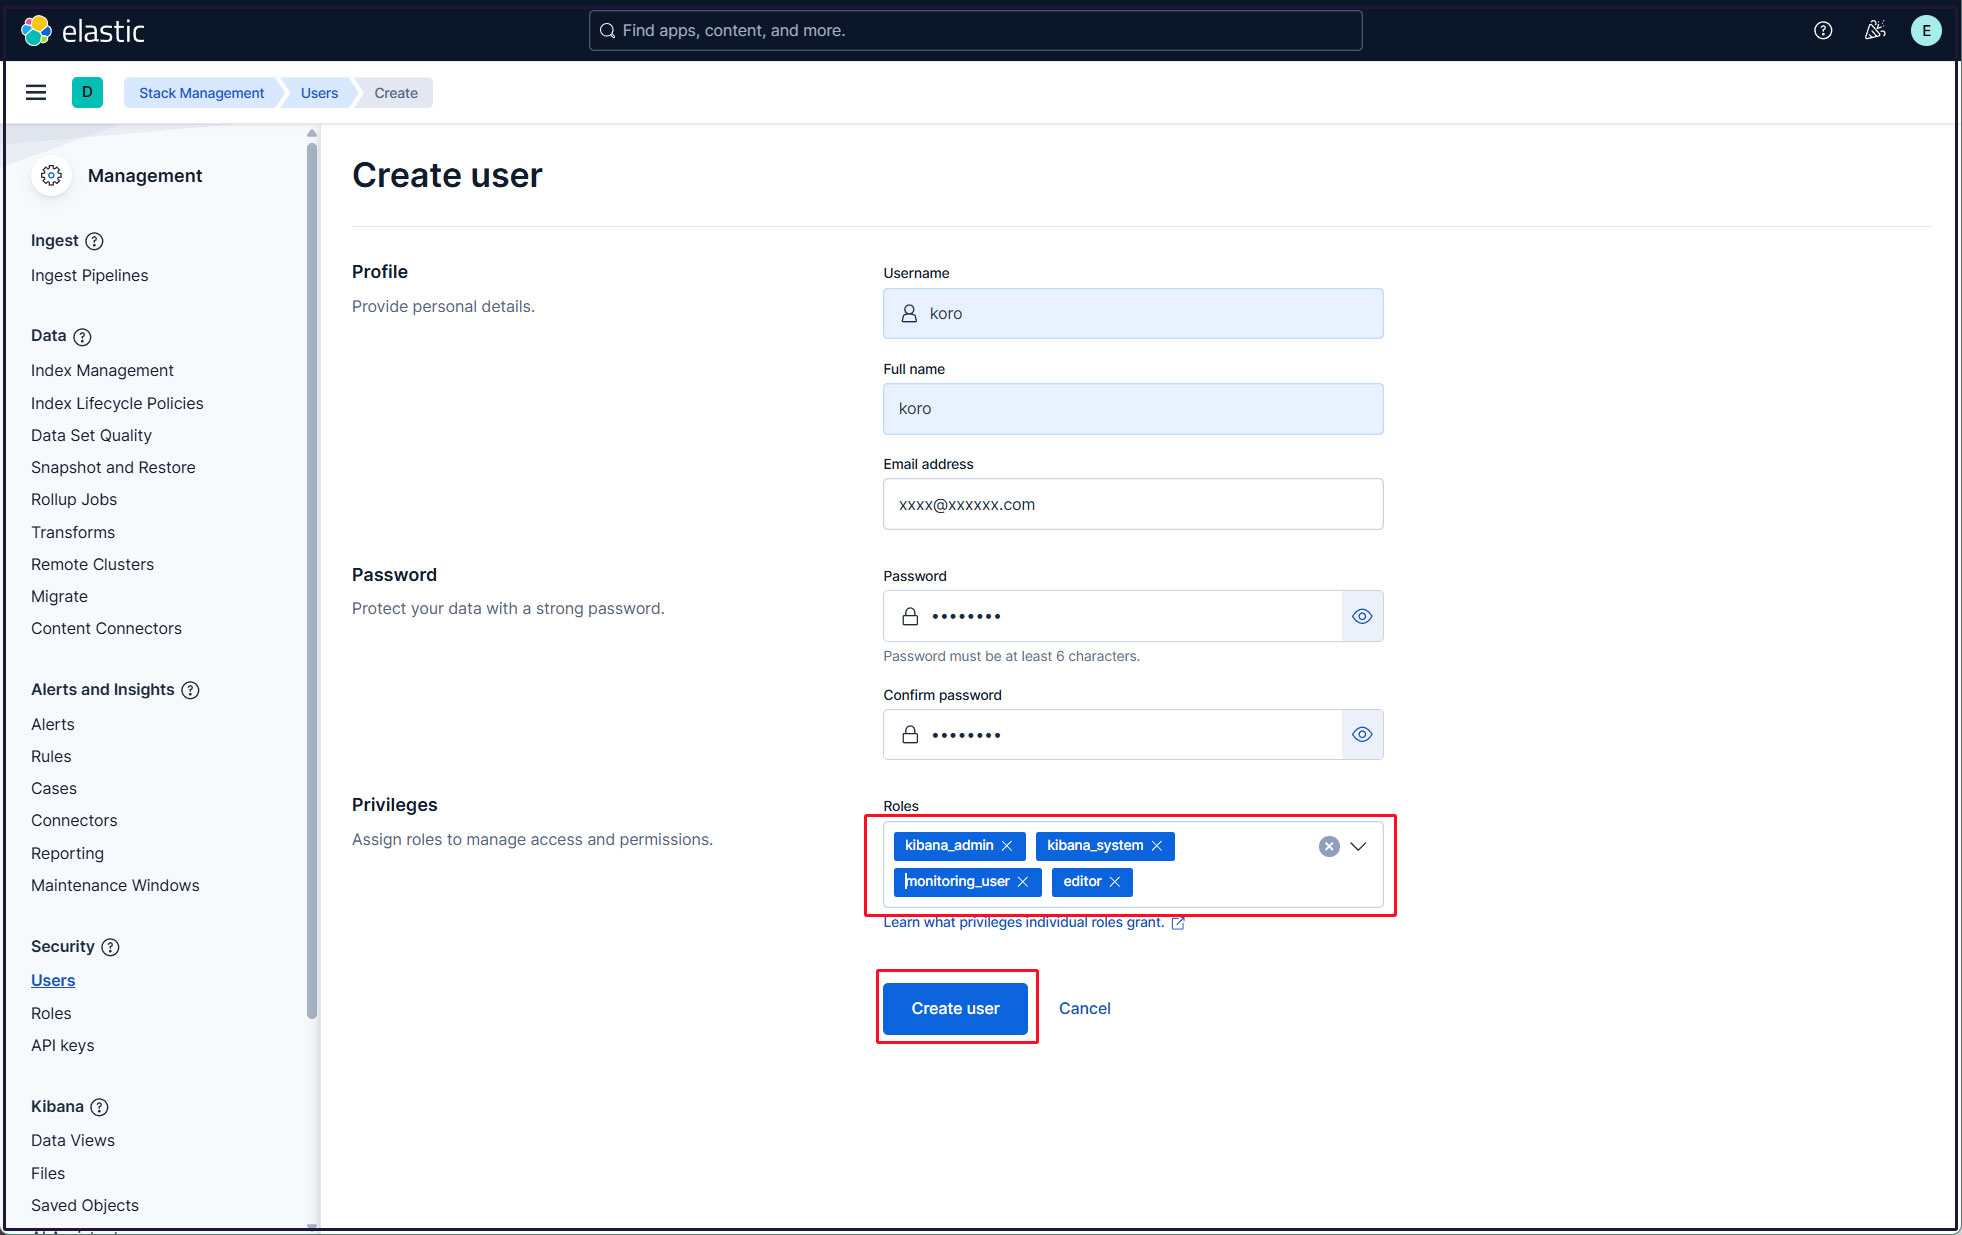
Enter new user information, assign the roles kibana_admin, kibana_system, monitoring_user, and editor in Privileges, and finally click Create user
Log out of the current profile and confirm that you can log in with the newly created user account.