

Prerequisites
In this session, we will install Suricata IDS and ElasticStack on the following server:
・First Server Suricata IDS & Filebeat : MiracleLinux9.6 IPアドレス(192.168.11.83)
・Second server Elasticsearch & kibana : MiracleLinux9.6 IPアドレス(192.168.11.85)
First Server: Suricata Installation
SURICATA IDS/IPS is an open source IDS that monitors communications on the network and detects suspicious traffic.
The basic mechanism is signature-based, so it can detect predefined unauthorized communications. Suricata is also characterized by its ability to provide protection as well as detection.
1.Preparations
①Enable the EPEL repository on your system
|
1 |
# dnf -y install epel-release |
②System update
|
1 |
# dnf update -y |
2. Installing and Configuring Suricata
①Suricata Install
|
1 2 3 4 5 |
# dnf -y install suricata Checking the Version # suricata -V This is Suricata version 7.0.15 RELEASE |
②Determine interface and IP address where Suricata will inspect network packets
|
1 2 3 |
# ip --brief add lo UNKNOWN 127.0.0.1/8 ::1/128 ens160 UP 192.168.11.83/24 |
③Edit configuration file
|
1 2 3 4 5 6 7 8 9 |
# vi /etc/suricata/suricata.yaml # Line 15 : Comment it out and add below (in the vars section, define the network) HOME_NET: "[192.168.11.0/24]" EXTRNAL_NET: "!$HOME_NET" # Line 629 : Set the interface name in the af-packet section af-packet: - interface: ens160 |
|
1 2 3 4 5 |
# vi /etc/sysconfig/suricata # Line 8 :Specify interface # Add options to be passed to the daemon OPTIONS="-i ens160 --user suricata " |
④Updating Suricata Rules
|
1 2 3 4 5 6 7 |
# suricata-update ---------------------------------------------- 6/8/2026 -- 09:36:35 - <Info> -- Writing rules to /var/lib/suricata/rules/suricata.rules: total: 68150; enabled: 52210; added: 68150; removed 0; modified: 0 6/8/2026 -- 09:36:35 - <Info> -- Writing /var/lib/suricata/rules/classification.config 6/8/2026 -- 09:36:38 - <Info> -- Testing with suricata -T. 6/8/2026 -- 09:37:15 - <Info> -- Done. |
⑤Activate Suricata
|
1 2 |
# systemctl enable --now suricata Created symlink /etc/systemd/system/multiuser.target.wants/suricata.service → /usr/lib/systemd/system/suricata.service. |
⑥Confirm Suricata startup
|
1 2 3 4 5 6 7 8 9 10 11 12 13 14 15 16 17 |
# systemctl status suricata ● suricata.service - Suricata Intrusion Detection Service Loaded: loaded (/usr/lib/systemd/system/suricata.service; enabled; preset: disabled) Active: active (running) since Thu 2026-08-06 09:38:02 JST; 15s ago Docs: man:suricata(1) Process: 12095 ExecStartPre=/bin/rm -f /var/run/suricata.pid (code=exited, status=0/SUCCESS) Main PID: 12096 (Suricata-Main) Tasks: 1 (limit: 22901) Memory: 288.6M (peak: 288.6M) CPU: 15.551s CGroup: /system.slice/suricata.service mq12096 /sbin/suricata -c /etc/suricata/suricata.yaml --pidfile /var/run/suricata.pid -i ens160 --user suricata Aug 06 09:38:02 Lepard systemd[1]: Starting Suricata Intrusion Detection Service... Aug 06 09:38:02 Lepard systemd[1]: Started Suricata Intrusion Detection Service. Aug 06 09:38:02 Lepard suricata[12096]: i: suricata: This is Suricata version 7.0.15 RELEASE running in SYSTEM mode |
Check Log
|
1 2 3 4 5 6 7 8 9 10 11 12 |
# tail /var/log/suricata/suricata.log [12096 - Suricata-Main] 2026-08-06 09:38:02 Info: logopenfile: fast output device (regular) initialized: fast.log [12096 - Suricata-Main] 2026-08-06 09:38:02 Info: logopenfile: eve-log output device (regular) initialized: eve.json [12096 - Suricata-Main] 2026-08-06 09:38:02 Info: logopenfile: stats output device (regular) initialized: stats.log [12096 - Suricata-Main] 2026-08-06 09:38:19 Info: detect: 1 rule files processed. 52210 rules successfully loaded, 0 rules failed, 0 [12096 - Suricata-Main] 2026-08-06 09:38:19 Info: threshold-config: Threshold config parsed: 0 rule(s) found [12096 - Suricata-Main] 2026-08-06 09:38:19 Info: detect: 52215 signatures processed. 1311 are IP-only rules, 4510 are inspecting packet payload, 46159 inspect application layer, 109 are decoder event only [12096 - Suricata-Main] 2026-08-06 09:38:33 Warning: af-packet: ens160: AF_PACKET tpacket-v3 is recommended for non-inline operation [12096 - Suricata-Main] 2026-08-06 09:38:33 Info: runmodes: ens160: creating 2 threads [12096 - Suricata-Main] 2026-08-06 09:38:33 Info: unix-manager: unix socket '/var/run/suricata/suricata-command.socket' [12096 - Suricata-Main] 2026-08-06 09:38:34 Notice: threads: Threads created -> W: 2 FM: 1 FR: 1 Engine started. |
Check the stats.log file for statistics (updated every 8 seconds by default)
|
1 |
# tail -f /var/log/suricata/stats.log |
A more advanced output, EVE JSON, can be generated with the following command
|
1 |
# tail -f /var/log/suricata/eve.json |
3.Suricata Testing
①Run ping test with curl utility
|
1 2 |
# curl http://testmynids.org/uid/index.html uid=0(root) gid=0(root) groups=0(root) |
②Check the log file
|
1 2 |
# cat /var/log/suricata/fast.log 08/06/2026-09:40:15.655708 [**] [1:2100498:7] GPL ATTACK_RESPONSE id check returned root [**] [Classification: Potentially Bad Traffic] [Priority: 2] {TCP} 13.227.50.49:80 -> 192.168.11.83:55580 |
4.Setting Suricata Rules
①Display of rule sets packaged in Suricata
|
1 2 3 4 5 6 |
# ls -al /var/lib/suricata/rules/ total 44044 drwxr-s--- 2 root suricata 4096 Aug 6 09:36 . drwxrws--- 4 suricata suricata 4096 Aug 6 09:36 .. -rw-r--r-- 1 root suricata 3228 Aug 6 09:36 classification.config -rw-r--r-- 1 root suricata 45084178 Aug 6 09:36 suricata.rules |
②Index list of sources providing rule sets
|
1 2 3 4 5 6 7 8 9 10 11 12 13 14 15 16 17 18 19 20 21 22 23 24 25 26 27 28 29 30 31 32 33 34 35 36 37 38 39 40 41 42 43 44 45 46 47 48 49 50 51 52 53 54 55 56 57 58 59 60 61 62 63 64 65 66 67 68 69 70 71 72 73 74 75 76 77 78 79 80 81 82 83 84 85 86 87 88 89 90 91 92 93 94 95 96 97 98 99 100 101 102 103 104 105 106 107 108 109 110 111 112 113 114 115 116 117 |
# suricata-update list-sources Name: abuse.ch/feodotracker Vendor: Abuse.ch Summary: Abuse.ch Feodo Tracker Botnet C2 IP ruleset License: CC0-1.0 Name: abuse.ch/sslbl-blacklist Vendor: Abuse.ch Summary: Abuse.ch SSL Blacklist License: CC0-1.0 Replaces: sslbl/ssl-fp-blacklist Name: abuse.ch/sslbl-c2 Vendor: Abuse.ch Summary: Abuse.ch Suricata Botnet C2 IP Ruleset License: CC0-1.0 Name: abuse.ch/sslbl-ja3 Vendor: Abuse.ch Summary: Abuse.ch Suricata JA3 Fingerprint Ruleset License: CC0-1.0 Replaces: sslbl/ja3-fingerprints Name: abuse.ch/urlhaus Vendor: abuse.ch Summary: Abuse.ch URLhaus Suricata Rules License: CC0-1.0 Name: aleksibovellan/nmap Vendor: aleksibovellan Summary: Suricata IDS/IPS Detection Rules Against NMAP Scans License: MIT Name: et/open Vendor: Proofpoint Summary: Emerging Threats Open Ruleset License: MIT Name: et/pro Vendor: Proofpoint Summary: Emerging Threats Pro Ruleset License: Commercial Replaces: et/open Parameters: secret-code Subscription: https://www.proofpoint.com/us/threat-insight/et-pro-ruleset Name: etnetera/aggressive Vendor: Etnetera a.s. Summary: Etnetera aggressive IP blacklist License: MIT Name: oisf/trafficid Vendor: OISF Summary: Suricata Traffic ID ruleset License: MIT Name: pawpatrules Vendor: pawpatrules Summary: PAW Patrules is a collection of rules for IDPS / NSM Suricata engine License: CC-BY-SA-4.0 Name: ptrules/open Vendor: Positive Technologies Summary: Positive Technologies Open Ruleset License: Custom Name: scwx/enhanced Vendor: Secureworks Summary: Secureworks suricata-enhanced ruleset License: Commercial Parameters: secret-code Subscription: https://www.secureworks.com/contact/ (Please reference CTU Countermeasures) Name: scwx/malware Vendor: Secureworks Summary: Secureworks suricata-malware ruleset License: Commercial Parameters: secret-code Subscription: https://www.secureworks.com/contact/ (Please reference CTU Countermeasures) Name: scwx/security Vendor: Secureworks Summary: Secureworks suricata-security ruleset License: Commercial Parameters: secret-code Subscription: https://www.secureworks.com/contact/ (Please reference CTU Countermeasures) Name: stamus/lateral Vendor: Stamus Networks Summary: Lateral movement rules License: GPL-3.0-only Name: stamus/nrd-14-open Vendor: Stamus Networks Summary: Newly Registered Domains Open only - 14 day list, complete License: Commercial Parameters: secret-code Subscription: https://www.stamus-networks.com/stamus-labs/subscribe-to-threat-intel-feed Name: stamus/nrd-30-open Vendor: Stamus Networks Summary: Newly Registered Domains Open only - 30 day list, complete License: Commercial Parameters: secret-code Subscription: https://www.stamus-networks.com/stamus-labs/subscribe-to-threat-intel-feed Name: stamus/nrd-entropy-14-open Vendor: Stamus Networks Summary: Newly Registered Domains Open only - 14 day list, high entropy License: Commercial Parameters: secret-code Subscription: https://www.stamus-networks.com/stamus-labs/subscribe-to-threat-intel-feed Name: stamus/nrd-entropy-30-open Vendor: Stamus Networks Summary: Newly Registered Domains Open only - 30 day list, high entropy License: Commercial Parameters: secret-code Subscription: https://www.stamus-networks.com/stamus-labs/subscribe-to-threat-intel-feed Name: stamus/nrd-phishing-14-open Vendor: Stamus Networks Summary: Newly Registered Domains Open only - 14 day list, phishing License: Commercial Parameters: secret-code Subscription: https://www.stamus-networks.com/stamus-labs/subscribe-to-threat-intel-feed Name: stamus/nrd-phishing-30-open Vendor: Stamus Networks Summary: Newly Registered Domains Open only - 30 day list, phishing License: Commercial Parameters: secret-code Subscription: https://www.stamus-networks.com/stamus-labs/subscribe-to-threat-intel-feed Name: tgreen/hunting Vendor: tgreen Summary: Threat hunting rules License: GPLv3 |
③Enable source (if tgreen/hunting is enabled)
|
1 2 3 4 5 6 7 8 9 10 11 |
# suricata-update enable-source tgreen/hunting 6/8/2026 -- 09:42:56 - <Info> -- Using data-directory /var/lib/suricata. 6/8/2026 -- 09:42:56 - <Info> -- Using Suricata configuration /etc/suricata/suricata.yaml 6/8/2026 -- 09:42:56 - <Info> -- Using /usr/share/suricata/rules for Suricata provided rules. 6/8/2026 -- 09:42:56 - <Info> -- Found Suricata version 7.0.15 at /usr/sbin/suricata. 6/8/2026 -- 09:42:56 - <Warning> -- Source index does not exist, will use bundled one. 6/8/2026 -- 09:42:56 - <Warning> -- Please run suricata-update update-sources. 6/8/2026 -- 09:42:56 - <Info> -- Creating directory /var/lib/suricata/update/sources 6/8/2026 -- 09:42:56 - <Info> -- Enabling default source et/open 6/8/2026 -- 09:42:56 - <Info> -- Source tgreen/hunting enabled |
Perform update
|
1 |
# suricata-update update-sources |
Restart Suricata service
|
1 |
# systemctl restart suricata |
5.Creating Suricata Custom Rules
①Create a file containing customer rules
|
1 2 3 |
# vi /var/lib/suricata/rules/local.rules Please include the following information alert icmp any any -> any any (msg:"ICMP Ping"; sid:100000; rev:1;) |
②Edit the /etc/suricata/suricata.yaml configuration file and include local.rules.
|
1 2 3 4 5 6 7 8 |
# vi /etc/suricata/suricata.yaml # Add the following around line 2235 default-rule-path: /var/lib/suricata/rules rule-files: - suricata.rules - local.rules |
③Verify SURICATA Configuration
|
1 2 3 4 5 6 7 8 9 10 11 12 13 14 |
# suricata -T -c /etc/suricata/suricata.yaml -v Notice: suricata: This is Suricata version 7.0.15 RELEASE running in SYSTEM mode Info: cpu: CPUs/cores online: 2 Info: suricata: Running suricata under test mode Info: suricata: Setting engine mode to IDS mode by default Info: exception-policy: master exception-policy set to: auto Info: logopenfile: fast output device (regular) initialized: fast.log Info: logopenfile: eve-log output device (regular) initialized: eve.json Info: logopenfile: stats output device (regular) initialized: stats.log Info: detect: 2 rule files processed. 52211 rules successfully loaded, 0 rules failed, 0 Info: threshold-config: Threshold config parsed: 0 rule(s) found Info: detect: 52216 signatures processed. 1312 are IP-only rules, 4510 are inspecting packet payload, 46159 inspect application layer, 109 are decoder event only Notice: suricata: Configuration provided was successfully loaded. Exiting. |
Restart Suricata
|
1 |
# systemctl restart suricata |
④Testing the Application of Custom Rules
Run a ping on another device on the same local network to see if it was logged.
|
1 2 3 4 |
# cat /var/log/suricata/fast.log 08/06/2026-09:59:24.742756 [**] [1:100000:1] ICMP Ping [**] [Classification: (null)] [Priority: 3] {ICMP} 192.168.11.14:8 -> 192.168.11.83:0 08/06/2026-09:59:24.742826 [**] [1:100000:1] ICMP Ping [**] [Classification: (null)] [Priority: 3] {ICMP} 192.168.11.83:0 -> 192.168.11.14:0 |
To retrieve logs in JSON format, install jq on the system.
|
1 |
# dnf install jq |
|
1 |
# systemctl restart suricata |
Run the following command to ping another device on the same local network
|
1 2 3 4 5 6 7 8 9 10 11 12 13 14 15 16 17 18 19 20 21 22 23 24 25 26 27 28 29 30 31 32 33 |
# tail -f /var/log/suricata/eve.json | jq 'select(.event_type=="alert")' When you run `ping`, the following is displayed on the console: { "timestamp": "2026-08-06T10:30:52.196322+0900", "flow_id": 1405952270196600, "in_iface": "ens160", "event_type": "alert", "src_ip": "192.168.11.83", "dest_ip": "192.168.11.14", "proto": "ICMP", "icmp_type": 0, "icmp_code": 0, "pkt_src": "wire/pcap", "alert": { "action": "allowed", "gid": 1, "signature_id": 100000, "rev": 1, "signature": "ICMP Ping", "category": "", "severity": 3 }, "direction": "to_client", "flow": { "pkts_toserver": 2, "pkts_toclient": 1, "bytes_toserver": 148, "bytes_toclient": 74, "start": "2026-08-06T10:30:52.196276+0900", "src_ip": "192.168.11.14", "dest_ip": "192.168.11.83" } } |
6. Configuring Suricata as an IPS
Configure Suricata to run in IPS mode to drop malicious network traffic.
①Edit the SURICATA configuration file located at /etc/sysconfig/suricata
|
1 2 3 4 5 6 7 |
# vi /etc/sysconfig/suricata Find the line "OPTIONS="-i ens160 --user suricata" and add a # at the beginning of the line to comment it out. Next, add the line `OPTIONS="-q 0 -vvv --user suricata"` to instruct SURICATA to run in IPS mode. . . . # OPTIONS="-i ens160 --user suricata" OPTIONS="-q 0 -vvv --user suricata" |
➁Restart Suricata
|
1 2 |
# systemctl daemon-reload # systemctl restart suricata.service |
➂Direct incoming network traffic to Suricata's NFQUEUE
Firewalld is installed and enabled, so add the necessary rules for Suricata to Firewalld.
|
1 2 3 4 5 6 7 8 9 10 11 12 13 14 |
Add a FORWARD rule so that, if the server is acting as a gateway for other systems, all of that traffic is also forwarded to SURICATA for processing. # firewall-cmd --permanent --direct --add-rule ipv4 filter FORWARD 0 -j NFQUEUE # firewall-cmd --permanent --direct --add-rule ipv6 filter FORWARD 0 -j NFQUEUE The last two INPUT and OUTPUT rules send all remaining traffic—other than SSH traffic—to Suricata for processing. # firewall-cmd --permanent --direct --add-rule ipv4 filter INPUT 1 -j NFQUEUE # firewall-cmd --permanent --direct --add-rule ipv4 filter OUTPUT 1 -j NFQUEUE Do the same for IPv6 # firewall-cmd --permanent --direct --add-rule ipv6 filter INPUT 1 -j NFQUEUE # firewall-cmd --permanent --direct --add-rule ipv6 filter OUTPUT 1 -j NFQUEUE Reload Firewalld # firewall-cmd --reload |
④Verify that SURICATA is dropping traffic correctly
If there is an entry matching sid:2100498 in /var/lib/suricata/rules/suricata.rules, comment it out, and add the rule to /var/lib/suricata/rules/local.rules
|
1 2 3 |
# vi /var/lib/suricata/rules/local.rules drop ip any any -> any any (msg:"GPL ATTACK_RESPONSE id check returned root"; content:"uid=0|28|root|29|"; classtype:bad-unknown; sid:2100498; rev:7; metadata:created_at 2010_09_23, confidence Medium, signature_severity Informational, updated_at 2019_07_26;) |
⑤Suricata restart
|
1 |
# systemctl restart suricata |
⑥Test this rule using curl
|
1 2 |
# curl --max-time 5 http://testmynids.org/uid/index.html curl: (28) Operation timed out after 5000 milliseconds with 0 out of 39 bytes received |
|
1 2 3 4 5 6 7 8 9 10 11 12 13 14 15 16 17 18 19 20 21 22 23 24 25 26 27 28 29 30 31 32 33 34 35 36 37 |
# jq 'select(.alert .signature_id==2100498)' /var/log/suricata/eve.json { "timestamp": "2026-08-06T10:50:16.972694+0900", "flow_id": 156585036671572, "event_type": "alert", "src_ip": "13.227.50.46", "src_port": 80, "dest_ip": "192.168.11.83", "dest_port": 52606, "proto": "TCP", "pkt_src": "wire/pcap", "tx_id": 0, "tx_guessed": true, "alert": { "action": "blocked", "gid": 1, "signature_id": 2100498, "rev": 7, "signature": "GPL ATTACK_RESPONSE id check returned root", "category": "Potentially Bad Traffic", "severity": 2, "metadata": { "confidence": [ "Medium" ], "created_at": [ "2010_09_23" ], "signature_severity": [ "Informational" ], "updated_at": [ "2019_07_26" ] } }, |
"action": "blocked", is set
Integration of the ELK Stack and SURICATA
Install and configure Elasticsearch and Kibana to visualize and search SURICATA logs more efficiently
This section will be performed on the second MiracleLinux 9.6 server (IP: 192.168.11.85).
1. Elasticsearch Install
1.1 Download and install the GPG key
|
1 |
# rpm --import https://artifacts.elastic.co/GPG-KEY-elasticsearch |
1.2 Create the repository definition in the /etc/yum/yum.repos.d directory.
|
1 2 3 4 5 6 7 8 9 10 11 |
# vi /etc/yum.repos.d/elasticsearch.repo Describe the following content [elasticsearch] name=Elasticsearch repository for 9.x packages baseurl=https://artifacts.elastic.co/packages/9.x/yum gpgcheck=1 gpgkey=https://artifacts.elastic.co/GPG-KEY-elasticsearch enabled=0 autorefresh=1 type=rpm-md |
1.3 Elasticsearch Install
|
1 |
# dnf -y install --enablerepo=elasticsearch elasticsearch |
2. Elasticsearch Settings
Elasticsearch is configured by default to accept only local connections.
Additionally, tools such as Filebeat cannot send logs because authentication is not enabled.
This time, we will configure Elasticsearch's network settings and enable the xpack security module built into Elasticsearch。
2.1 Elasticsearch Network Configuration
Since the Elasticsearch and SURICATA servers are separate, Elasticsearch must be configured to listen for connections on the private network interface.
|
1 2 3 4 5 6 7 8 |
# vi /etc/elasticsearch/elasticsearch.yml Line 57 : Add the local address of the Elasticsearch server #network.host: 192.168.0.1 network.host: 192.168.11.85 Line 62 : Uncomments http.port: 9200 |
2.2 Start Elasticsearch
|
1 2 3 |
# systemctl daemon-reload # systemctl enable elasticsearch.service # systemctl start elasticsearch.service |
2.3 Create passwords for elastic and kibana_system
Be sure to copy the passwords for the elastic user and kibana_system user, as they will be needed later.
The kibana_system user is used for configuring Kibana.
The elastic user is used for configuring Filebeat and Auditbeat, and for logging into Kibana.
If you forget your password, you can use the command again to reset it.
[elastic] User password creation
|
1 2 3 4 5 6 7 8 9 10 |
# cd /usr/share/elasticsearch/bin # ./elasticsearch-reset-password -u elastic This tool will reset the password of the [elastic] user to an autogenerated value. The password will be printed in the console. Please confirm that you would like to continue [y/N]y Password for the [elastic] user successfully reset. New value: Sw5Wb58yJPnFdOaXeyP+ |
※Resetting Elasticsearch Passwords
The automatically generated Elastic user password is too complex, so you can reset it using the /usr/share/elasticsearch/bin/elasticsearch-reset-password command.
To reset your password, execute the command.
|
1 2 3 4 5 6 7 8 9 10 |
# /usr/share/elasticsearch/bin/elasticsearch-reset-password -u elastic -i This tool will reset the password of the [elastic] user. You will be prompted to enter the password. Please confirm that you would like to continue [y/N]y Enter password for [elastic]: Re-enter password for [elastic]: Password for the [elastic] user successfully reset. |
[kibana_system] User Password Creation
|
1 2 3 4 5 6 7 8 9 10 |
# cd /usr/share/elasticsearch/bin # ./elasticsearch-reset-password -u kibana_system This tool will reset the password of the [kibana_system] user to an autogenerated value. The password will be printed in the console. Please confirm that you would like to continue [y/N]y Password for the [kibana_system] user successfully reset. New value: afPeLUgHpjHdtr6p_H93 |
3. Installing and Configuring Kibana
We will also perform this section on the second MiracleLinux 9.6 server (IP: 192.168.11.85).
3.1 Kibana Installation
|
1 2 3 4 5 6 |
# dnf -y install --enablerepo=elasticsearch kibana Installed: kibana-9.5.0-1.x86_64 Complete! |
3.2 xpack Security Module Configuration
Enable Kibana's xpack security features to generate several encryption keys that Kibana uses to store data in Elasticsearch.
Encryption keys are created using the kibana-encryption-keys utility located in the /usr/share/kibana/bin directory.
Store the three keys you created in a secure location.
|
1 2 3 4 5 |
# cd /usr/share/kibana/bin/ # ./kibana-encryption-keys generate -q --force xpack.encryptedSavedObjects.encryptionKey: 2eea91cdc6b80954660d5307c192e1310090106f5cdba10d1e9e1bbfae7dea12 xpack.reporting.encryptionKey: 59f96791e2fdf59fe5dc11ead37d164fb203895d0eee4e0cf779b4294c212cf1 xpack.security.encryptionKey: ddf50e3f4a695005bacffa38a855266da7f368fd145badcc3b82ace18c5cc65e |
Add these keys to Kibana's /etc/kibana/kibana.yml configuration file.
|
1 2 3 4 5 6 |
# vi /etc/kibana/kibana.yml Write it on the last line xpack.encryptedSavedObjects.encryptionKey: 2eea91cdc6b80954660d5307c192e1310090106f5cdba10d1e9e1bbfae7dea12 xpack.reporting.encryptionKey: 59f96791e2fdf59fe5dc11ead37d164fb203895d0eee4e0cf779b4294c212cf1 xpack.security.encryptionKey: ddf50e3f4a695005bacffa38a855266da7f368fd145badcc3b82ace18c5cc65e |
3.3 Kibana Network Configuration
|
1 2 3 4 5 6 7 8 |
# vi /etc/kibana/kibana.yml Line 6 : Uncomments server.port: 5601 Line 12 : Add the server's private IP address (192.168.11.85) #server.host: "localhost" server.host: "192.168.11.85" |
3.4 Generating a Kibana-Elasticsearch Enrollment Token
To configure a Kibana instance to communicate with an existing Elasticsearch cluster with security enabled, an enrollment token is required. An enrollment token for Kibana can be generated using the following command:
|
1 2 3 |
# /usr/share/elasticsearch/bin/elasticsearch-create-enrollment-token -s kibana eyJ2ZXIiOiI4LjE0LjAiLCJhZHIiOlsiMTkyLjE2OC4xMS44NTo5MjAwIl0sImZnciI6ImQ5Y2I3NjFiNzhkM2Q4Y2JjZTAyM2M5NzMwNjRiOTlhMGRjNDhhZjY0YTNkMDQ2MTg4YWEyZTdjNmVkZGQxMjAiLCJrZXkiOiJ1dGtiMVo4QjZFLS1LdGRGcWdDODpjRHBzMUJwQnlQT0JnQzdSTThRZzdnIn0= |
3.5 Starting Kibana
Launch Kibana 9 and configure it to run at system startup.
|
1 2 |
# systemctl enable --now kibana # systemctl start kibana |
Status Check
|
1 2 3 4 5 6 7 8 9 10 11 12 13 14 15 16 17 18 19 20 21 22 23 |
# systemctl status kibana ● kibana.service - Kibana Loaded: loaded (/usr/lib/systemd/system/kibana.service; enabled; preset: disabled) Active: active (running) since Thu 2026-08-06 12:27:06 JST; 46s ago Docs: https://www.elastic.co Main PID: 140360 (MainThread) Tasks: 11 (limit: 22896) Memory: 797.2M (peak: 797.7M) CPU: 18.399s CGroup: /system.slice/kibana.service └─140360 /usr/share/kibana/bin/../node/default/bin/node /usr/share/kibana/bin/../src/cli/kibana/dist Aug 06 12:27:10 Lion kibana[140360]: Native global console methods have been overridden in production environment. Aug 06 12:27:13 Lion kibana[140360]: [2026-08-06T12:27:13.481+09:00][INFO ][root] Kibana is starting Aug 06 12:27:13 Lion kibana[140360]: [2026-08-06T12:27:13.531+09:00][INFO ][node] Kibana process configured with roles: [background_tasks, ui] Aug 06 12:27:26 Lion kibana[140360]: [2026-08-06T12:27:25.971+09:00][INFO ][plugins-service] The following plugins are disabled: "cloudChat,cloudExp> Aug 06 12:27:26 Lion kibana[140360]: [2026-08-06T12:27:26.056+09:00][INFO ][http.server.Preboot] http server running at http://192.168.11.85:5601 Aug 06 12:27:26 Lion kibana[140360]: [2026-08-06T12:27:26.604+09:00][INFO ][plugins-system.preboot] Setting up [1] plugins: [interactiveSetup] Aug 06 12:27:26 Lion kibana[140360]: [2026-08-06T12:27:26.622+09:00][INFO ][preboot] "interactiveSetup" plugin is holding setup: Validating Elastics> Aug 06 12:27:26 Lion kibana[140360]: [2026-08-06T12:27:26.667+09:00][INFO ][root] Holding setup until preboot stage is completed. Aug 06 12:27:33 Lion kibana[140360]: i Kibana has not been configured. Aug 06 12:27:33 Lion kibana[140360]: Go to http://192.168.11.85:5601/?code=420901 to get started. |
The following appears toward the end of the output:
Go to http://192.168.11.85:5601/?code=420901 to get started.
Copy the provided Kibana URL (including the code) and use it in your browser to access Kibana and complete the setup.
4. Accessing the Kibana 9 Dashboard
If the firewall is running, open the Kibana port.
|
1 2 3 |
# firewall-cmd --add-port=5601/tcp --permanent # firewall-cmd --reload |
Accsess http://192.168.11.85:5601/?code=420901
When you access Kibana 9, the welcome page prompts you to configure Elastic.
First, enter the generated registration token.
Copy the Kibana token generated using the command /usr/share/elasticsearch/bin/elasticsearch-create-enrollment-token -s kibana and paste it into the box.
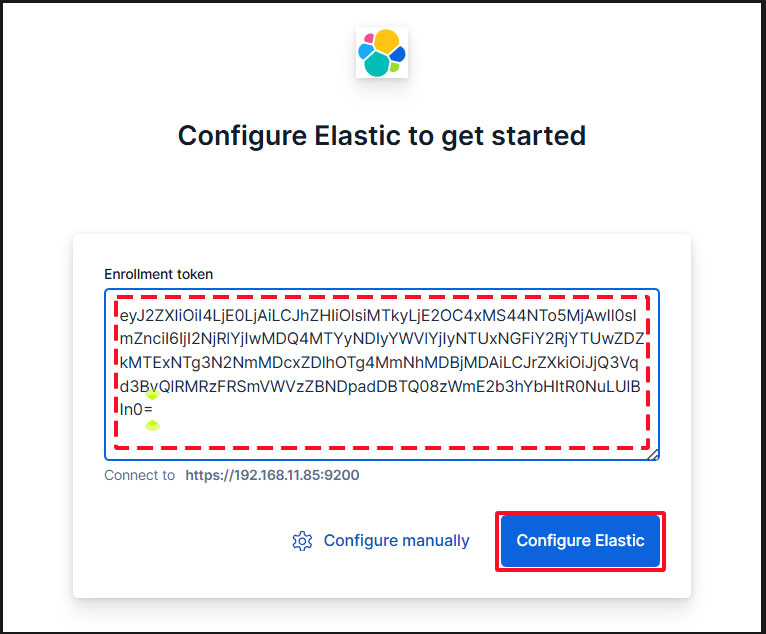
Paste the token, and Kibana will automatically connect to Elasticsearch.
Click Configure Elastic. The settings will be saved, and Elasticsearch will be configured and restarted.
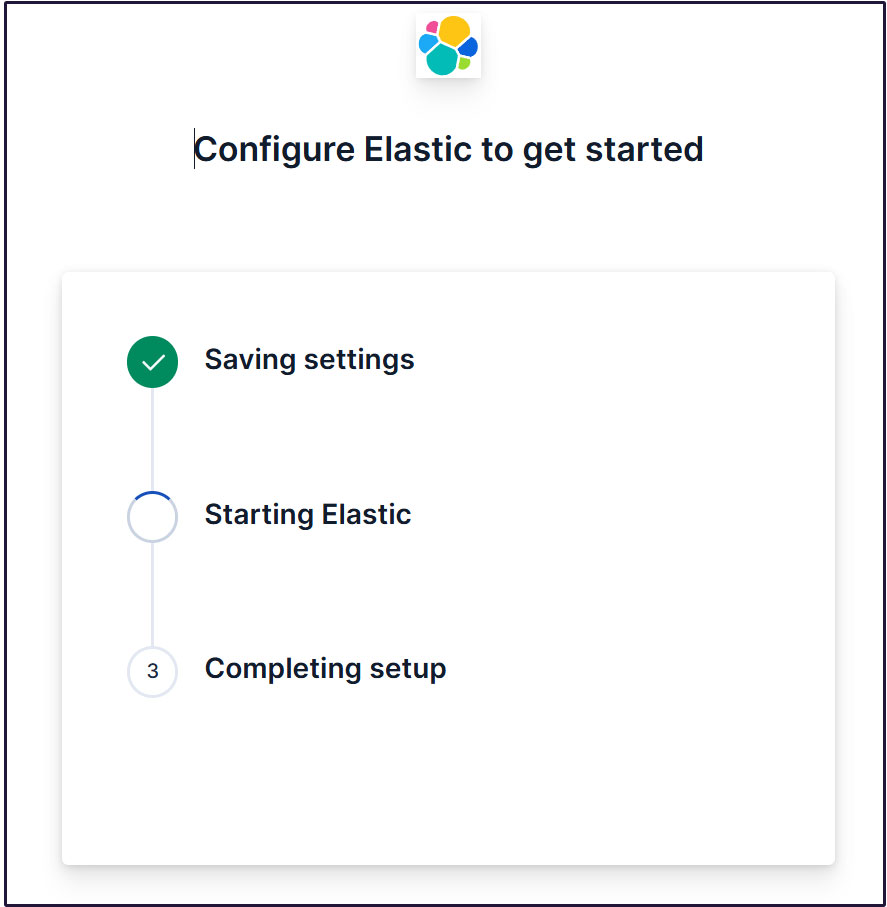
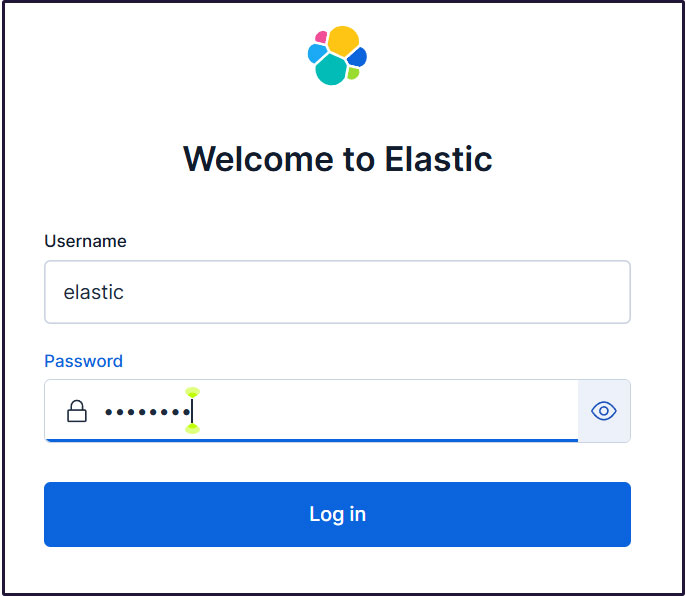
Proceed to the login page. Log in using the generated Elastic user credentials.
Username : elastic
Password : Password regenerated for clarity
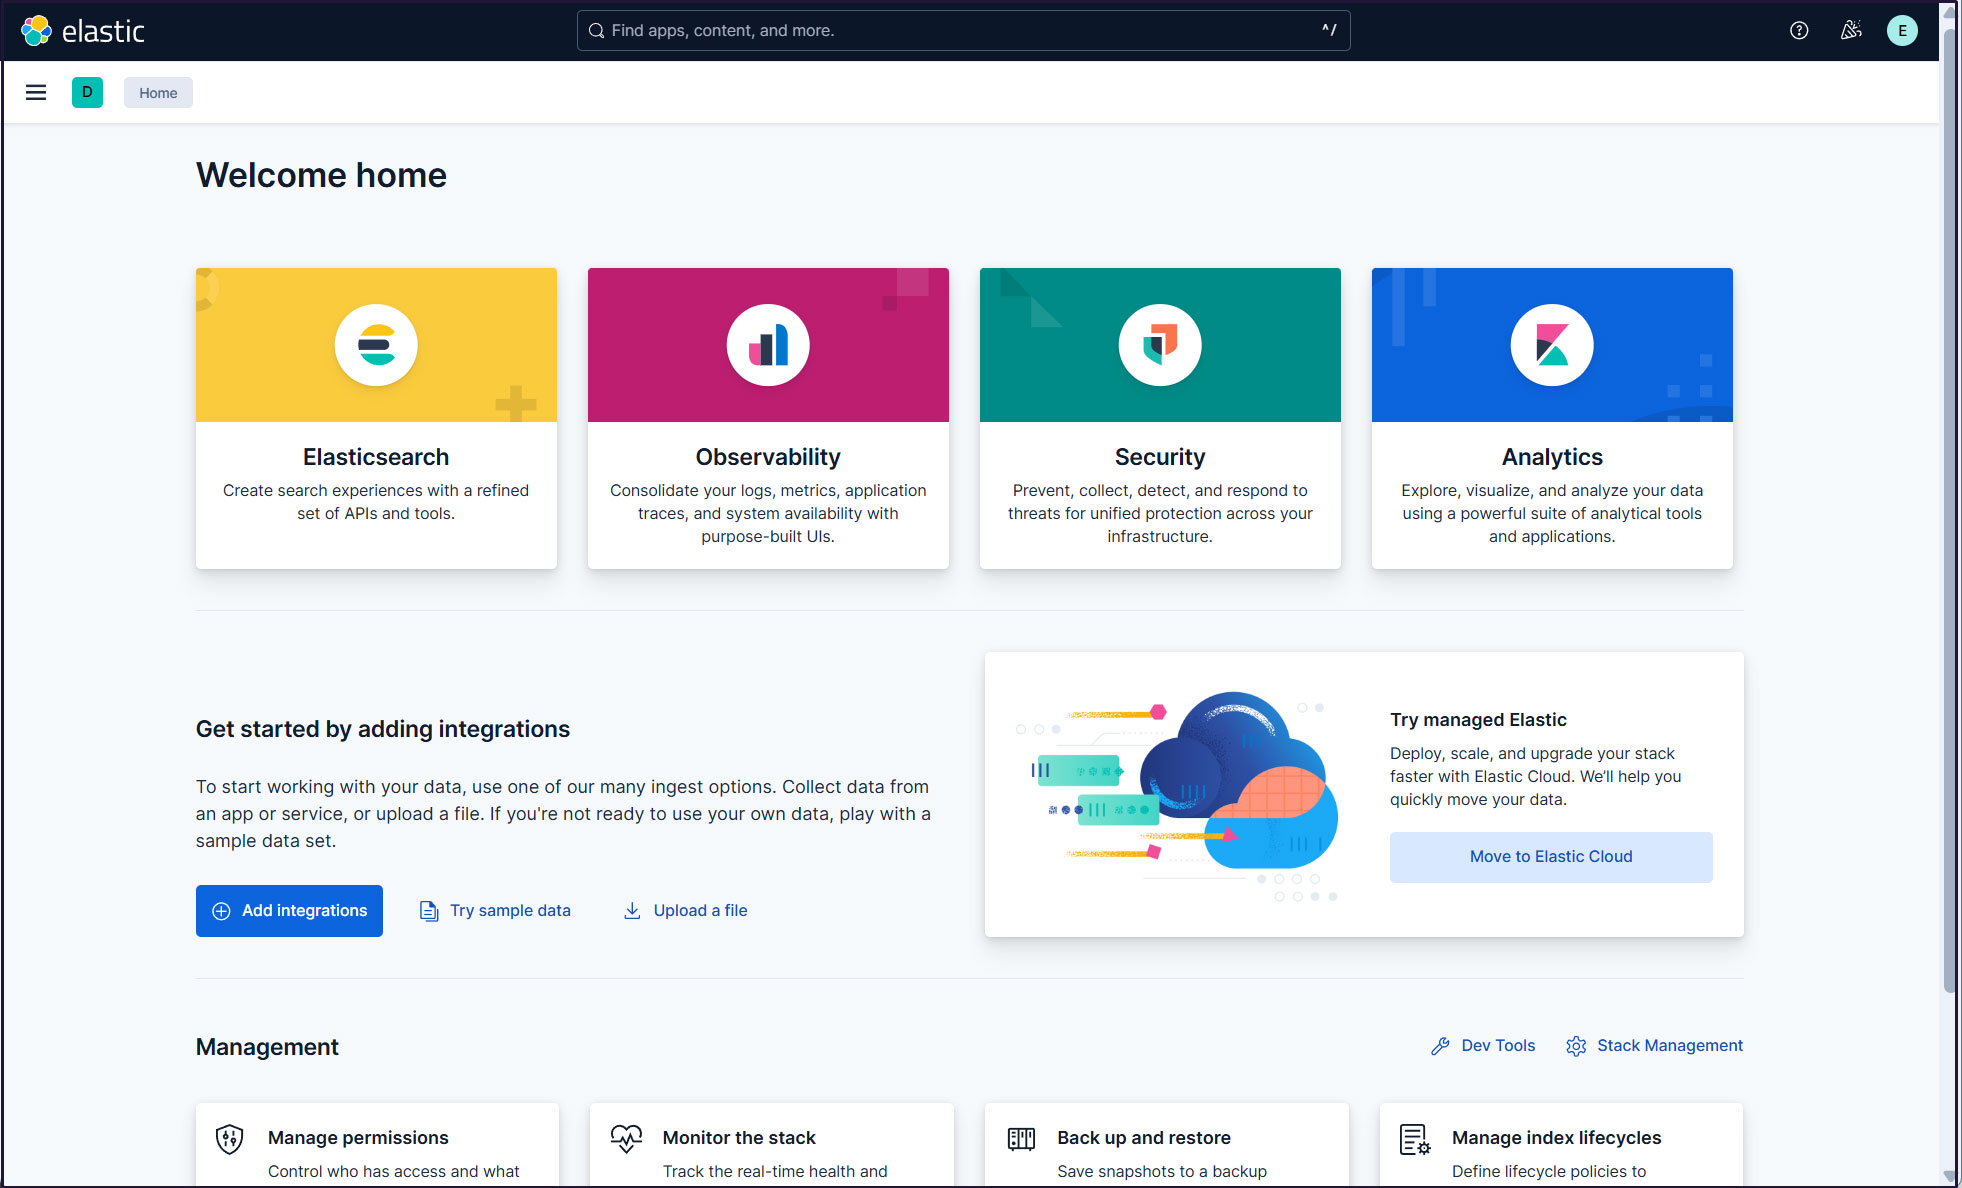
On the welcome page, click "Explore on my own" to proceed to the Kibana 9.x dashboard.

Create a new user account so that you do not need to use the elastic superuser account.
Open the main menu, then navigate to Stack Management > Security > Users
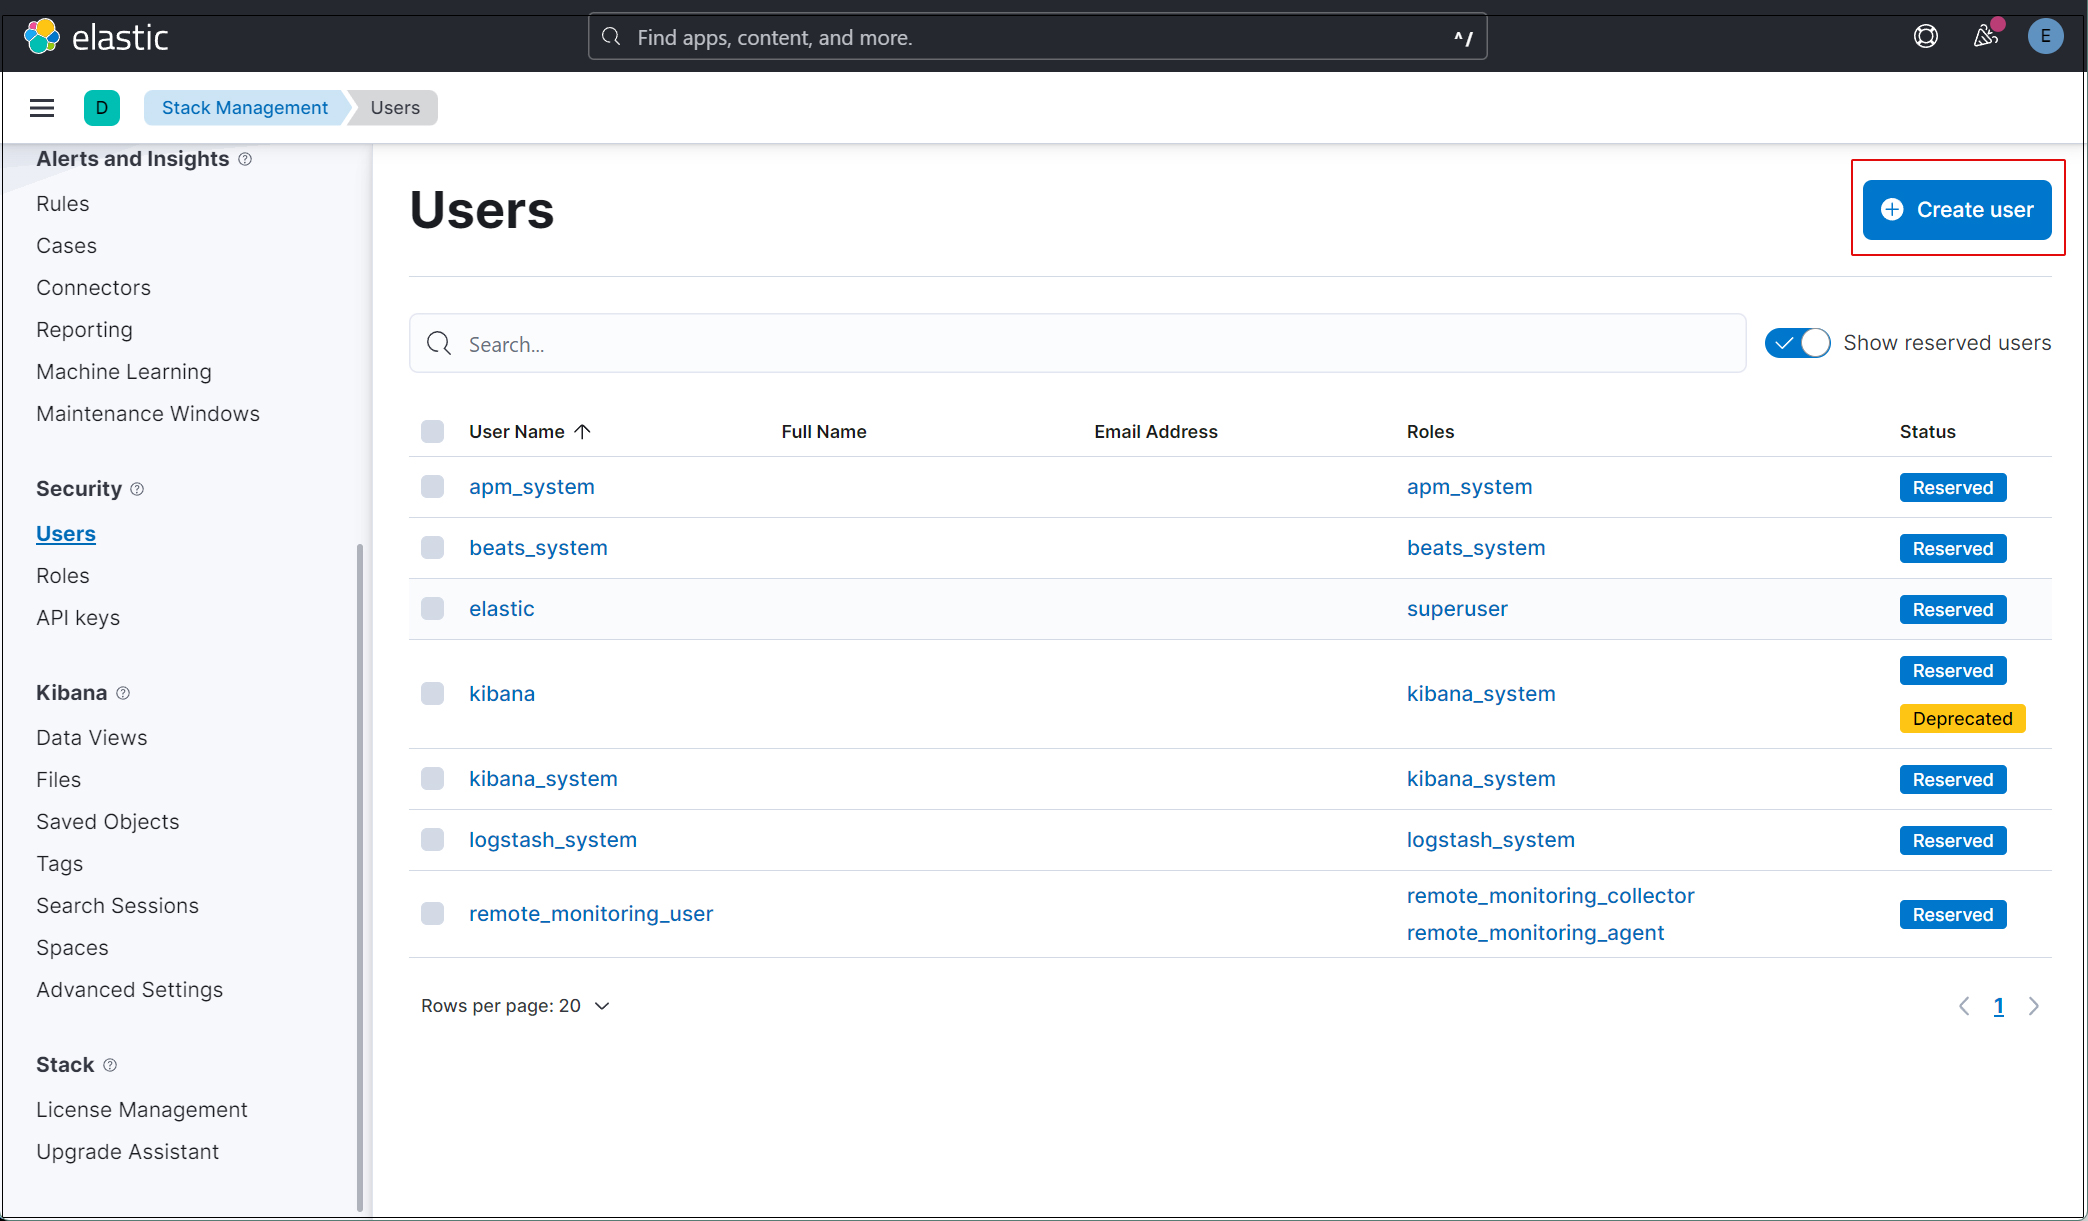
Click the "Create user" button in the upper right corner.
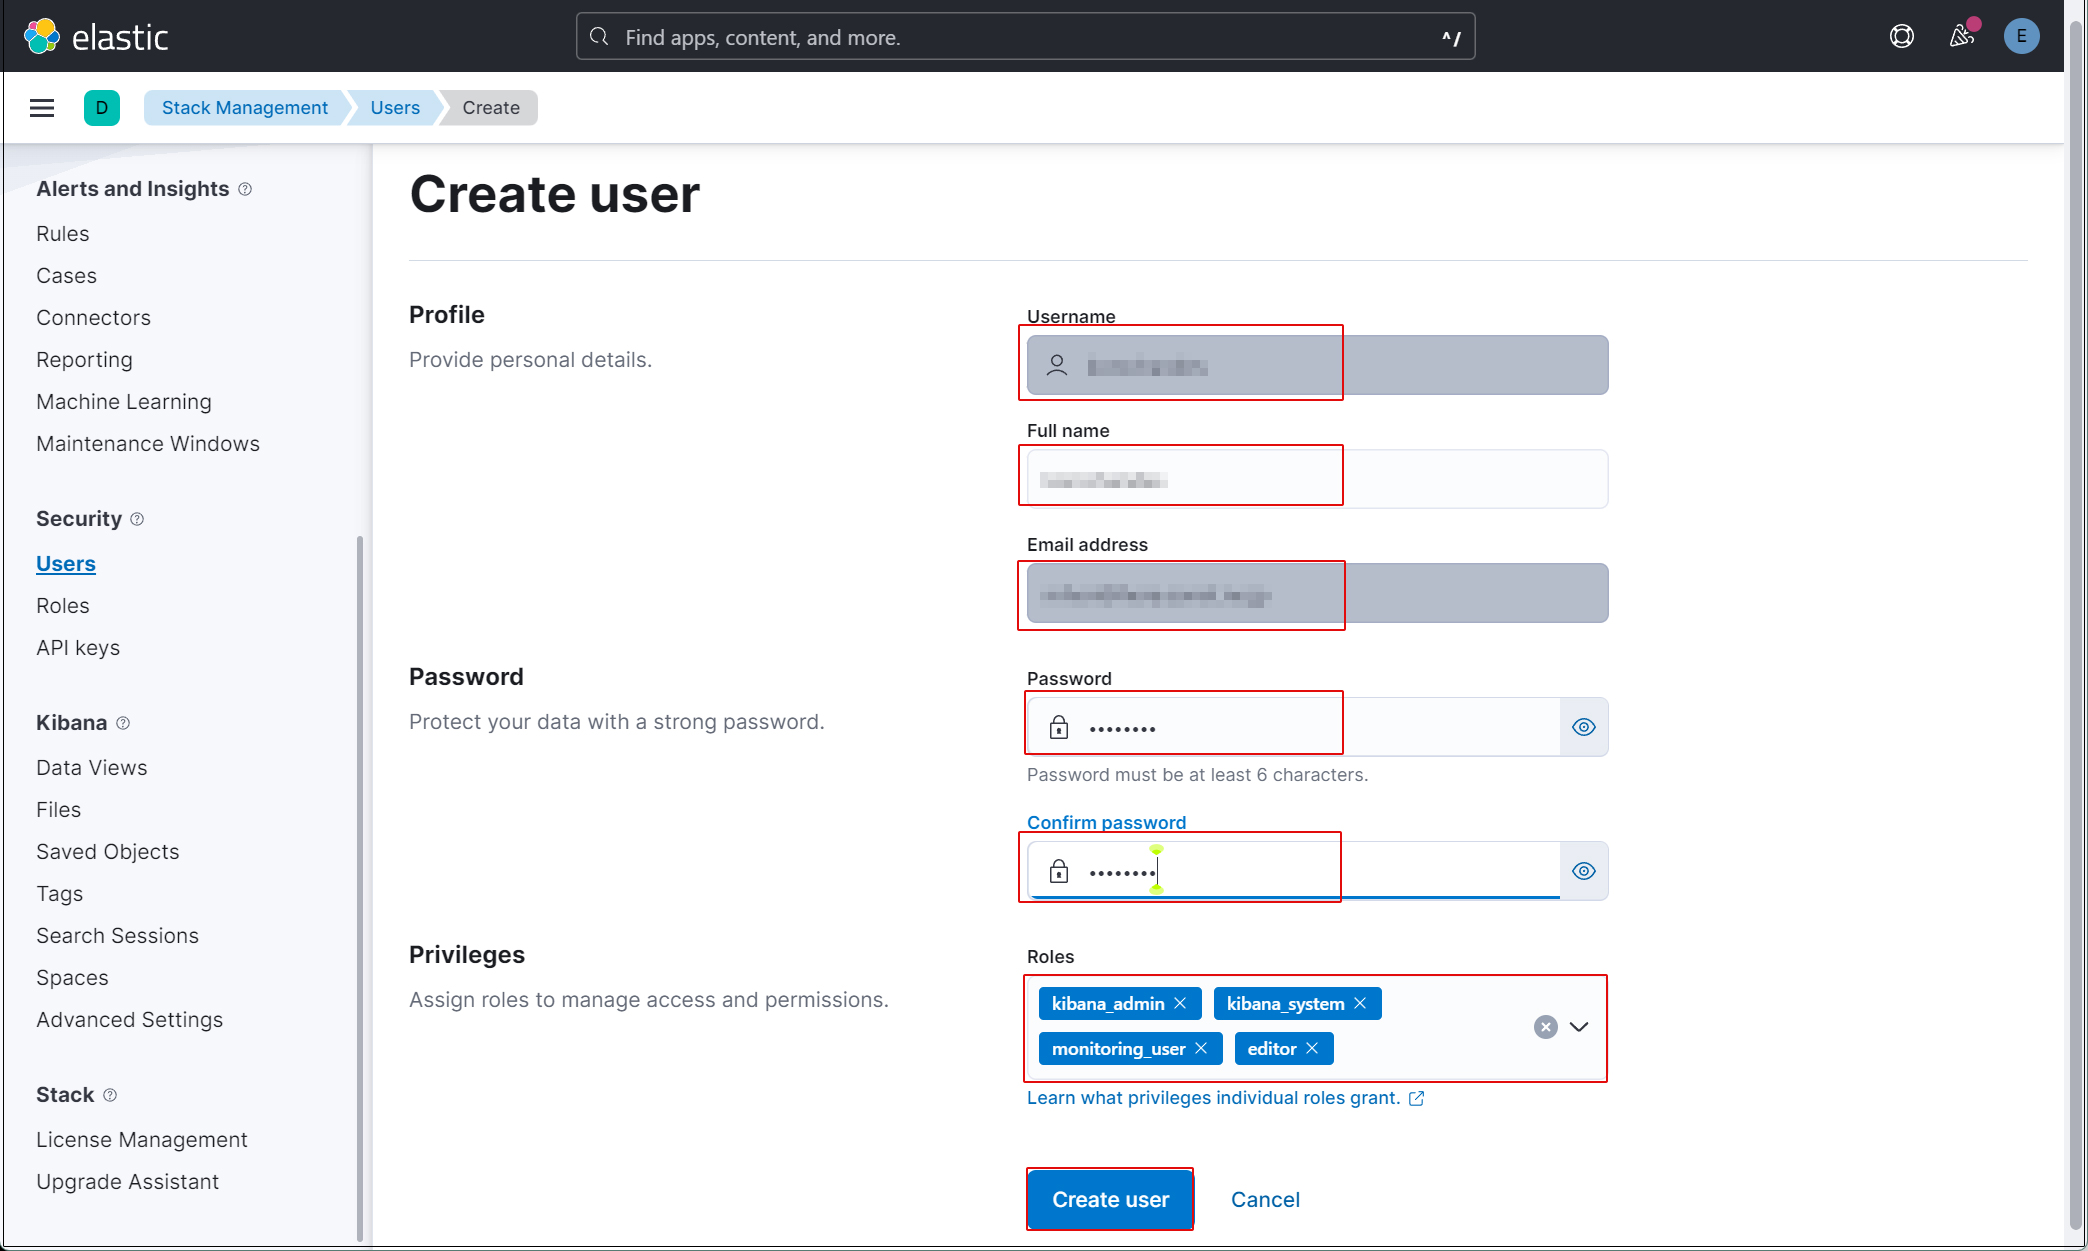
Enter new user information and assign the kibana_admin, kibana_system, monitoring_user, and editor roles under Privileges.
Finally, click [Create user].
Log out of the current profile and verify that you can log in with the newly created user account.
Currently, there is no data available to display in Kibana because Filebeat and Auditbeat are not configured on the SURICATA host.
Install Filebeat on the SURICATA server
This task will be performed on the first MiracleLinux 9.6(IP:192.168.11.83) server where Suricata has been installed.
1. Filebeat Install
1.1 Download Elasticsearch GPG Key
|
1 |
# rpm --import https://artifacts.elastic.co/GPG-KEY-elasticsearch |
1.2 Create an elasticsearch.repo file in the /etc/yum/yum.repos.d directory with the following content:
|
1 2 3 4 5 6 7 8 9 10 11 |
# vi /etc/yum.repos.d/elasticsearch.repo Describe the following content [elasticsearch] name=Elasticsearch repository for 9.x packages baseurl=https://artifacts.elastic.co/packages/9.x/yum gpgcheck=1 gpgkey=https://artifacts.elastic.co/GPG-KEY-elasticsearch enabled=0 autorefresh=1 type=rpm-md |
1.3 Filebeat Install
|
1 2 3 4 5 |
# dnf -y install --enablerepo=elasticsearch filebeat Installed: filebeat-9.5.0-1.x86_64 Complete! |
1.4 Creating an Elasticsearch CA Certificate
Download the Elasticsearch CA certificate and save it to any directory (in this case, save it as /etc/filebeat/elastic-ca.crt).
※Keep port 9200 open on the second server (the server running RockyLinux 9.7 with Elasticsearch installed).
|
1 2 3 |
# openssl s_client -connect 192.168.11.85:9200 \ -showcerts </dev/null 2>/dev/null | \ openssl x509 -outform PEM > /etc/filebeat/elastic-ca.crt |
1.5 Configure Filebeat to connect to Elasticsearch and Kibana
|
1 2 3 4 5 6 7 8 9 10 11 12 13 14 15 16 17 18 19 20 |
# vi /etc/filebeat/filebeat.yml Line 138 : Add a line specifying the private IP address and port of the Kibana instance host: "192.168.11.85:5601" Line 164 : comment out #hosts: ["localhost:9200"] Line 165 : Enter the Elasticsearch IP address and Elasticsearch port number. hosts: ["https://192.168.11.85:9200"] Line 171 : Uncomments protocol: "https" Line 172 : Elasticsearch CA Certificate Specification ssl.certificate_authorities: ["/etc/filebeat/elastic-ca.crt"] Line 175,176 : Uncomment the line, leave [username] as the default, and enter the password for the [elastic] user in [password]. username: "elastic" password: “xxxxxxxxx" |
1.6 Configuration File Test
|
1 2 |
# filebeat test config Config OK |
1.7 Enable the built-in Suricata module in Filebeats
|
1 |
# filebeat modules enable suricata |
The above command will change /etc/filebeat/modules.d/suricata.yml.disabled to /etc/filebeat/modules.d/suricata.yml, but the contents remain unchanged. Therefore, edit it as follows:
|
1 2 3 4 5 6 |
# vi /etc/filebeat/modules.d/suricata.yml Line 6-7 : Changes as follows eve: enabled: true var.paths: ["/var/log/suricata/eve.json"] |
1.8 Set up the initial environment
Load the pipeline into the Suricata service
Load the SIEM dashboard into Elasticsearch
|
1 2 3 4 5 6 7 8 9 10 |
# filebeat setup -e -------------------------------------------------------------------------------- {"log.level":"info","@timestamp":"2026-08-06T14:01:35.871+0900","log.logger":"modules","log.origin":{"function":"github.com/elastic/beats/v7/filebeat/fileset.LoadPipeline","file.name":"fileset/pipelines.go","file.line":134},"message":"Elasticsearch pipeline loaded.","service.name":"filebeat","pipeline":"filebeat-9.5.0-suricata-eve-pipeline","ecs.version":"1.6.0"} {"log.level":"info","@timestamp":"2026-08-06T14:01:35.874+0900","log.logger":"modules","log.origin":{"function":"github.com/elastic/beats/v7/filebeat/fileset.LoadPipeline","file.name":"fileset/pipelines.go","file.line":134},"message":"Elasticsearch pipeline loaded.","service.name":"filebeat","pipeline":"filebeat-9.5.0-suricata-eve-dns","ecs.version":"1.6.0"} {"log.level":"info","@timestamp":"2026-08-06T14:01:35.876+0900","log.logger":"modules","log.origin":{"function":"github.com/elastic/beats/v7/filebeat/fileset.LoadPipeline","file.name":"fileset/pipelines.go","file.line":134},"message":"Elasticsearch pipeline loaded.","service.name":"filebeat","pipeline":"filebeat-9.5.0-suricata-eve-dns-answer-v1","ecs.version":"1.6.0"} {"log.level":"info","@timestamp":"2026-08-06T14:01:35.878+0900","log.logger":"modules","log.origin":{"function":"github.com/elastic/beats/v7/filebeat/fileset.LoadPipeline","file.name":"fileset/pipelines.go","file.line":134},"message":"Elasticsearch pipeline loaded.","service.name":"filebeat","pipeline":"filebeat-9.5.0-suricata-eve-dns-answer-v2","ecs.version":"1.6.0"} {"log.level":"info","@timestamp":"2026-08-06T14:01:35.881+0900","log.logger":"modules","log.origin":{"function":"github.com/elastic/beats/v7/filebeat/fileset.LoadPipeline","file.name":"fileset/pipelines.go","file.line":134},"message":"Elasticsearch pipeline loaded.","service.name":"filebeat","pipeline":"filebeat-9.5.0-suricata-eve-tls","ecs.version":"1.6.0"} {"log.level":"info","@timestamp":"2026-08-06T14:01:35.883+0900","log.logger":"modules","log.origin":{"function":"github.com/elastic/beats/v7/filebeat/fileset.LoadPipeline","file.name":"fileset/pipelines.go","file.line":134},"message":"Elasticsearch pipeline loaded.","service.name":"filebeat","pipeline":"filebeat-9.5.0-suricata-eve-http","ecs.version":"1.6.0"} ------------------------------------------------------------------------------------- |
1.9 Start the Filebeat service
|
1 |
# systemctl start filebeat.service |
2. Check in Kibana
Log back into Kibana using the user you created. Accsses http://192.168.11.85:5601
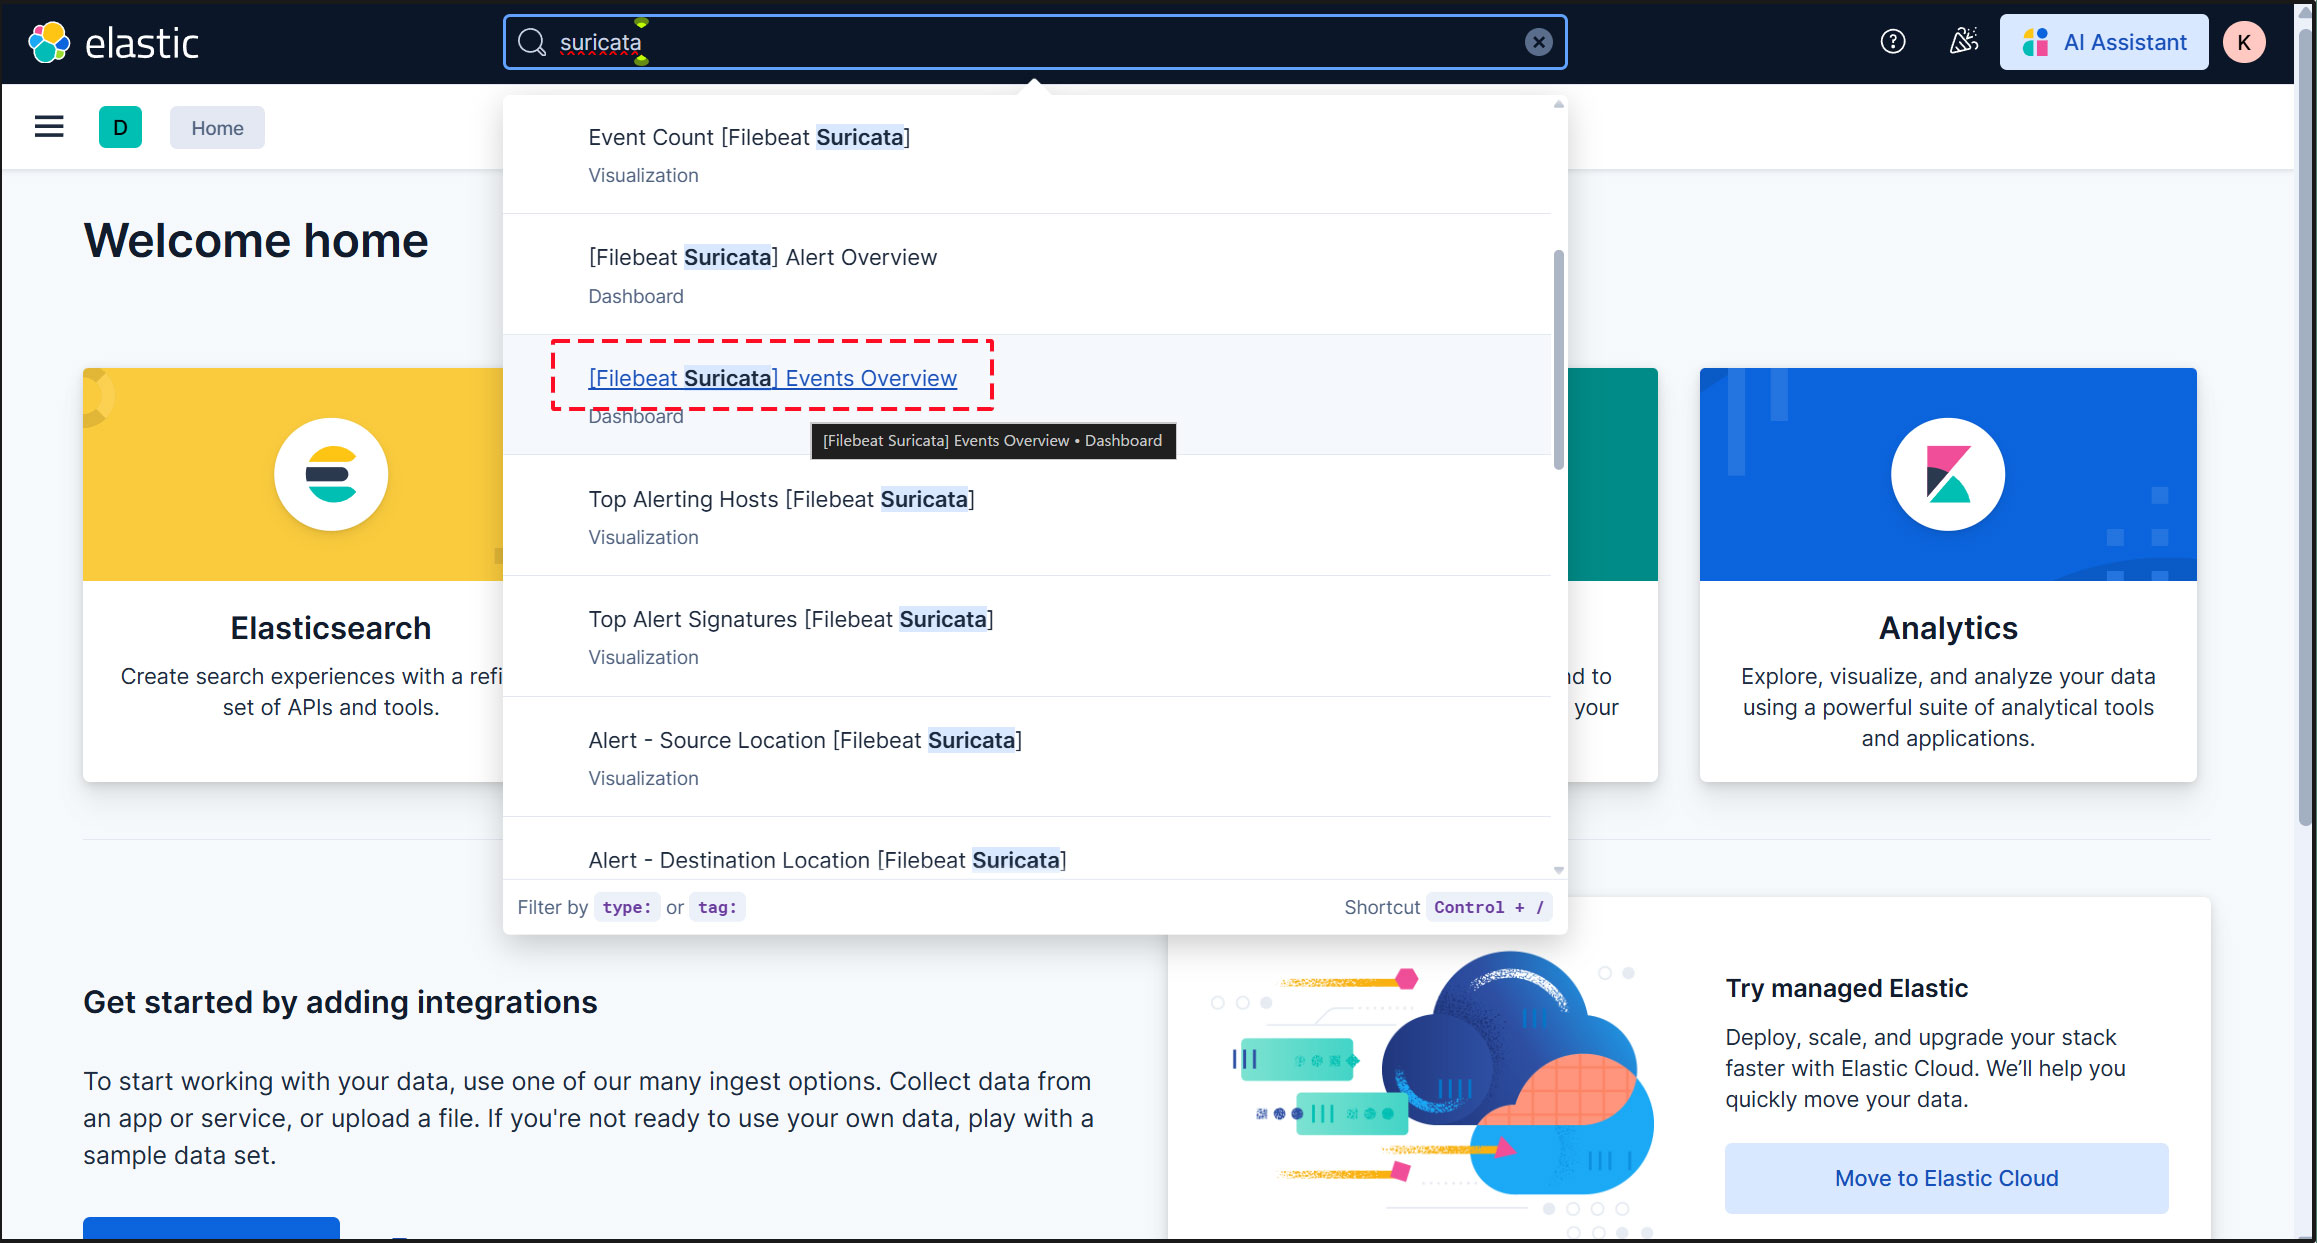
Type "Suricata Events Overview" into the top search field, then click [Filebeat Suricata] Events Overview.
All Suricata events from the past 15 minutes are displayed.
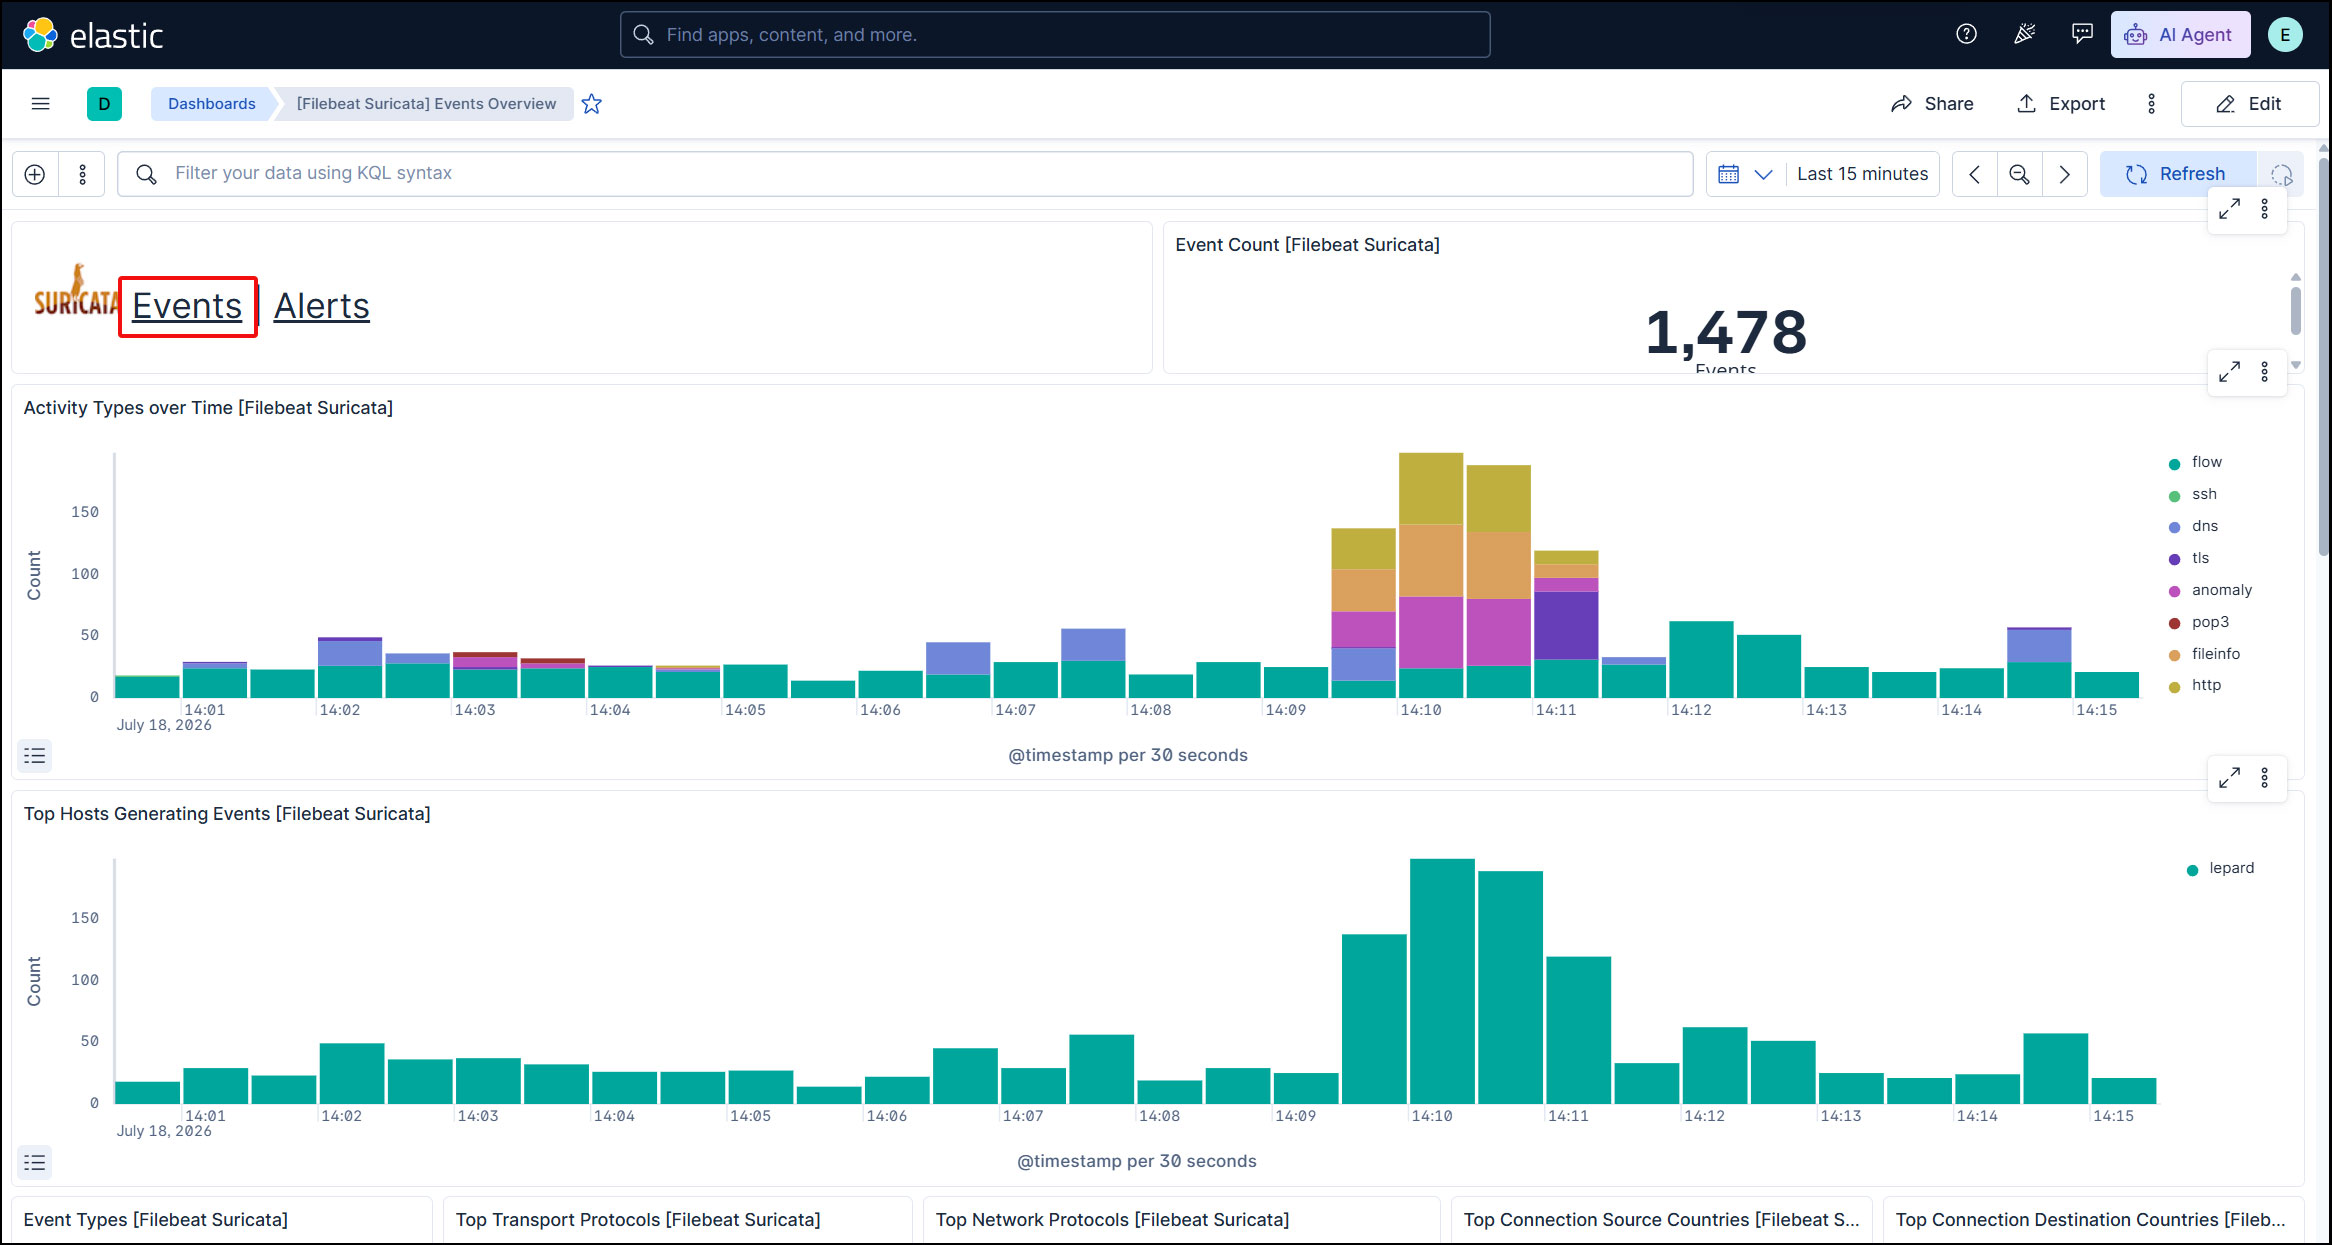
To display alerts for malicious traffic, click the "Alerts" text next to the Suricata logo.
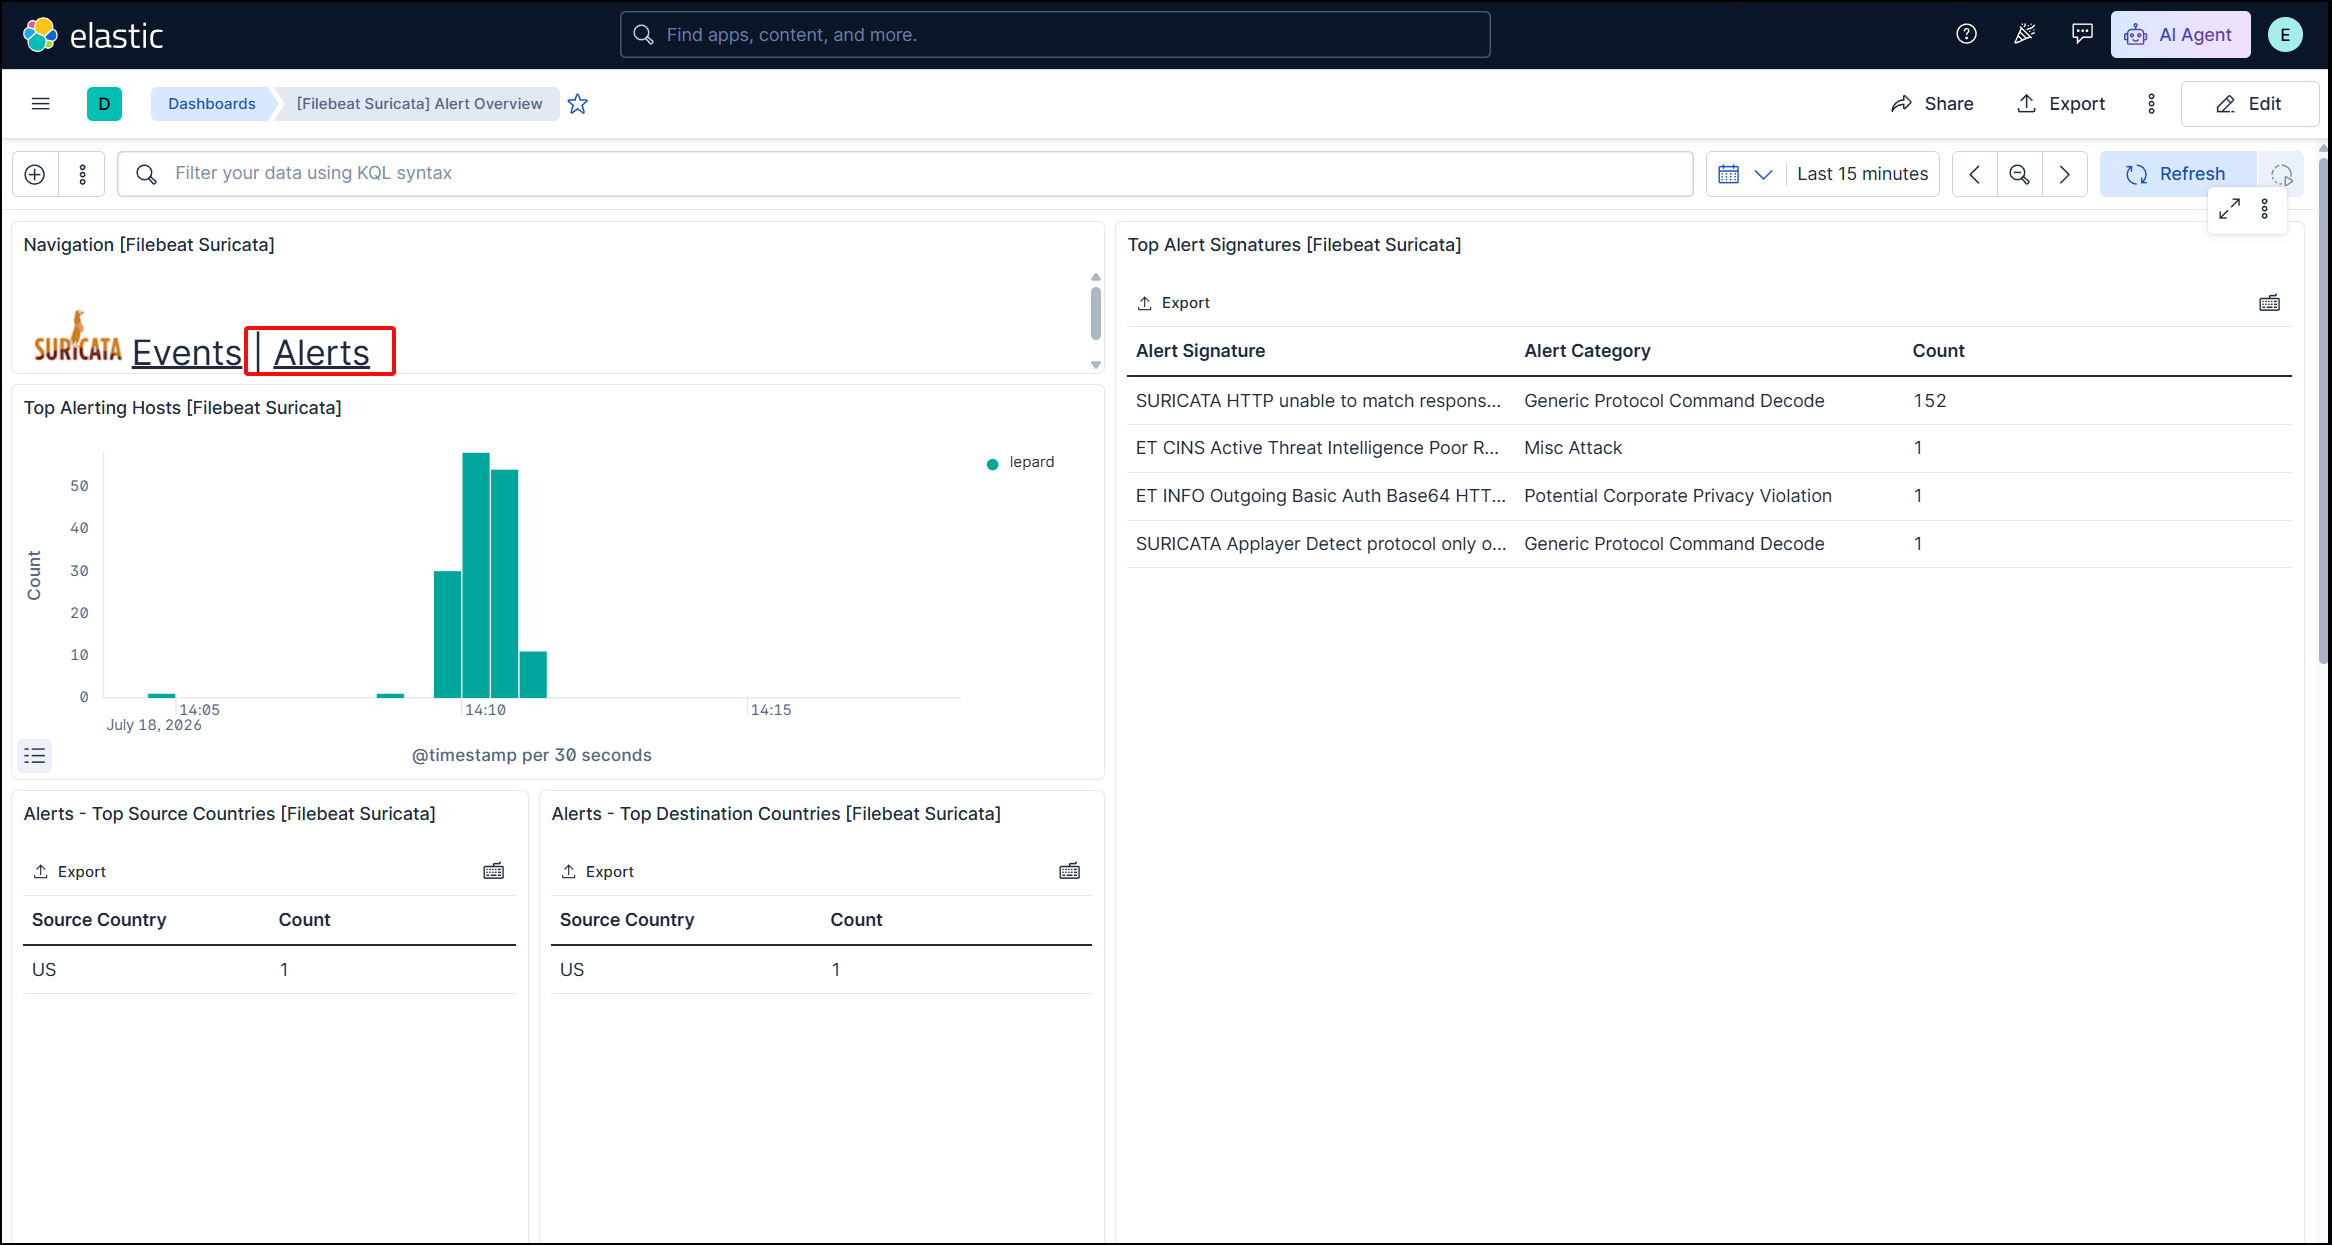
Kibana offers a variety of features and tools for visualizing logs, so feel free to experiment with them.