Open-source integrated monitoring software "Zabbix7"
Zabbix is open-source integrated monitoring software for centralized monitoring of servers, networks, and applications. It provides the monitoring, fault detection, and notification functions necessary for integrated monitoring. With Zabbix agents supporting numerous platforms and SNMP compatibility, it enables monitoring of entire systems using just Zabbix.
To run Zabbix, you need the PHP programming language, a MySQL/MariaDB database server, and a web server such as Apache or Nginx.
This guide assumes all of the following conditions are already configured.
FreeBSD15.1 IP(192.168.11.83)
Apache/2.4.68 (FreeBSD)
mysql Ver 8.4.10 for FreeBSD15.0 on amd64 (Source distribution)
PHP 8.3.31 (cli)
PHP 8.3.31 (fpm-fcgi)

Zabbix 7 Server、Frontend、Agent Install
# pkg search zabbix

py312-pyzabbix-1.3.1_1         Zabbix API Python Library
zabbix6-agent-6.0.47           Enterprise-class open source distributed monitoring (agent)
zabbix6-frontend-php82-6.0.47  Enterprise-class open source distributed monitoring (frontend-php82)
zabbix6-frontend-php83-6.0.47  Enterprise-class open source distributed monitoring (frontend-php83)
zabbix6-frontend-php84-6.0.47  Enterprise-class open source distributed monitoring (frontend-php84)
zabbix6-frontend-php85-6.0.47  Enterprise-class open source distributed monitoring (frontend-php85)
zabbix6-frontend-php86-6.0.47  Enterprise-class open source distributed monitoring (frontend-php86)
zabbix6-java-6.0.47            Enterprise-class open source distributed monitoring (java)
zabbix6-proxy-6.0.47           Enterprise-class open source distributed monitoring (proxy)
zabbix6-server-6.0.47          Enterprise-class open source distributed monitoring (server)
zabbix7-agent-7.0.28           Enterprise-class open source distributed monitoring (agent)
zabbix7-frontend-php82-7.0.28  Enterprise-class open source distributed monitoring (frontend-php82)
zabbix7-frontend-php83-7.0.28  Enterprise-class open source distributed monitoring (frontend-php83)
zabbix7-frontend-php84-7.0.28  Enterprise-class open source distributed monitoring (frontend-php84)
zabbix7-frontend-php85-7.0.28  Enterprise-class open source distributed monitoring (frontend-php85)
zabbix7-frontend-php86-7.0.28  Enterprise-class open source distributed monitoring (frontend-php86)
zabbix7-java-7.0.28            Enterprise-class open source distributed monitoring (java)
zabbix7-proxy-7.0.28           Enterprise-class open source distributed monitoring (proxy)
zabbix7-server-7.0.28          Enterprise-class open source distributed monitoring (server)
zabbix74-agent-7.4.11          Enterprise-class open source distributed monitoring (agent)
zabbix74-frontend-php82-7.4.11 Enterprise-class open source distributed monitoring (frontend-php82)
zabbix74-frontend-php83-7.4.11 Enterprise-class open source distributed monitoring (frontend-php83)
zabbix74-frontend-php84-7.4.11 Enterprise-class open source distributed monitoring (frontend-php84)
zabbix74-frontend-php85-7.4.11 Enterprise-class open source distributed monitoring (frontend-php85)
zabbix74-frontend-php86-7.4.11 Enterprise-class open source distributed monitoring (frontend-php86)
zabbix74-java-7.4.11           Enterprise-class open source distributed monitoring (java)
zabbix74-proxy-7.4.11          Enterprise-class open source distributed monitoring (proxy)
zabbix74-server-7.4.11         Enterprise-class open source distributed monitoring (server)
In this guide, we will install Zabbix 7.4.11 and its related extensions.
# pkg install -y zabbix74-server zabbix74-frontend-php83 zabbix74-agent php83-mysqli php83-mbstring php83-gd php83-bcmath php83-curl
Create a database and user for Zabbix
1.Creating and Initializing the Zabbix Database
database my_zabbix_db
user zabbix_user
password ?WWabcd123
# mysql -u root -p
Password:
>CREATE DATABASE my_zabbix_db;
>CREATE USER 'zabbix_user'@'localhost' IDENTIFIED BY '?WWabcd123';
>GRANT ALL PRIVILEGES ON my_zabbix_db.* TO 'zabbix_user'@'localhost';
>set global log_bin_trust_function_creators = 1;
>exit;
Initialization
# cd /usr/local/share/zabbix74/server/database/mysql
# mysql -uzabbix_user -p?WWabcd123 my_zabbix_db < schema.sql
# mysql -uzabbix_user -p?WWabcd123 my_zabbix_db < images.sql
# mysql -uzabbix_user -p?WWabcd123 my_zabbix_db < data.sql
After importing the database schema, disable the log_bin_trust_function_creators option.
# mysql -uroot -p
password
mysql> set global log_bin_trust_function_creators = 0;
mysql> exit;
Update Zabbix Configuration
Edit the Zabbix server configuration file /etc/zabbix/zabbix_server.conf to update the database settings so the Zabbix server can connect to the database.
# vi /usr/local/etc/zabbix74/zabbix_server.conf

Line 94 : Change
DBName=my_zabbix_db
Line 110 : Change
DBUser=zabbix_user
Line 118 : Uncomment and add a note
DBPassword=?WWabcd123
Auto-Start Settings
# vi /etc/rc.conf

Add the following
zabbix_server_enable="yes"
Startup
# /usr/local/etc/rc.d/zabbix_server start
Monitor the Zabbix server itself Configuring Zabbix Agentd
# vi /usr/local/etc/zabbix74/zabbix_agentd.conf

Line 113: Specify the Zabbix server
Server=127.0.0.1
Line 169: Specify the Zabbix server
ServerActive=127.0.0.1
Line 178: Change to your own hostname
Hostname=Lepard
Auto-Start Settings
# vi /etc/rc.conf

Add the following
zabbix_agentd_enable="YES"
Startup
# /usr/local/etc/rc.d/zabbix_agentd start
Zabbix Frontend Configuration
Configuring the Apache HTTP Server for the Zabbix Frontend
# vi /usr/local/etc/apache24/httpd.conf

Add the following at the end
<FilesMatch "\.php$">
    SetHandler application/x-httpd-php
</FilesMatch>
<FilesMatch "\.phps$">
    SetHandler application/x-httpd-php-source
</FilesMatch>
<Directory "/usr/local/www/zabbix74">
    Options Indexes FollowSymLinks
    AllowOverride None
    Require all granted
</Directory>

DocumentRoot "/usr/local/www/zabbix74"
DirectoryIndex index.html index.php
PHP Configuration
# vi /usr/local/etc/php-fpm.d/www.conf

Add to the last line
php_value[max_execution_time] = 300
php_value[memory_limit] = 128M
php_value[post_max_size] = 16M
php_value[upload_max_filesize] = 2M
php_value[max_input_time] = 300
php_value[max_input_vars] = 10000
php_value[always_populate_raw_post_data] = -1
php_value[date.timezone] = Asia/Tokyo
Restart Apache
# /usr/local/etc/rc.d/apache24 restart
Running the Zabbix Web Installer
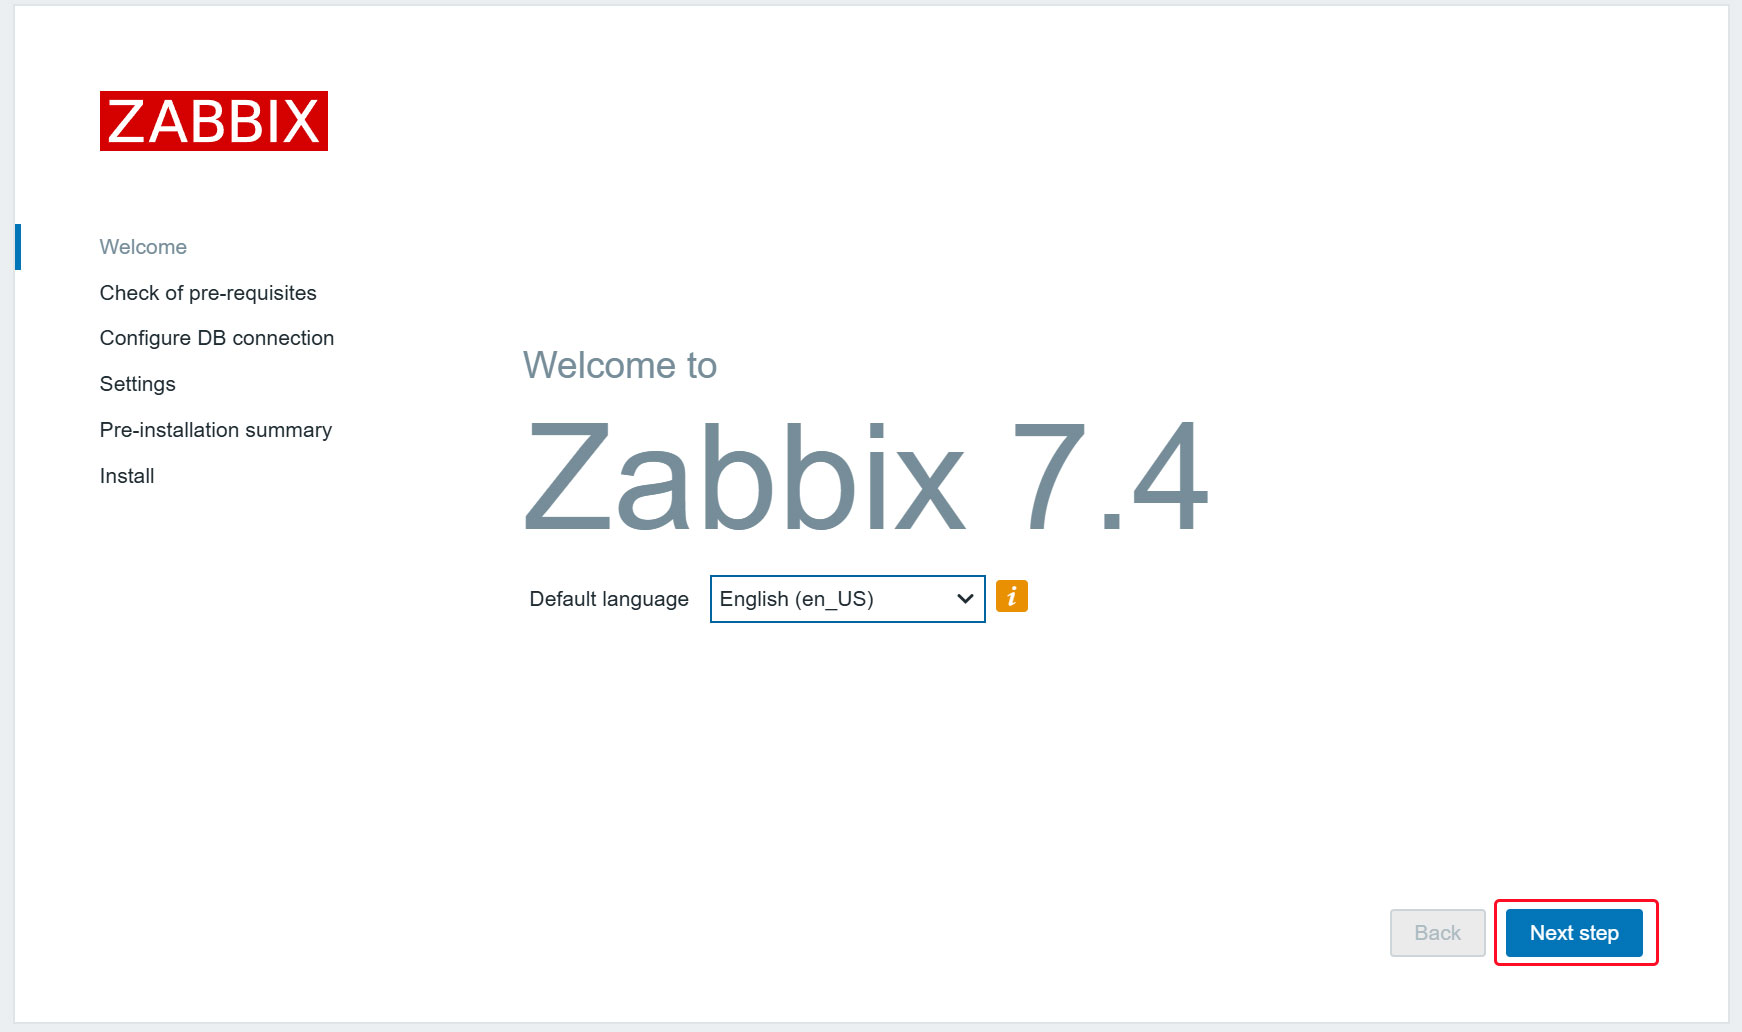
Open your web browser and enter "http://[your-server-IP_Address]/zabbix".
The following screen will appear. Click [Next step].
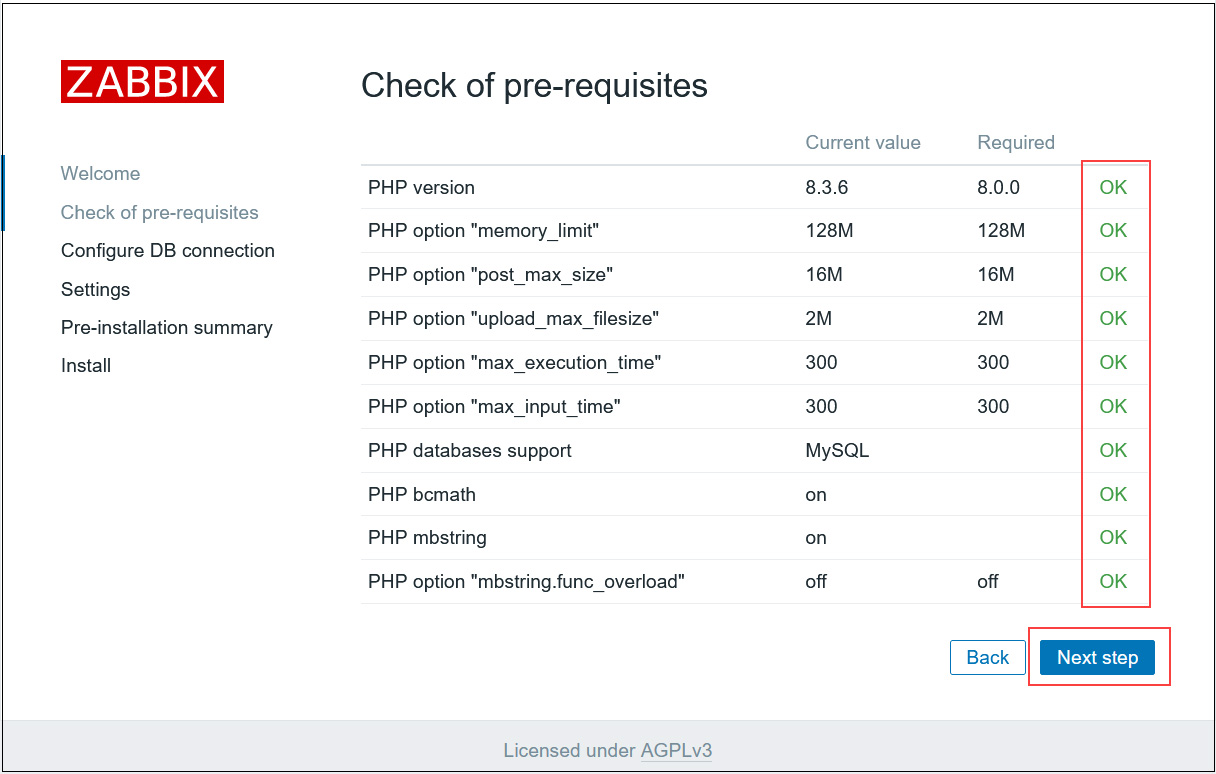
After confirming that all requirements are OK, click [Next step].
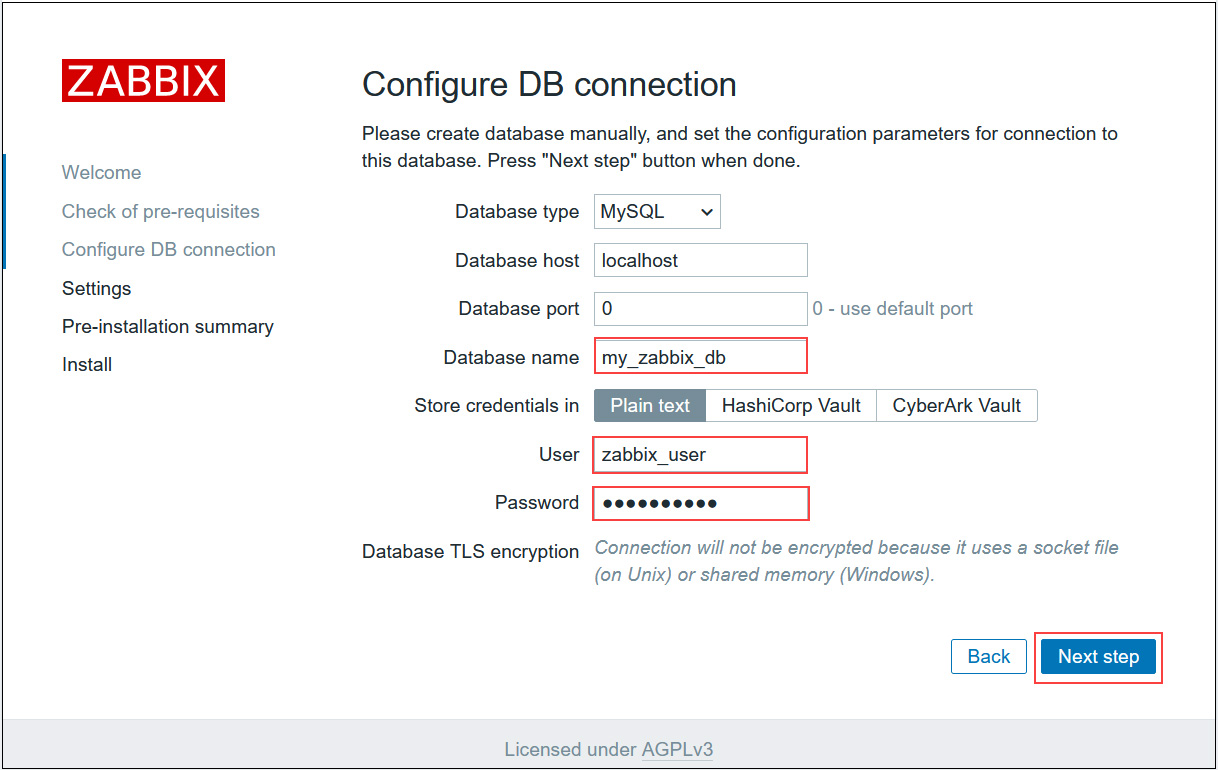
Enter the configured information in the "Database name", "User", and "Password" fields, then click [Next step].
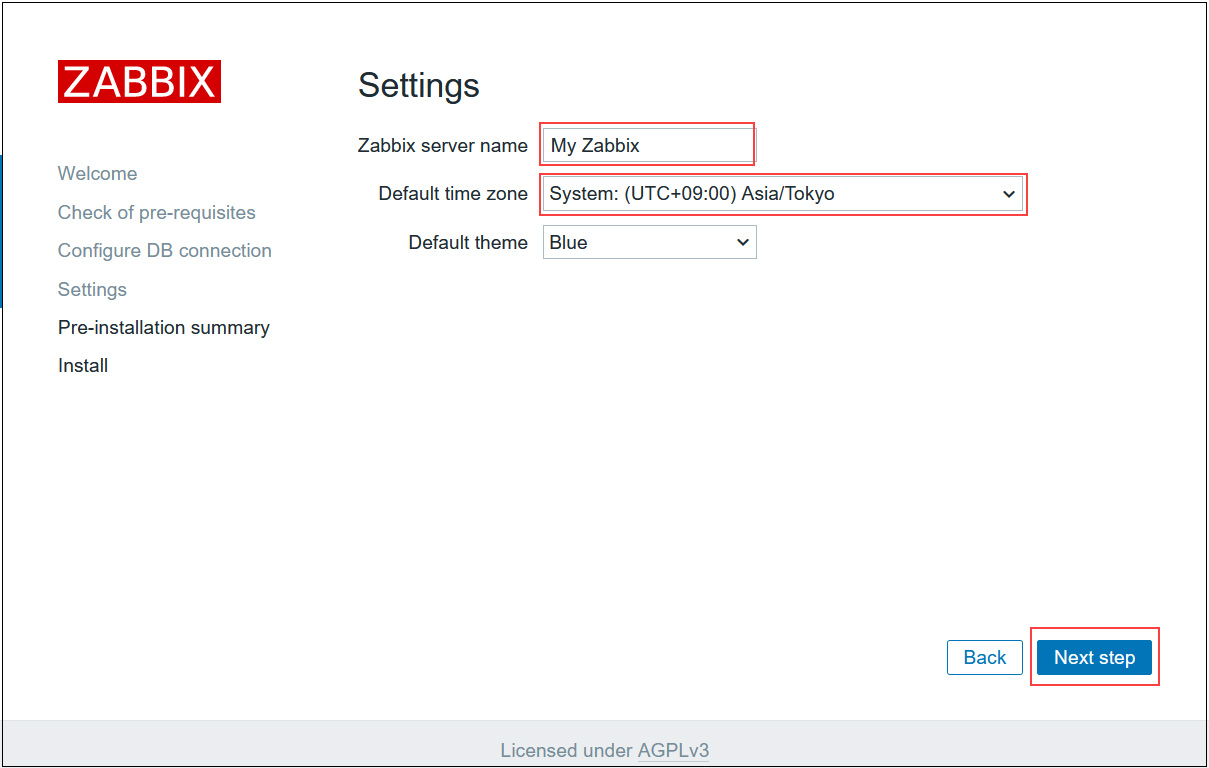
Enter any name for "Zabbix server names" and select Asia/Tokyo for the time zone.
After confirming it matches your time zone, click [Next step].
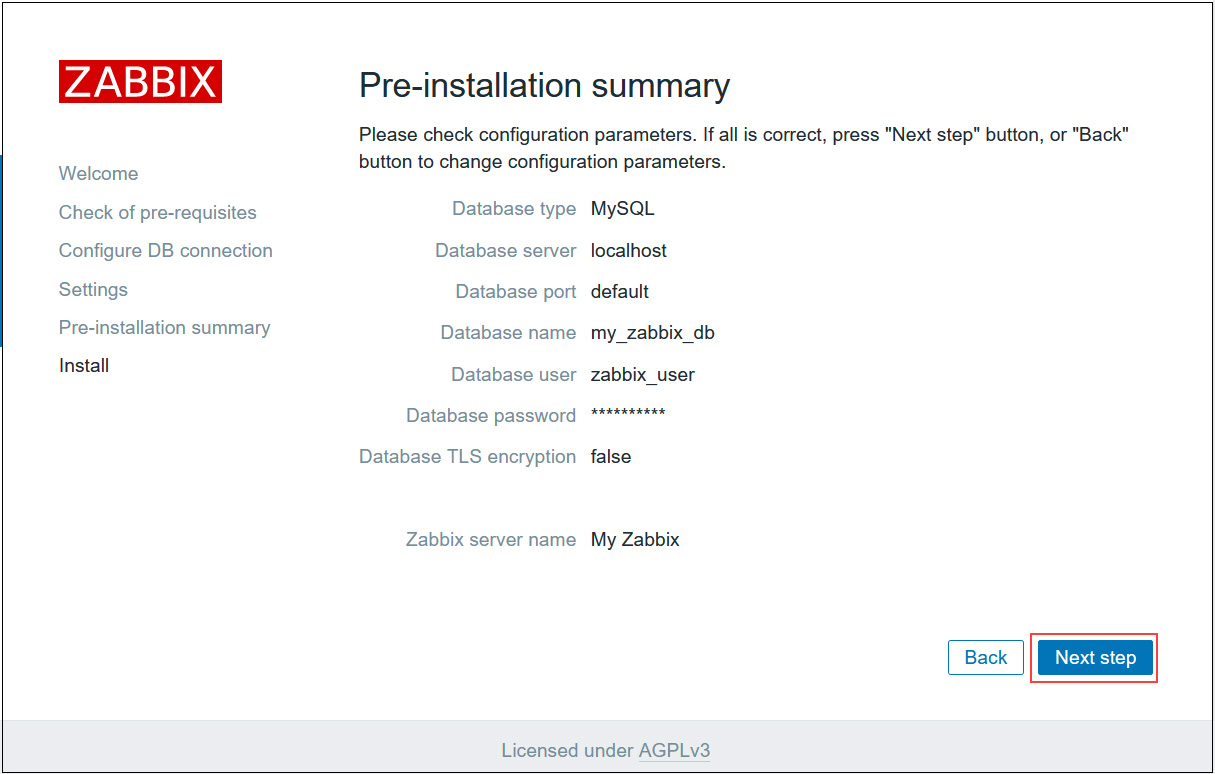
Confirm settings. If the information is correct, click [Next step].
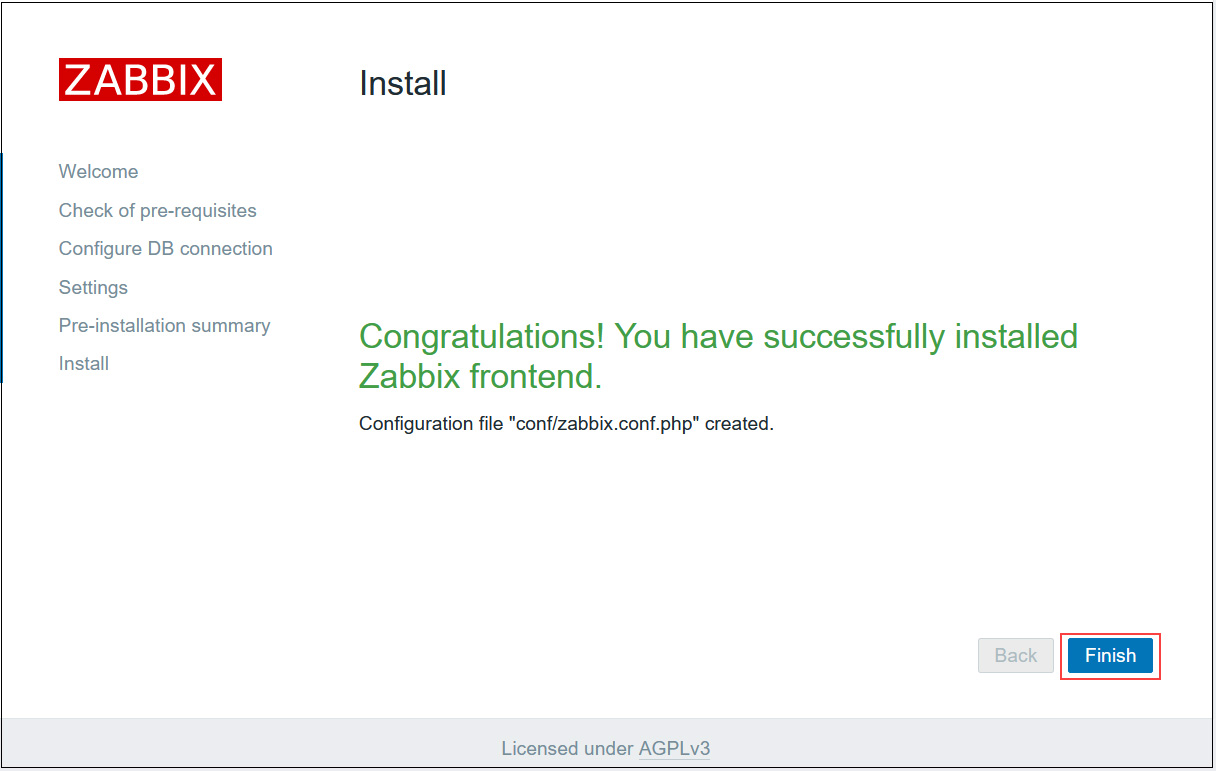
Once the installation completes successfully, the following page will appear. Click "Finish".
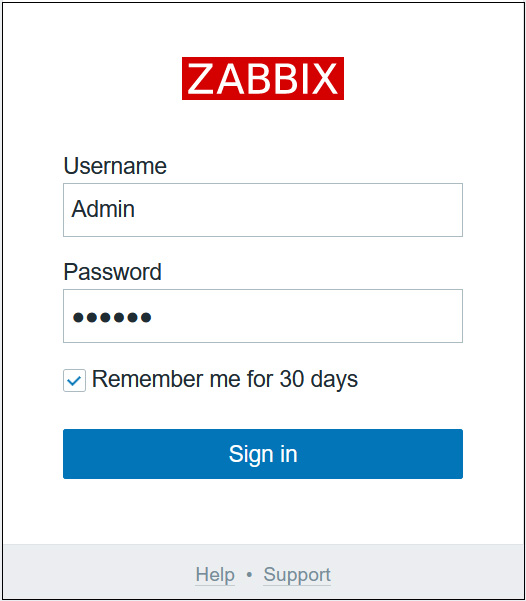
You will be redirected to the Zabbix login page.
Sign in using the following default credentials.
Username:Admin
Password:zabbix
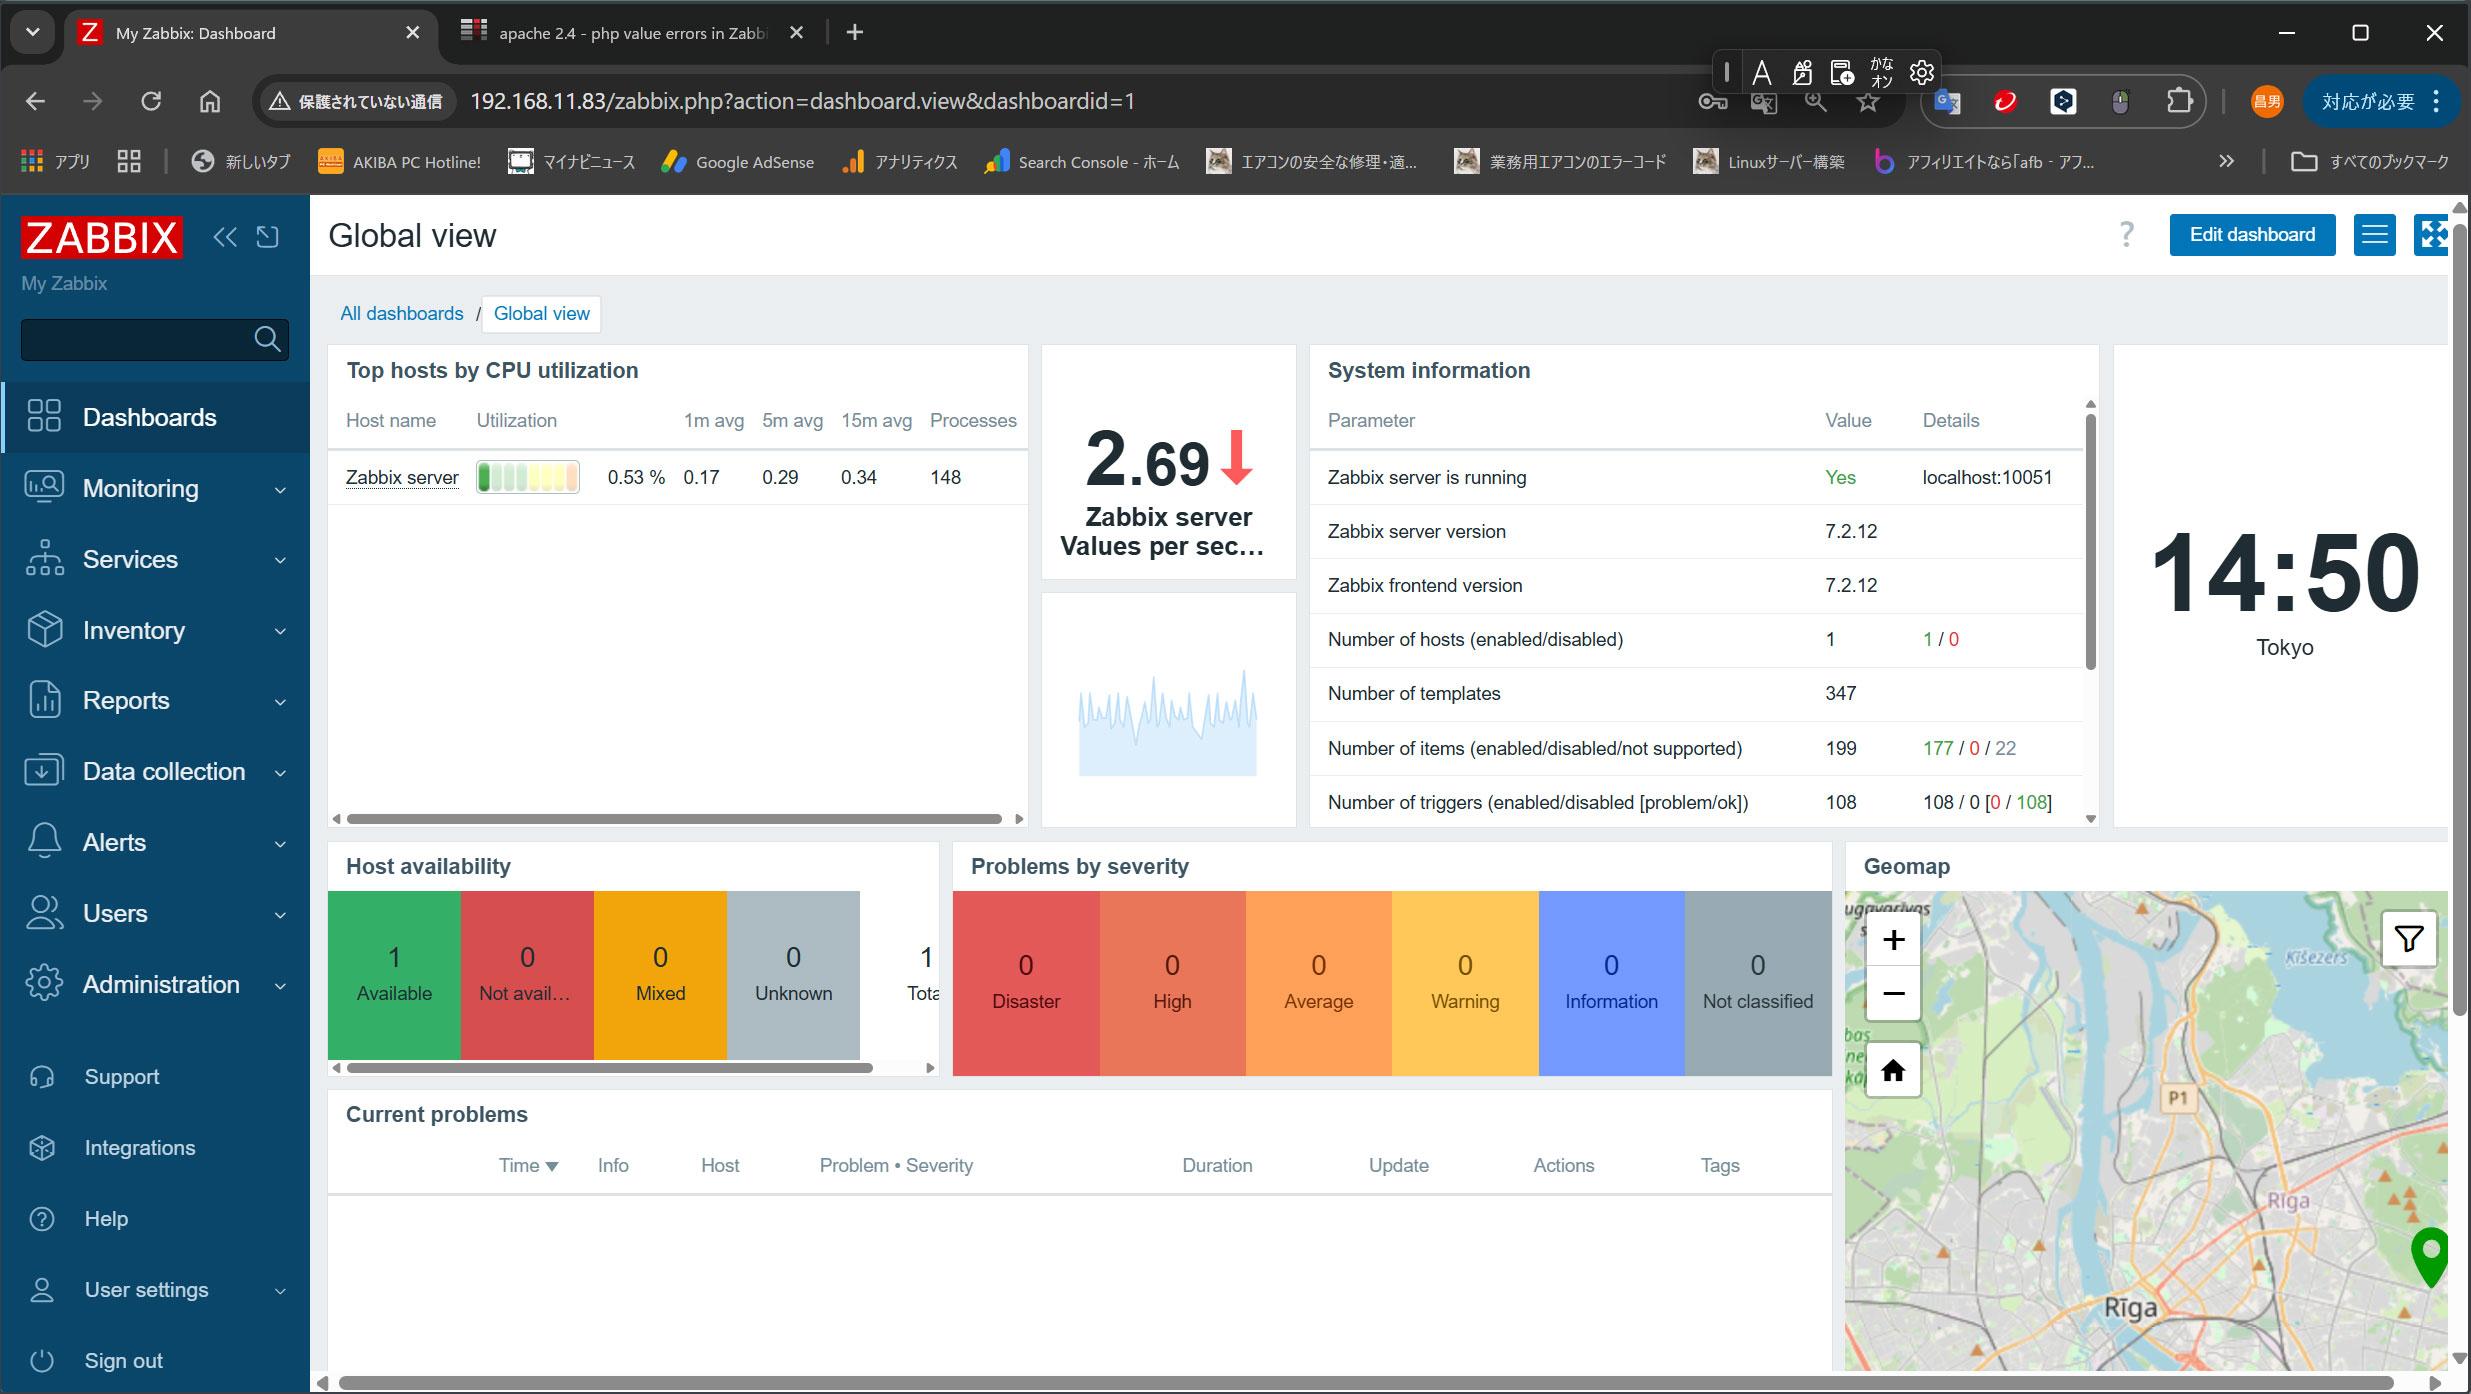
After successful login, the next screen (Zabbix Dashboard) will appear.
Various Zabbix Settings
Administrator Password Change
For security reasons, change the default administrator password.
Once the above dashboard appears, proceed to
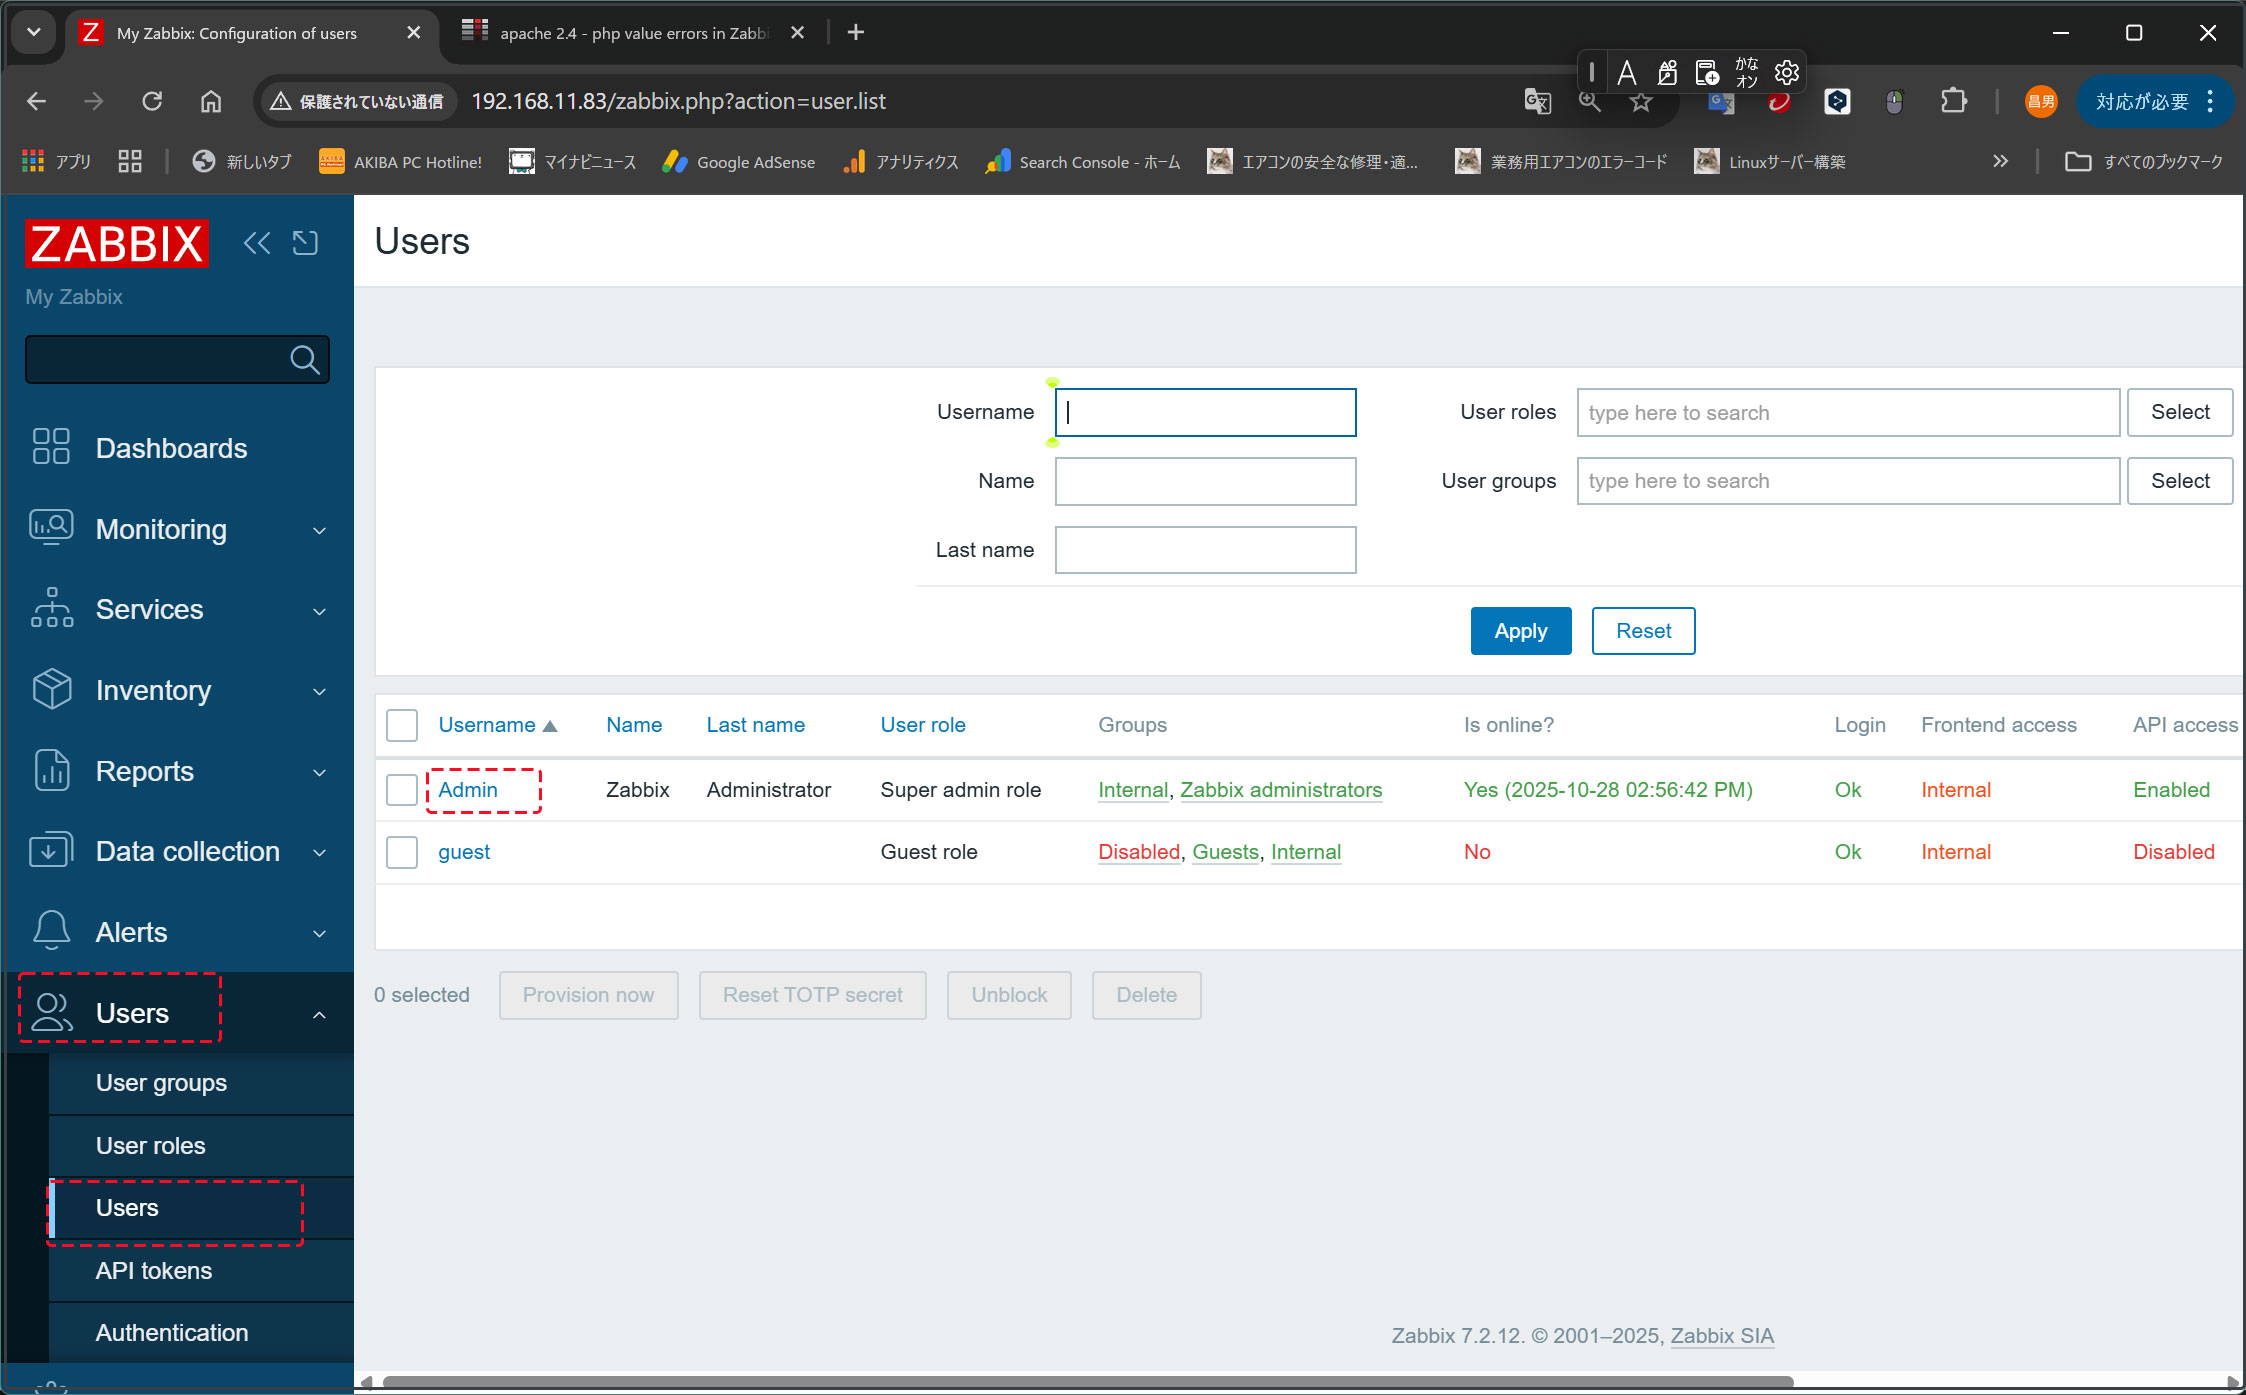
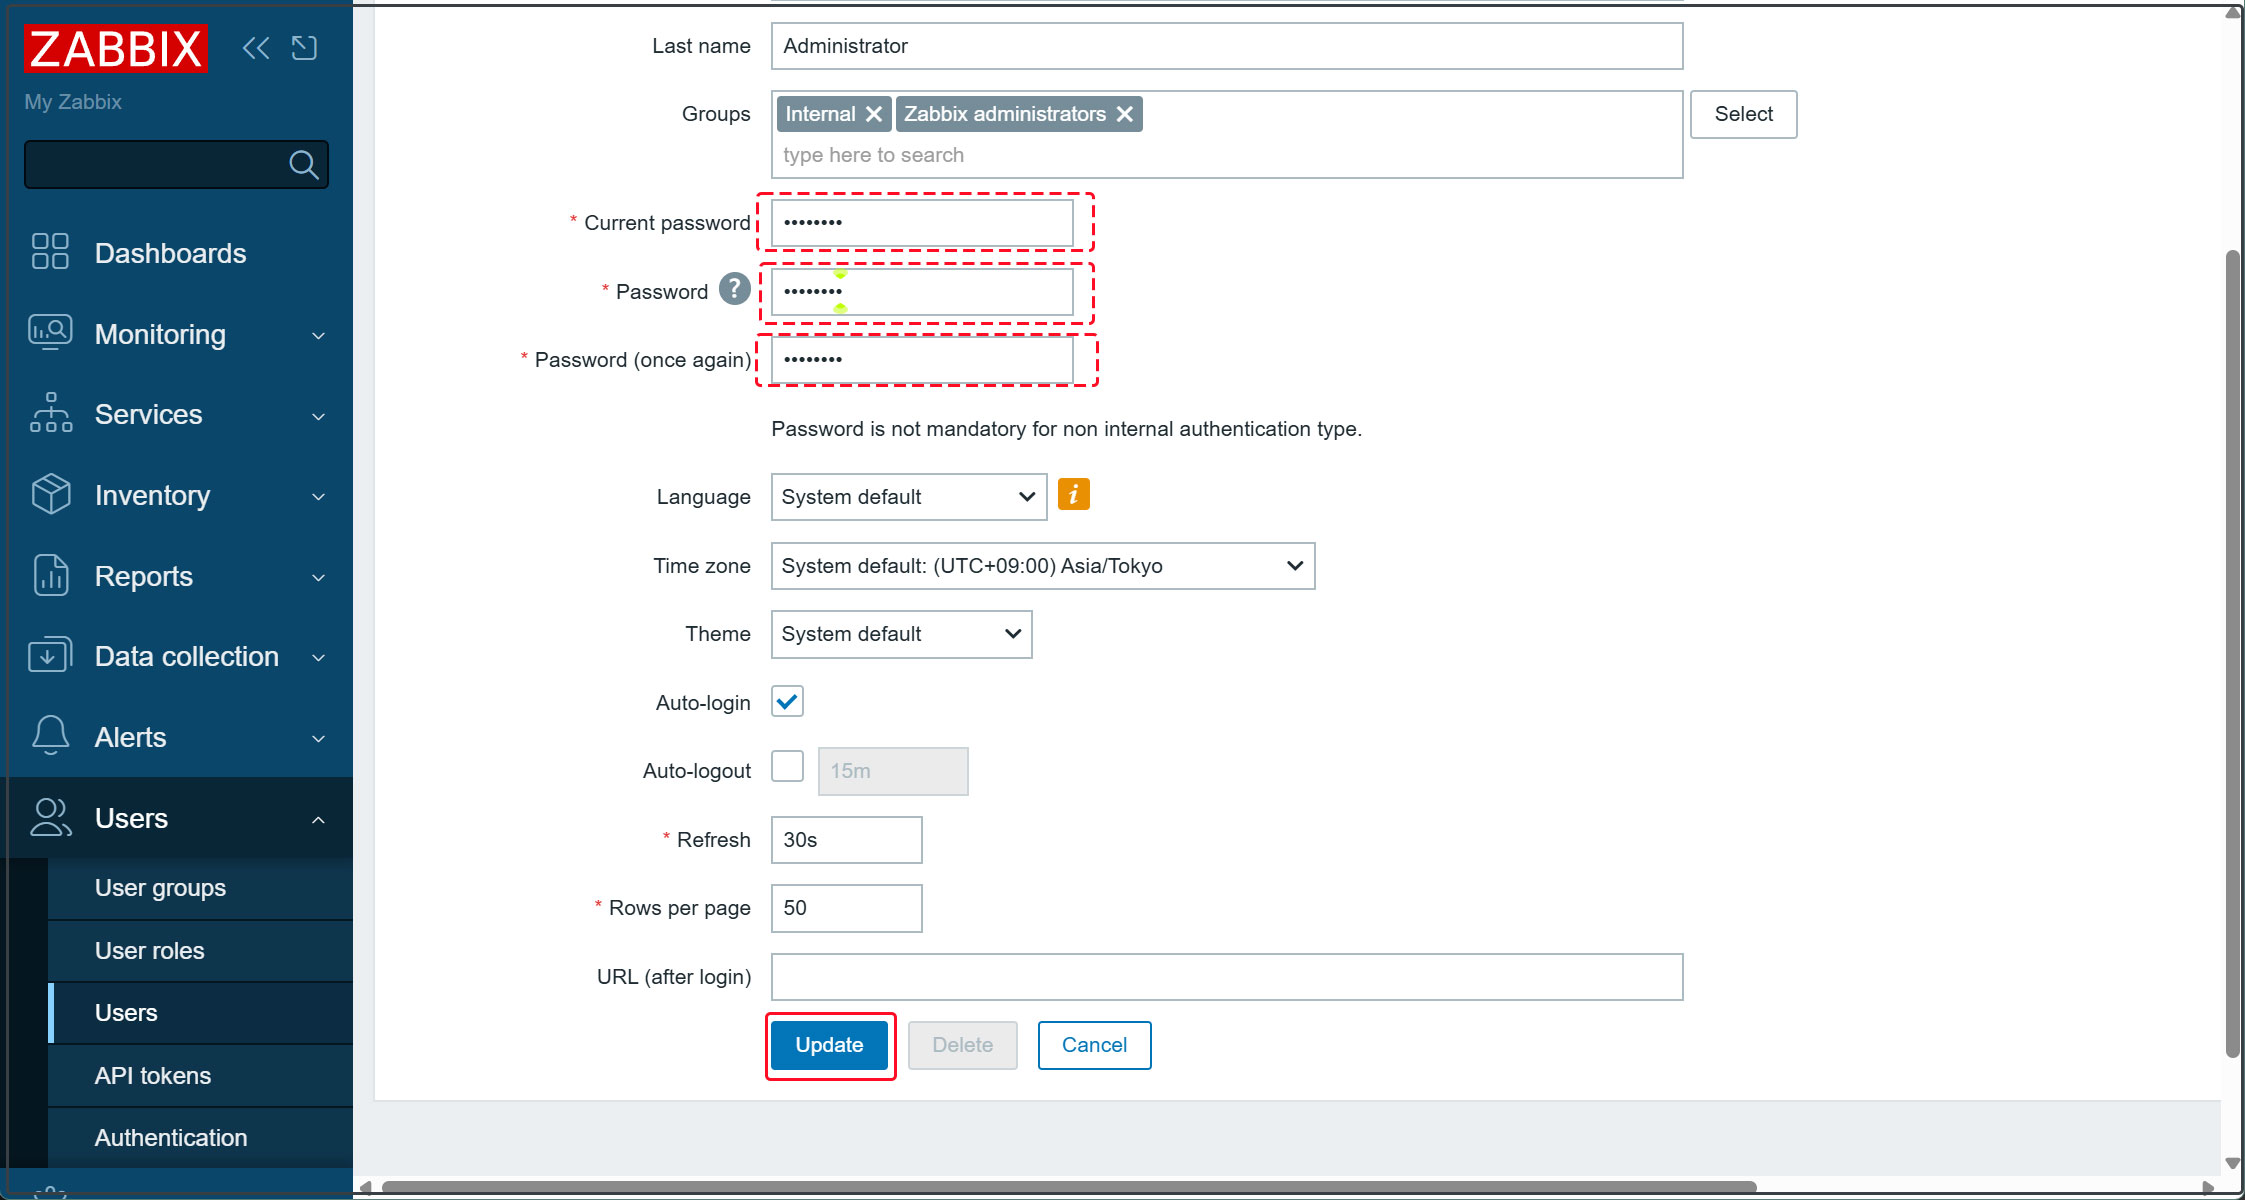
①In the left pane, select [Users] - [Users], then click [Admin] in the right pane.
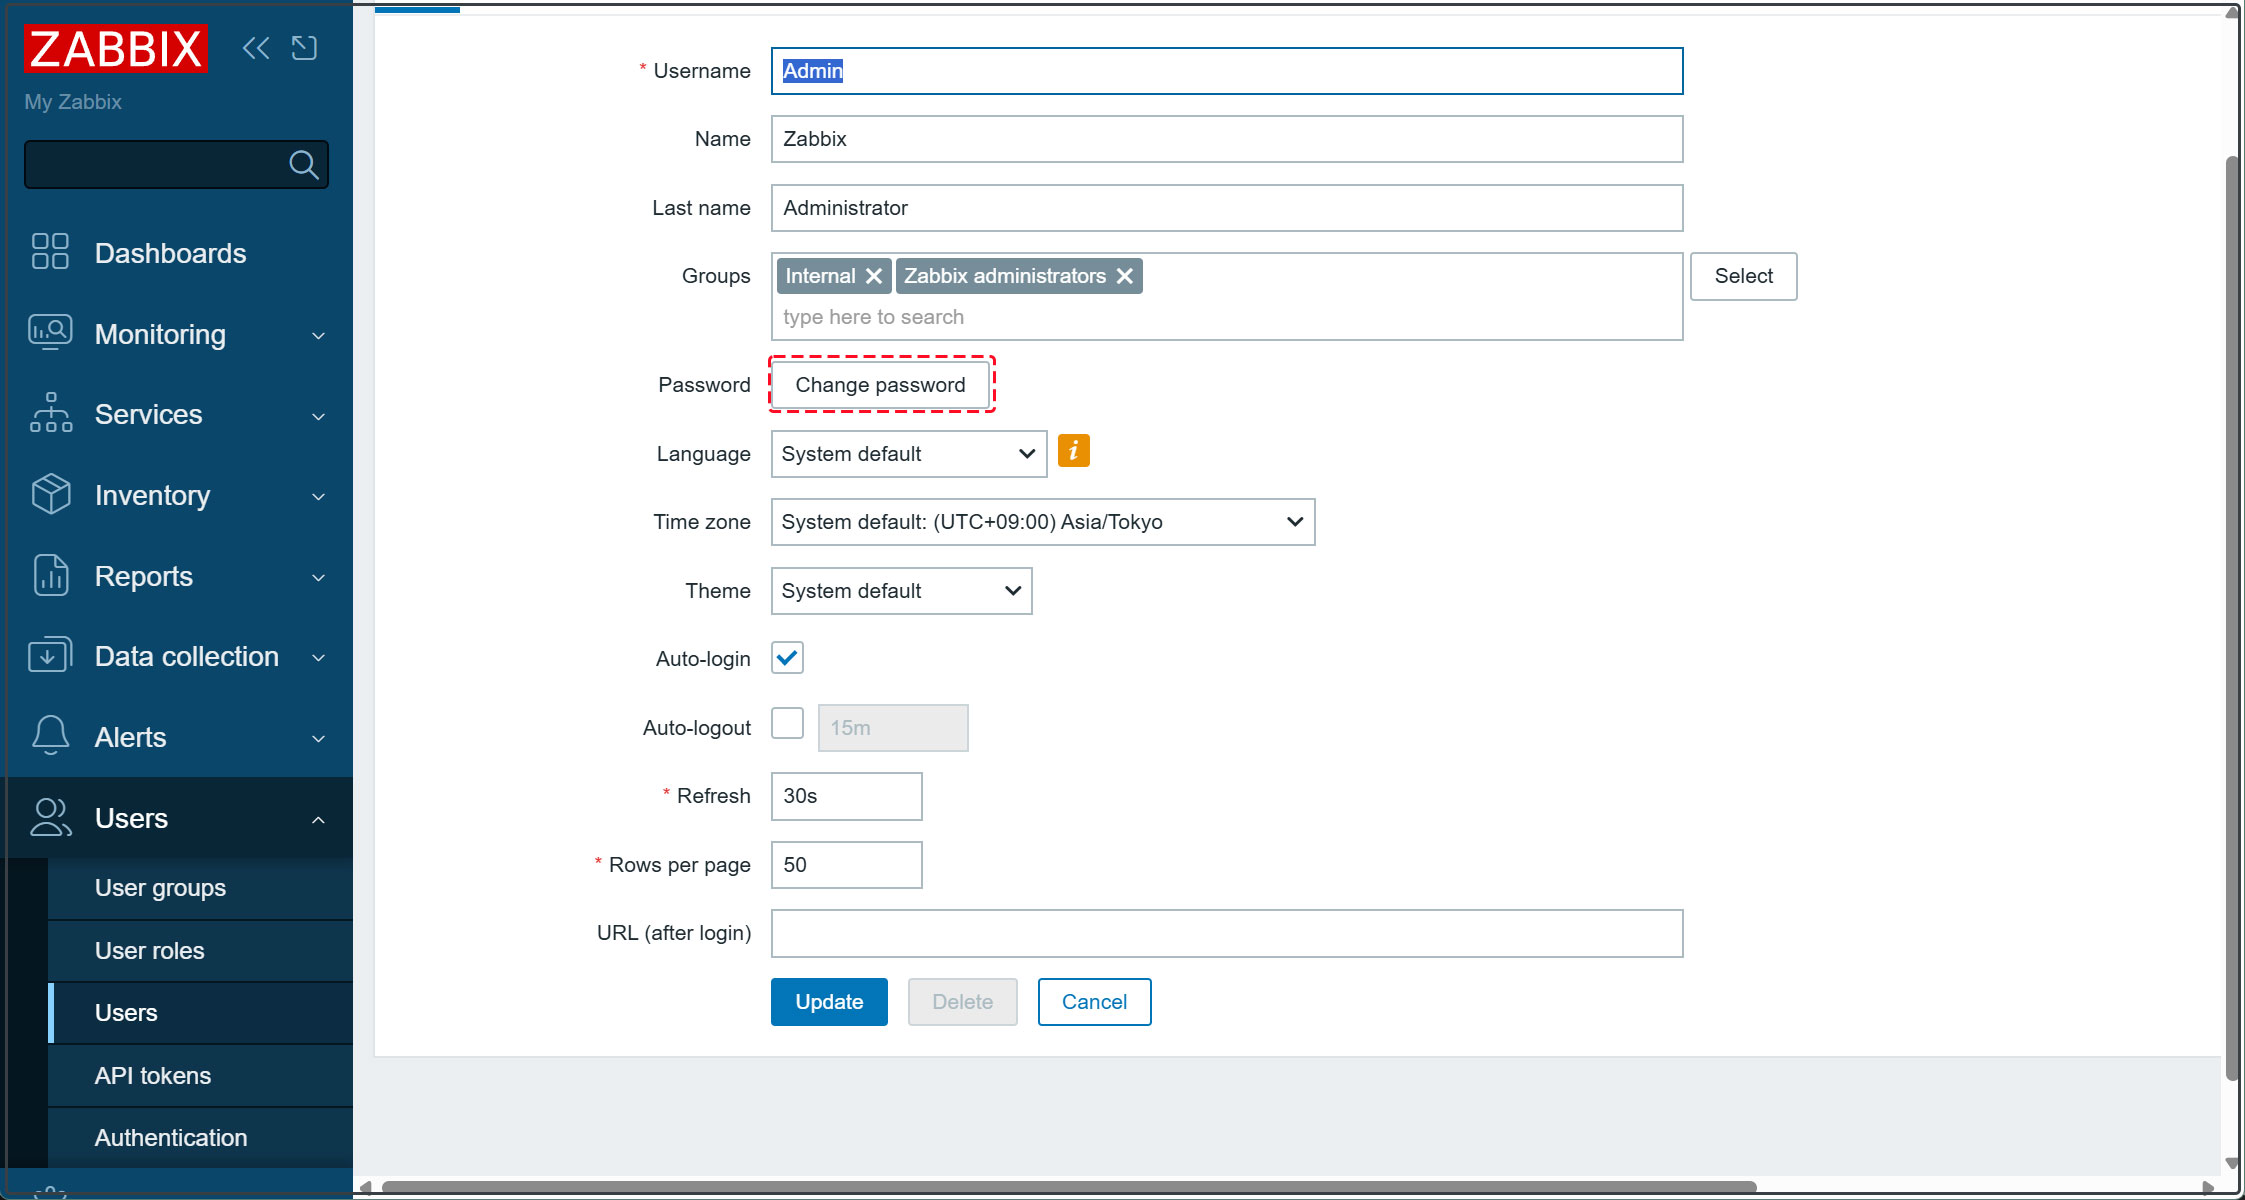
②Click [Change password]
③Current password: Enter the default password zabbix
Enter the new password you wish to use and click [Update].
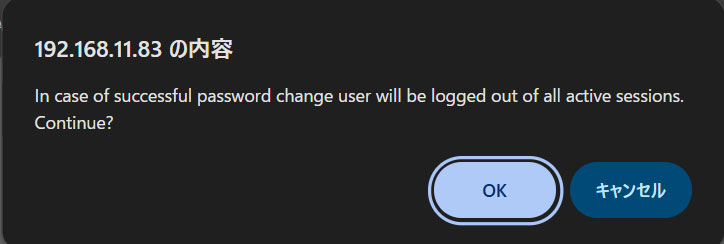
The following message will appear; click [OK].
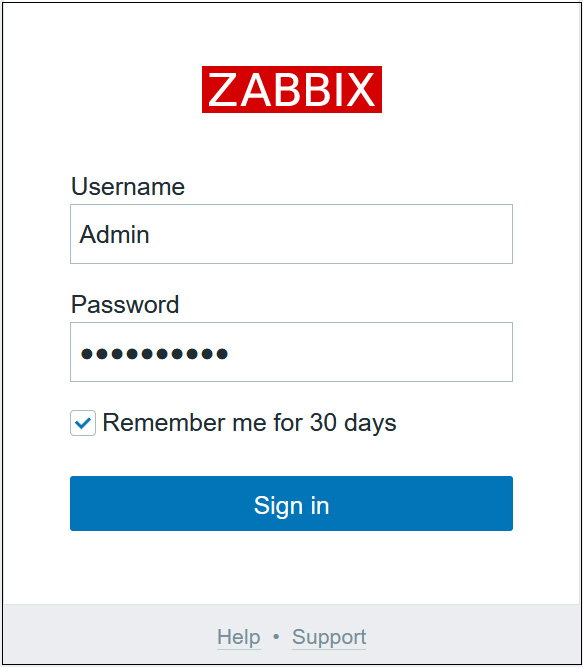
You will be redirected to the login authentication screen again. Please log in using the password you created.
Email Notification Settings
Set up notifications to receive various information via email.
This assumes an SMTP server such as Postfix is already configured on the server.
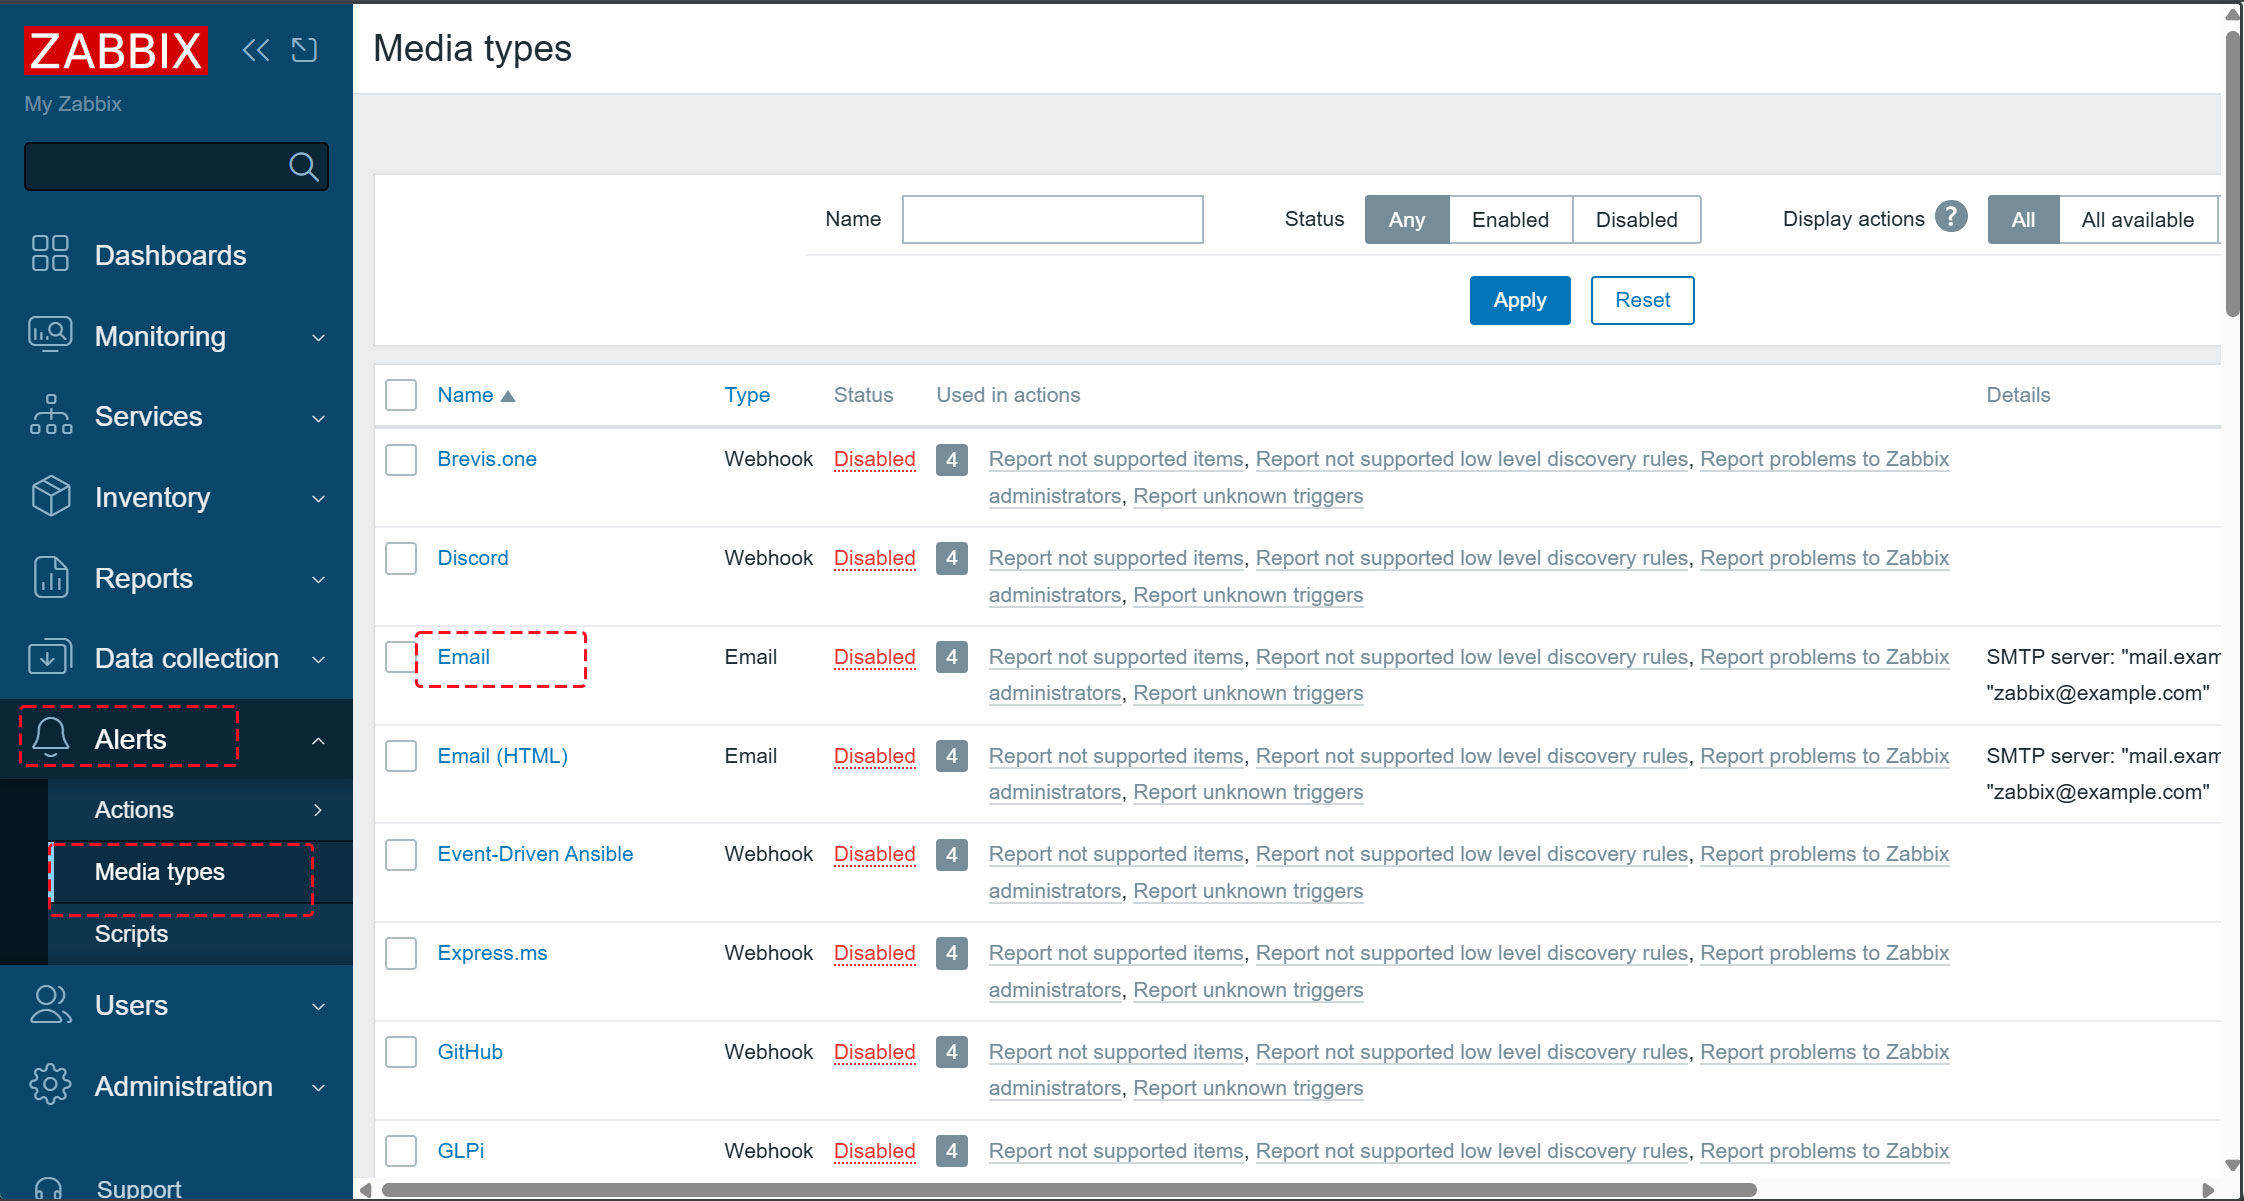
①In the left pane, select [Alerts] - [Media Types], then click [Email] in the right pane.
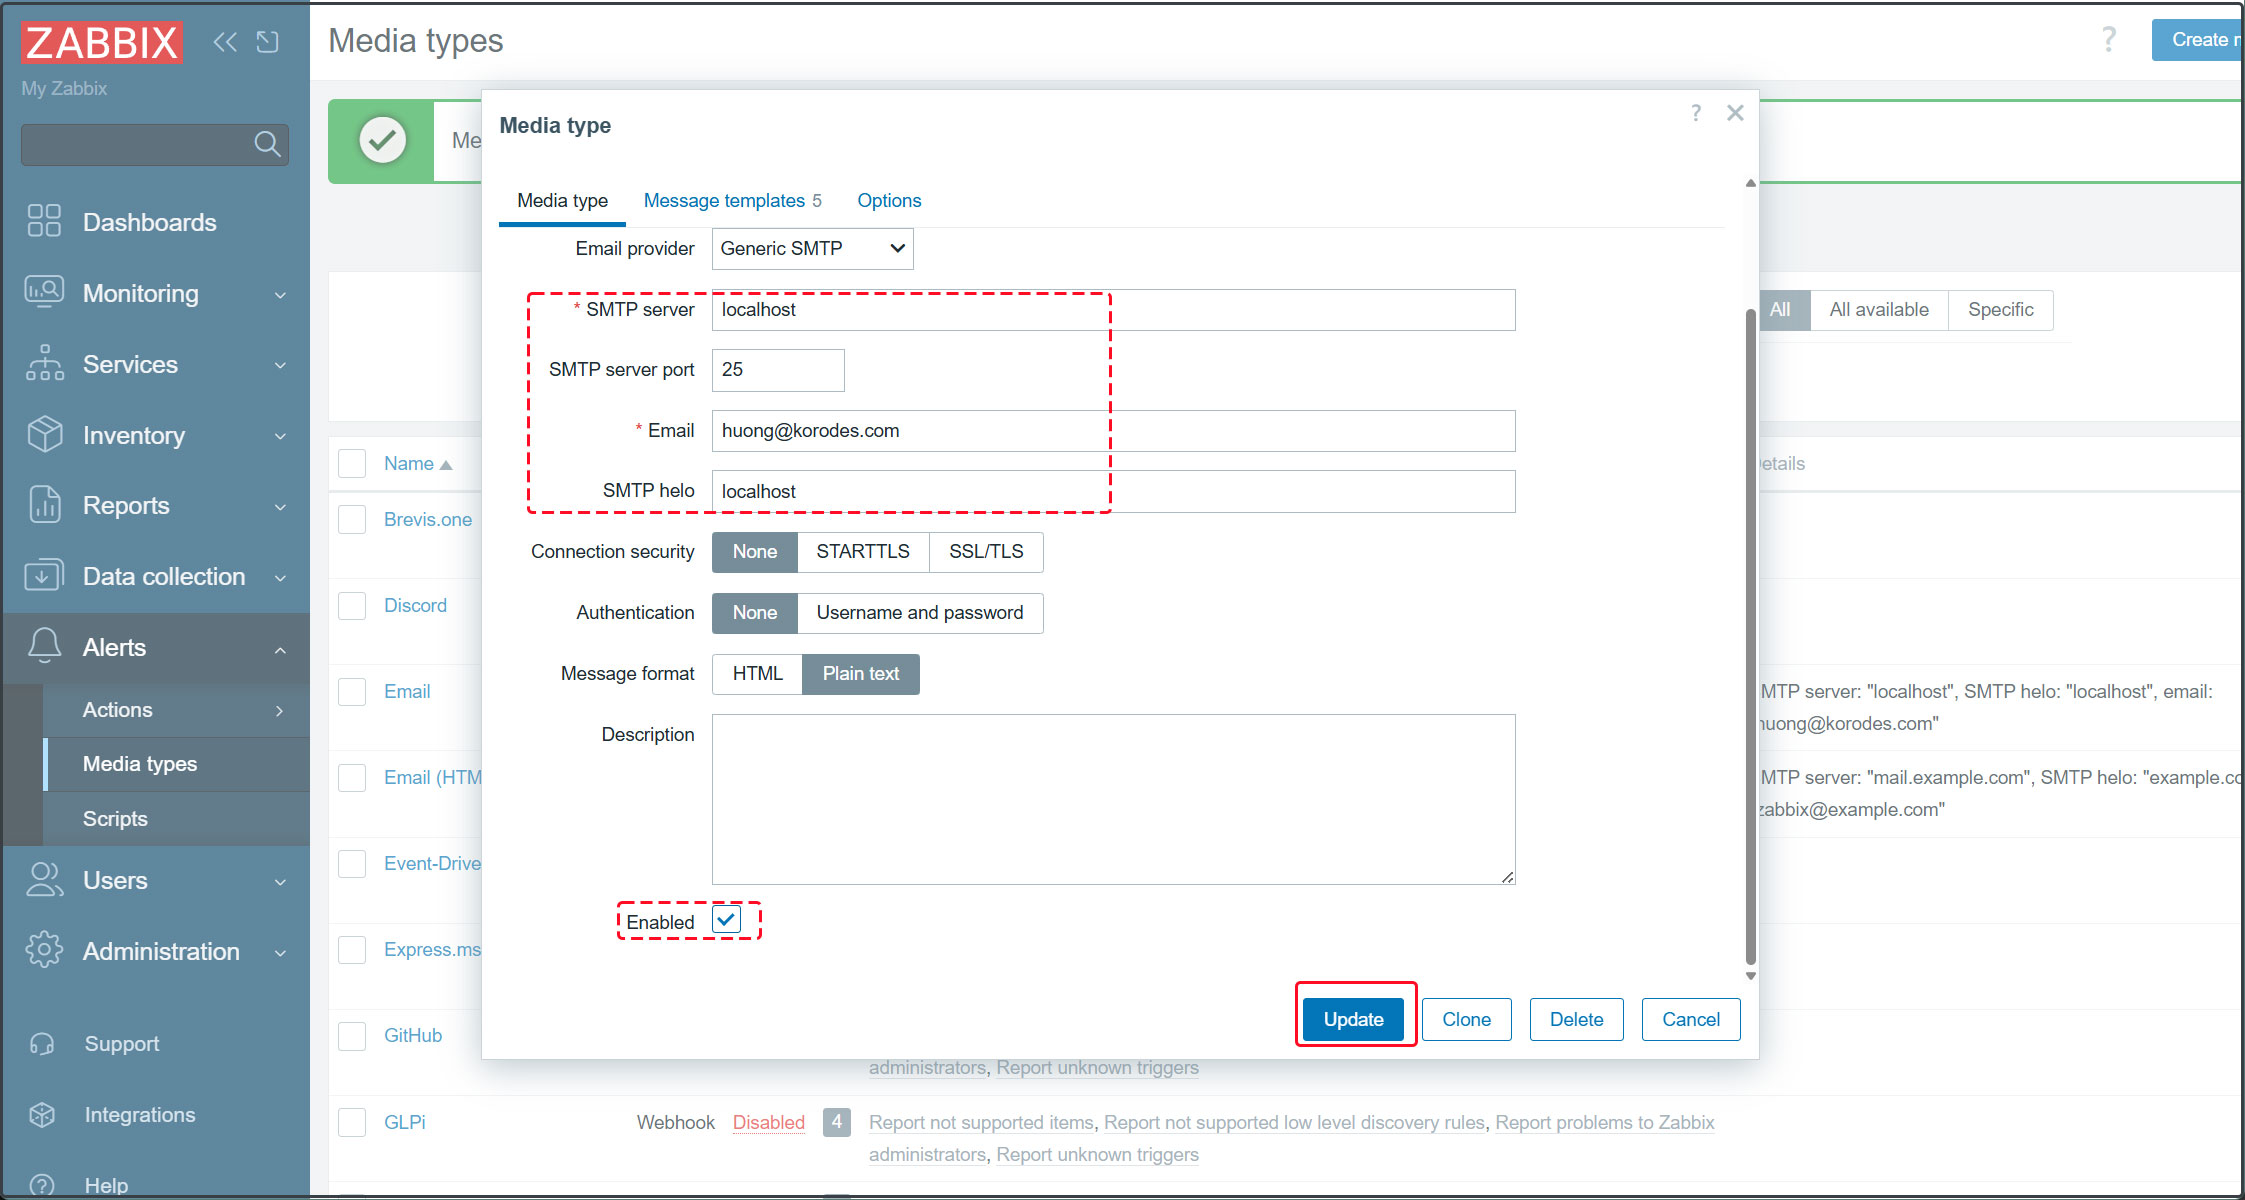
➁Configure the mail server settings as shown below, and enter the administrator's email address in the [Email] field.
Check the [Enabled] box and click the [Update] button.
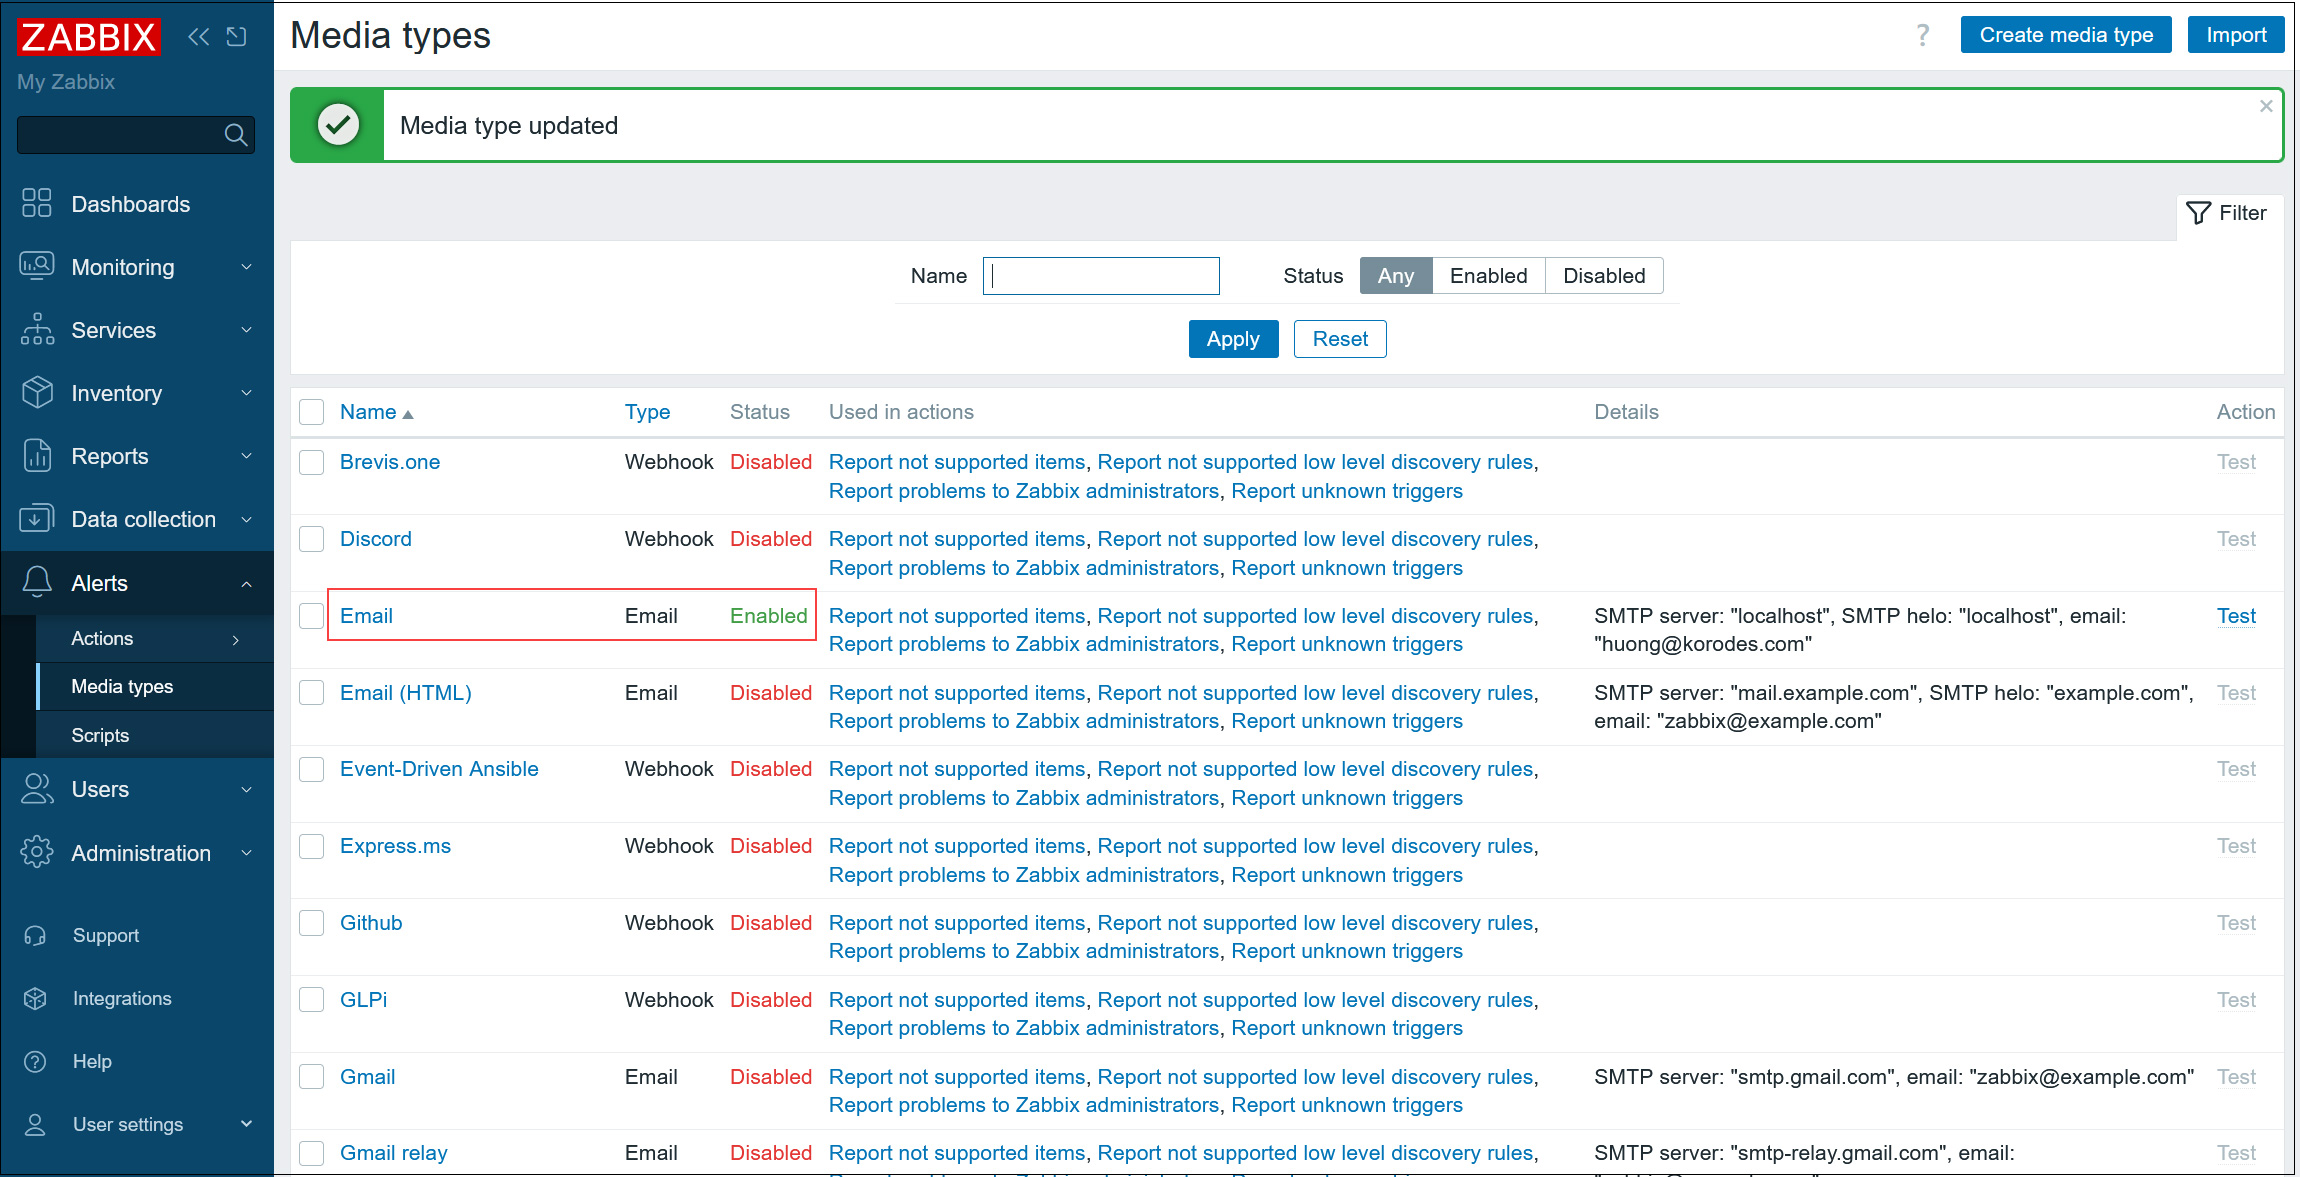
➂[Email] will be [Enabled].
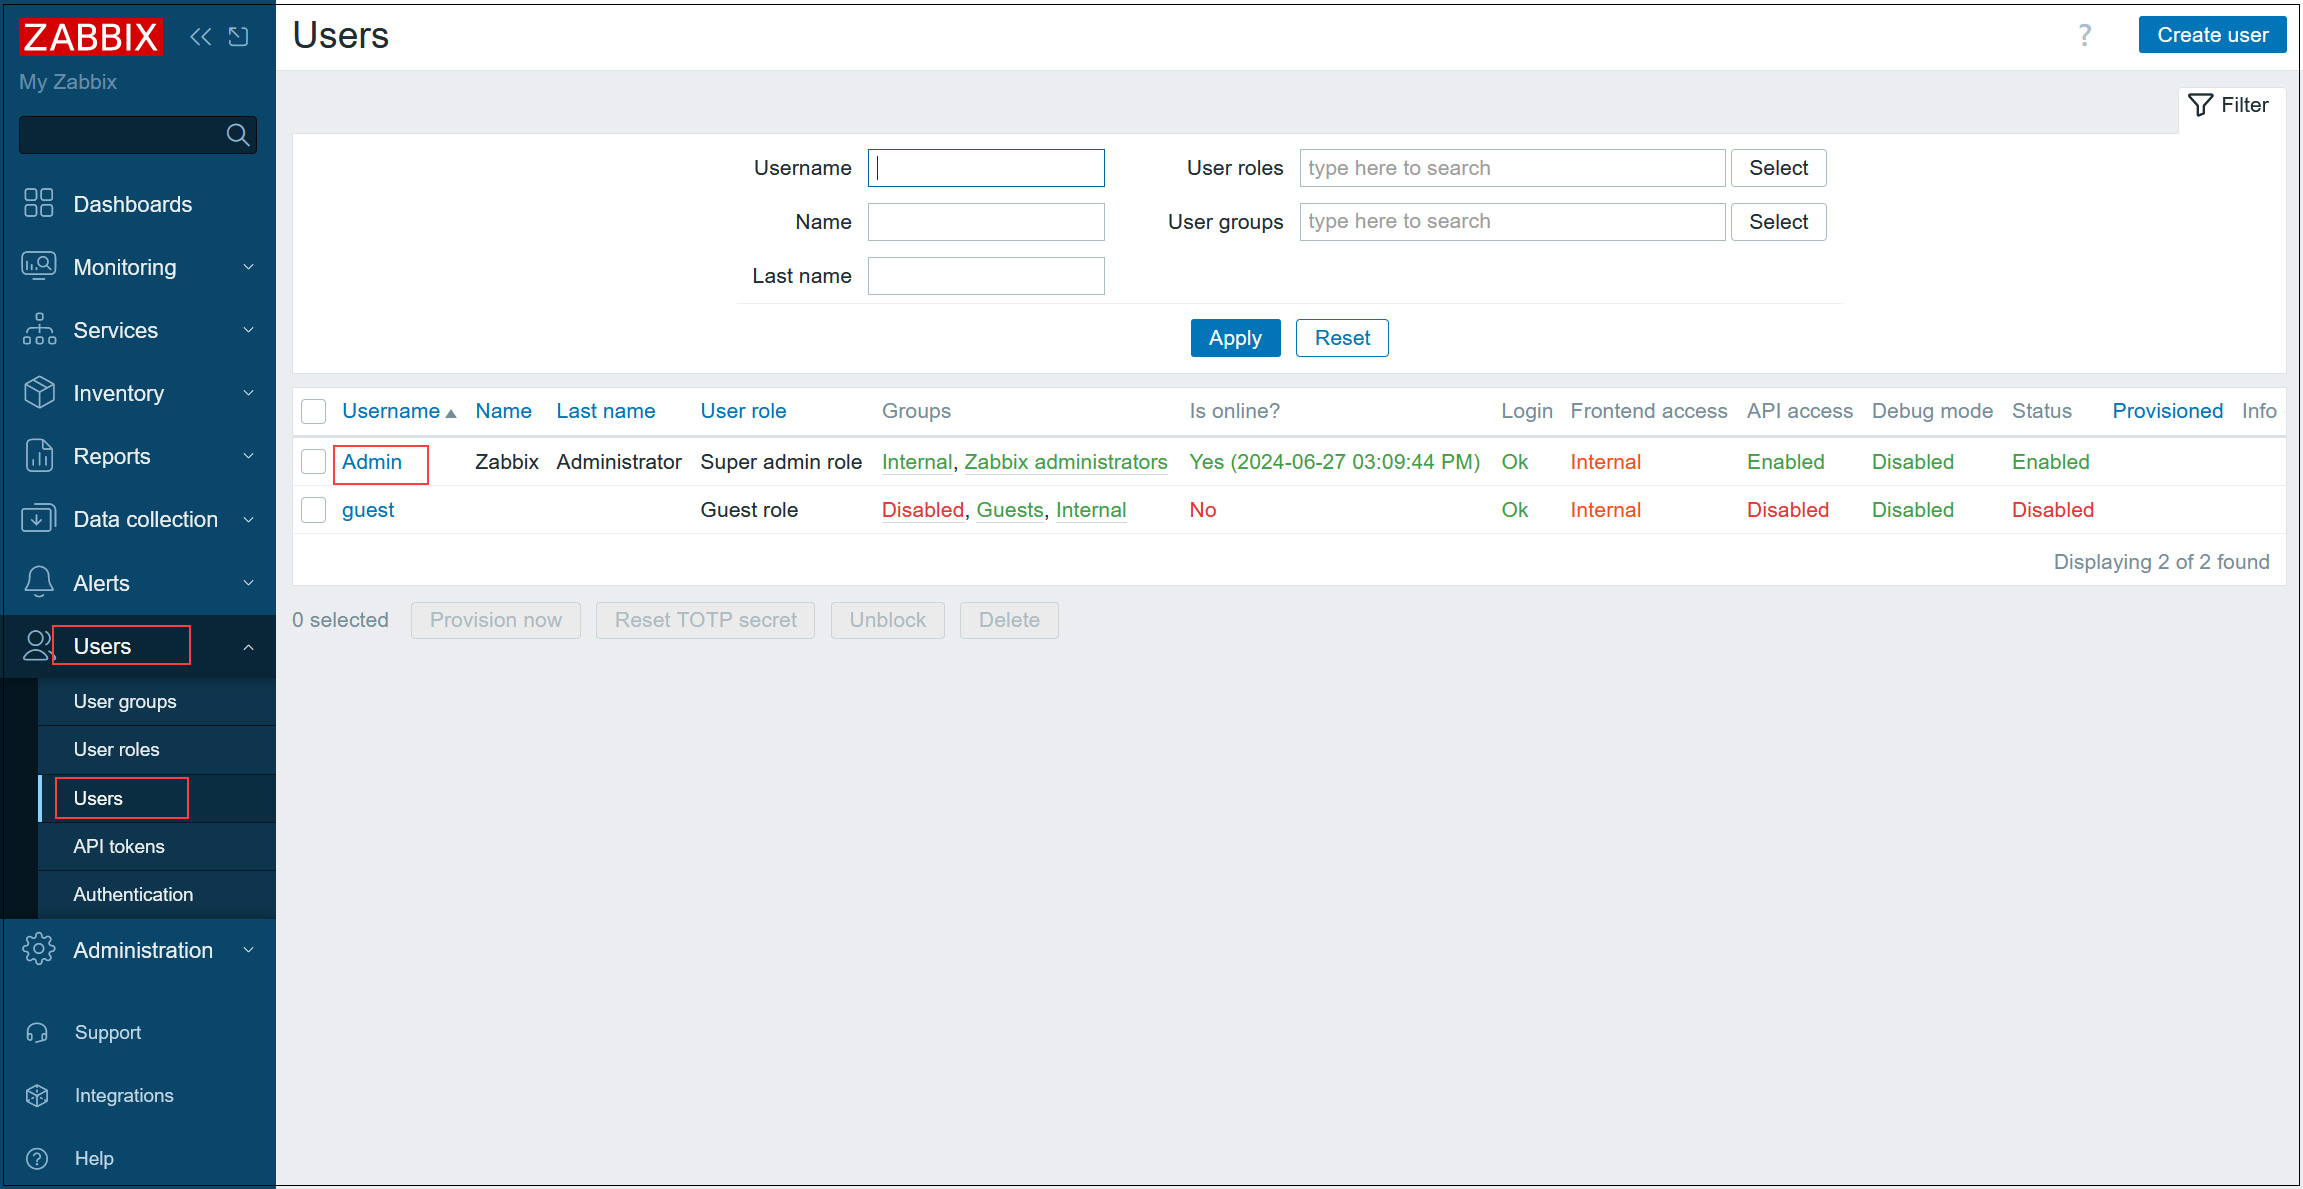
④In the left pane, select [Users] - [Users], then click [Admin] in the right pane.
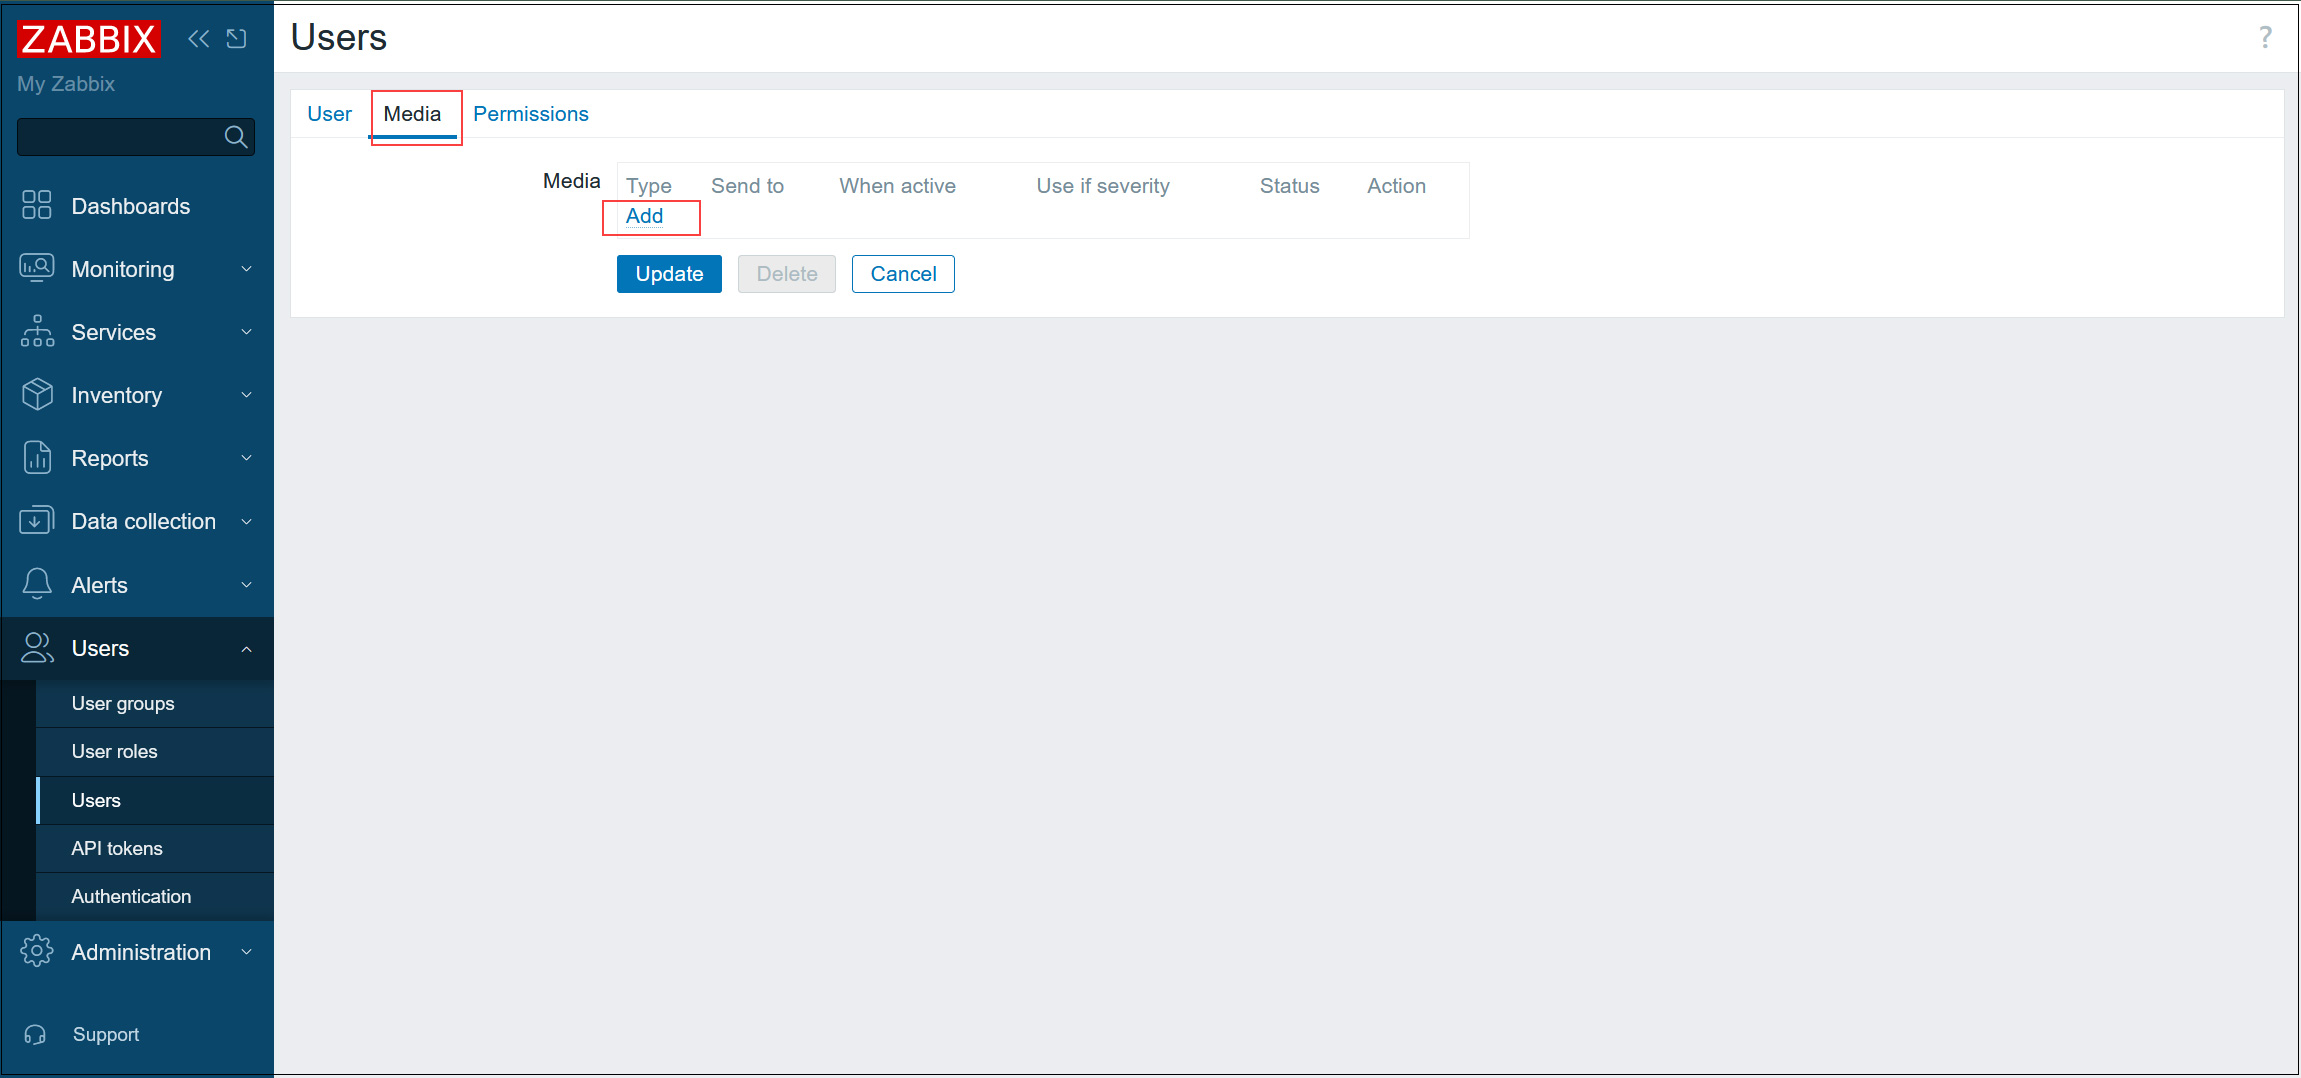
⑤Go to the [Media] tab and click [Add].
⑥Select [Email] as the [Type], enter the administrator's email address in the [Send to] field, and click [Add].
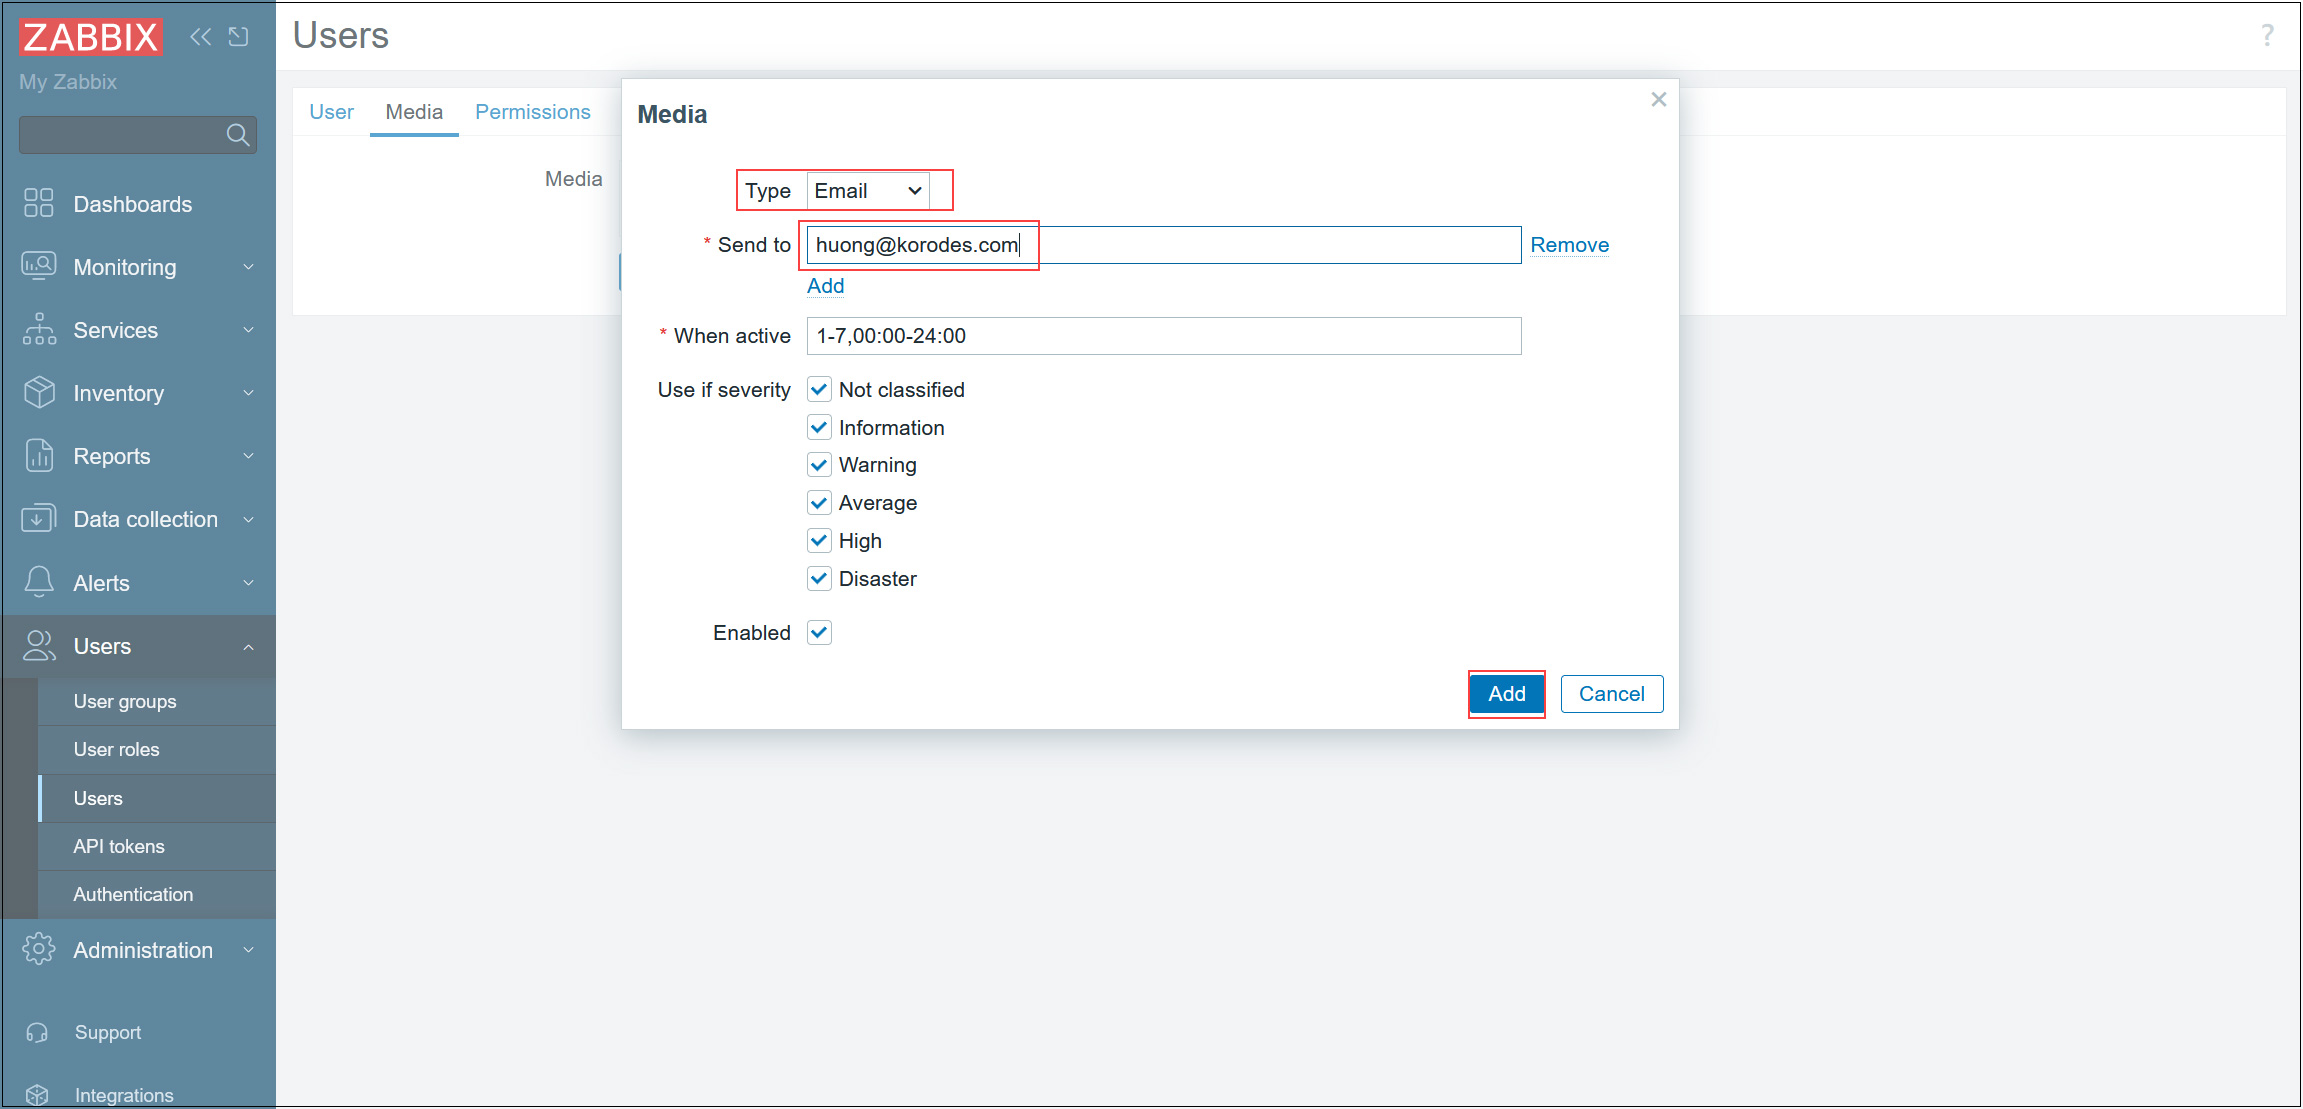
⑦Click the [Update] button
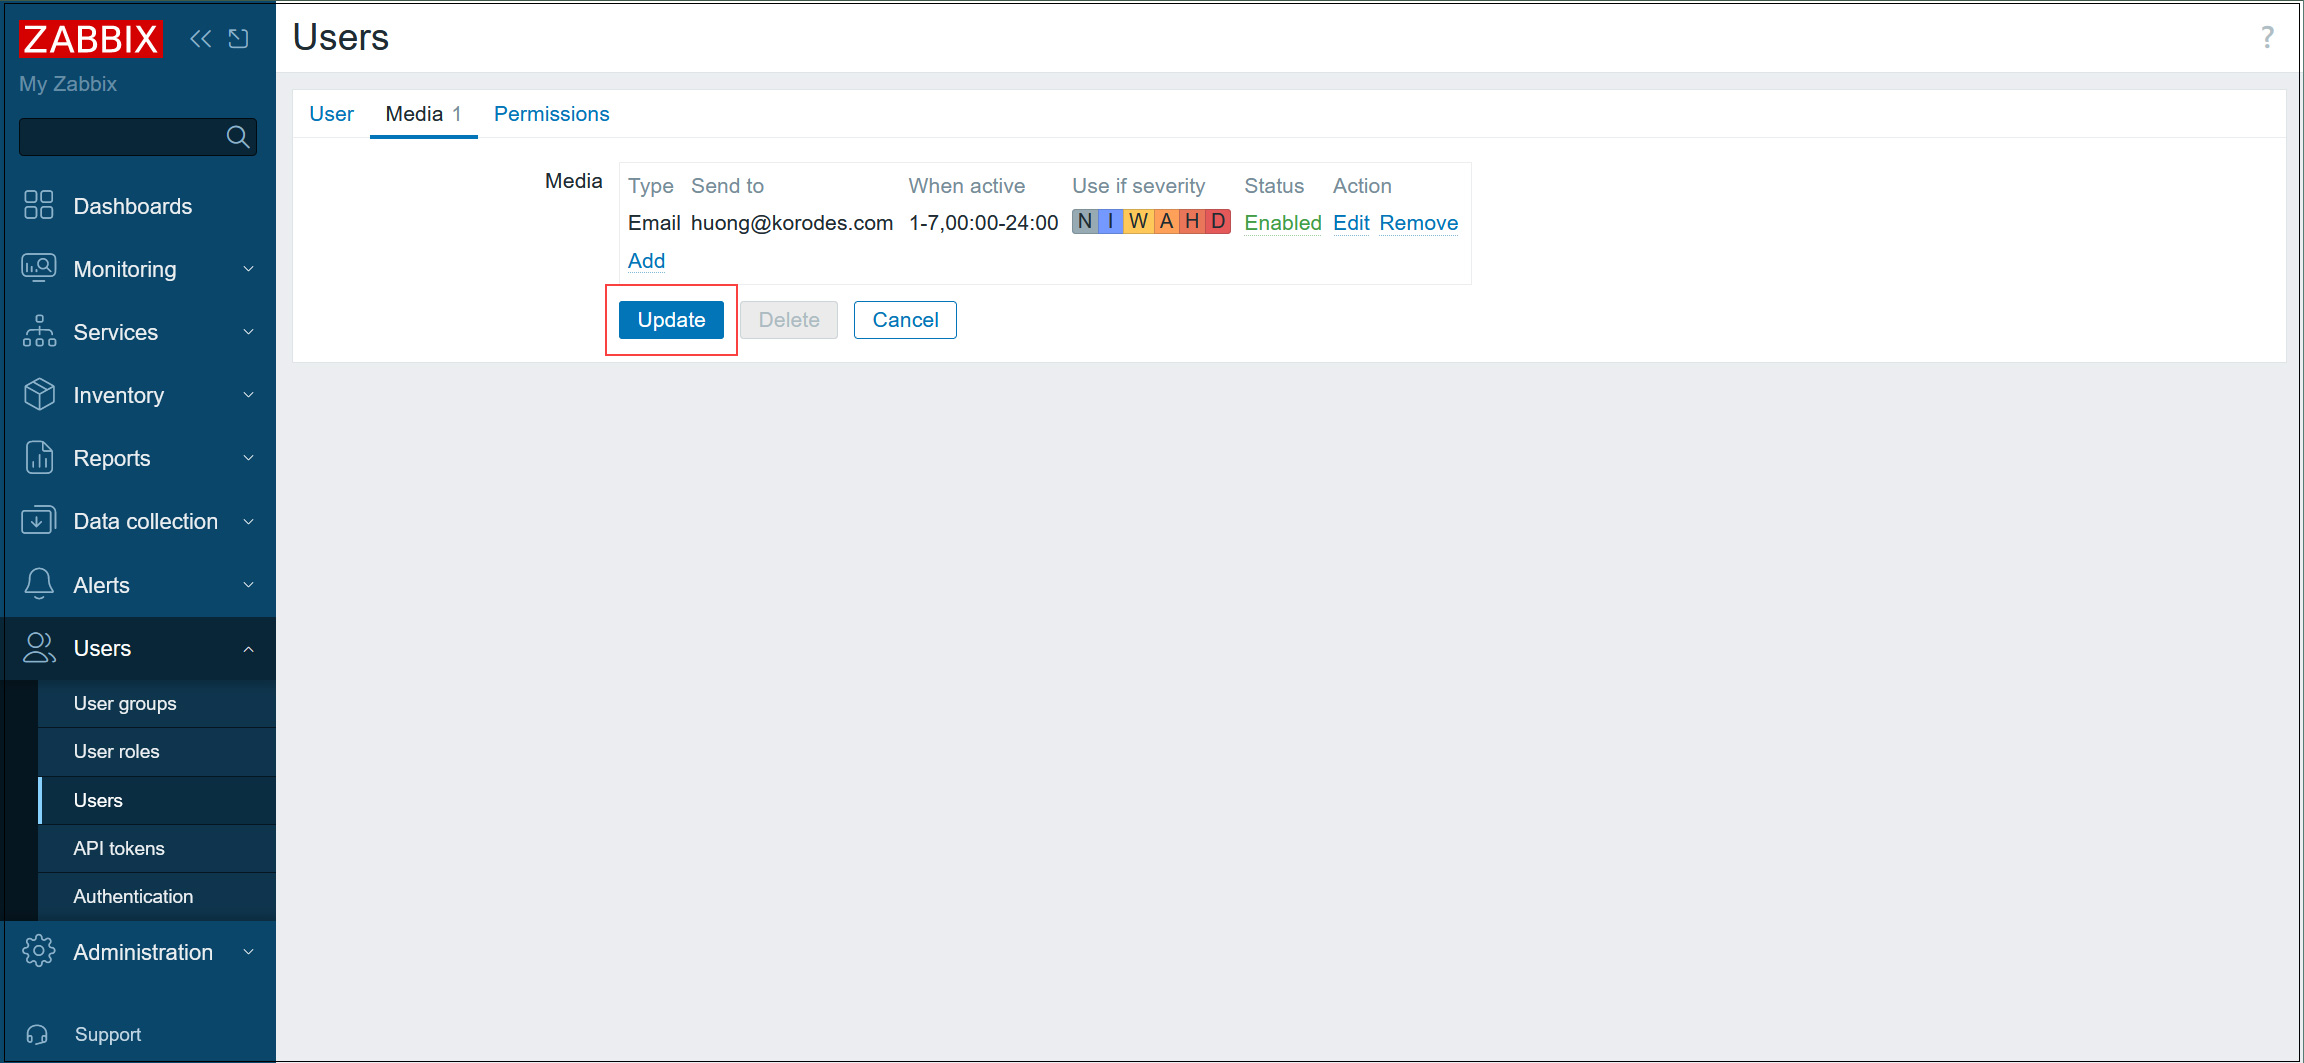
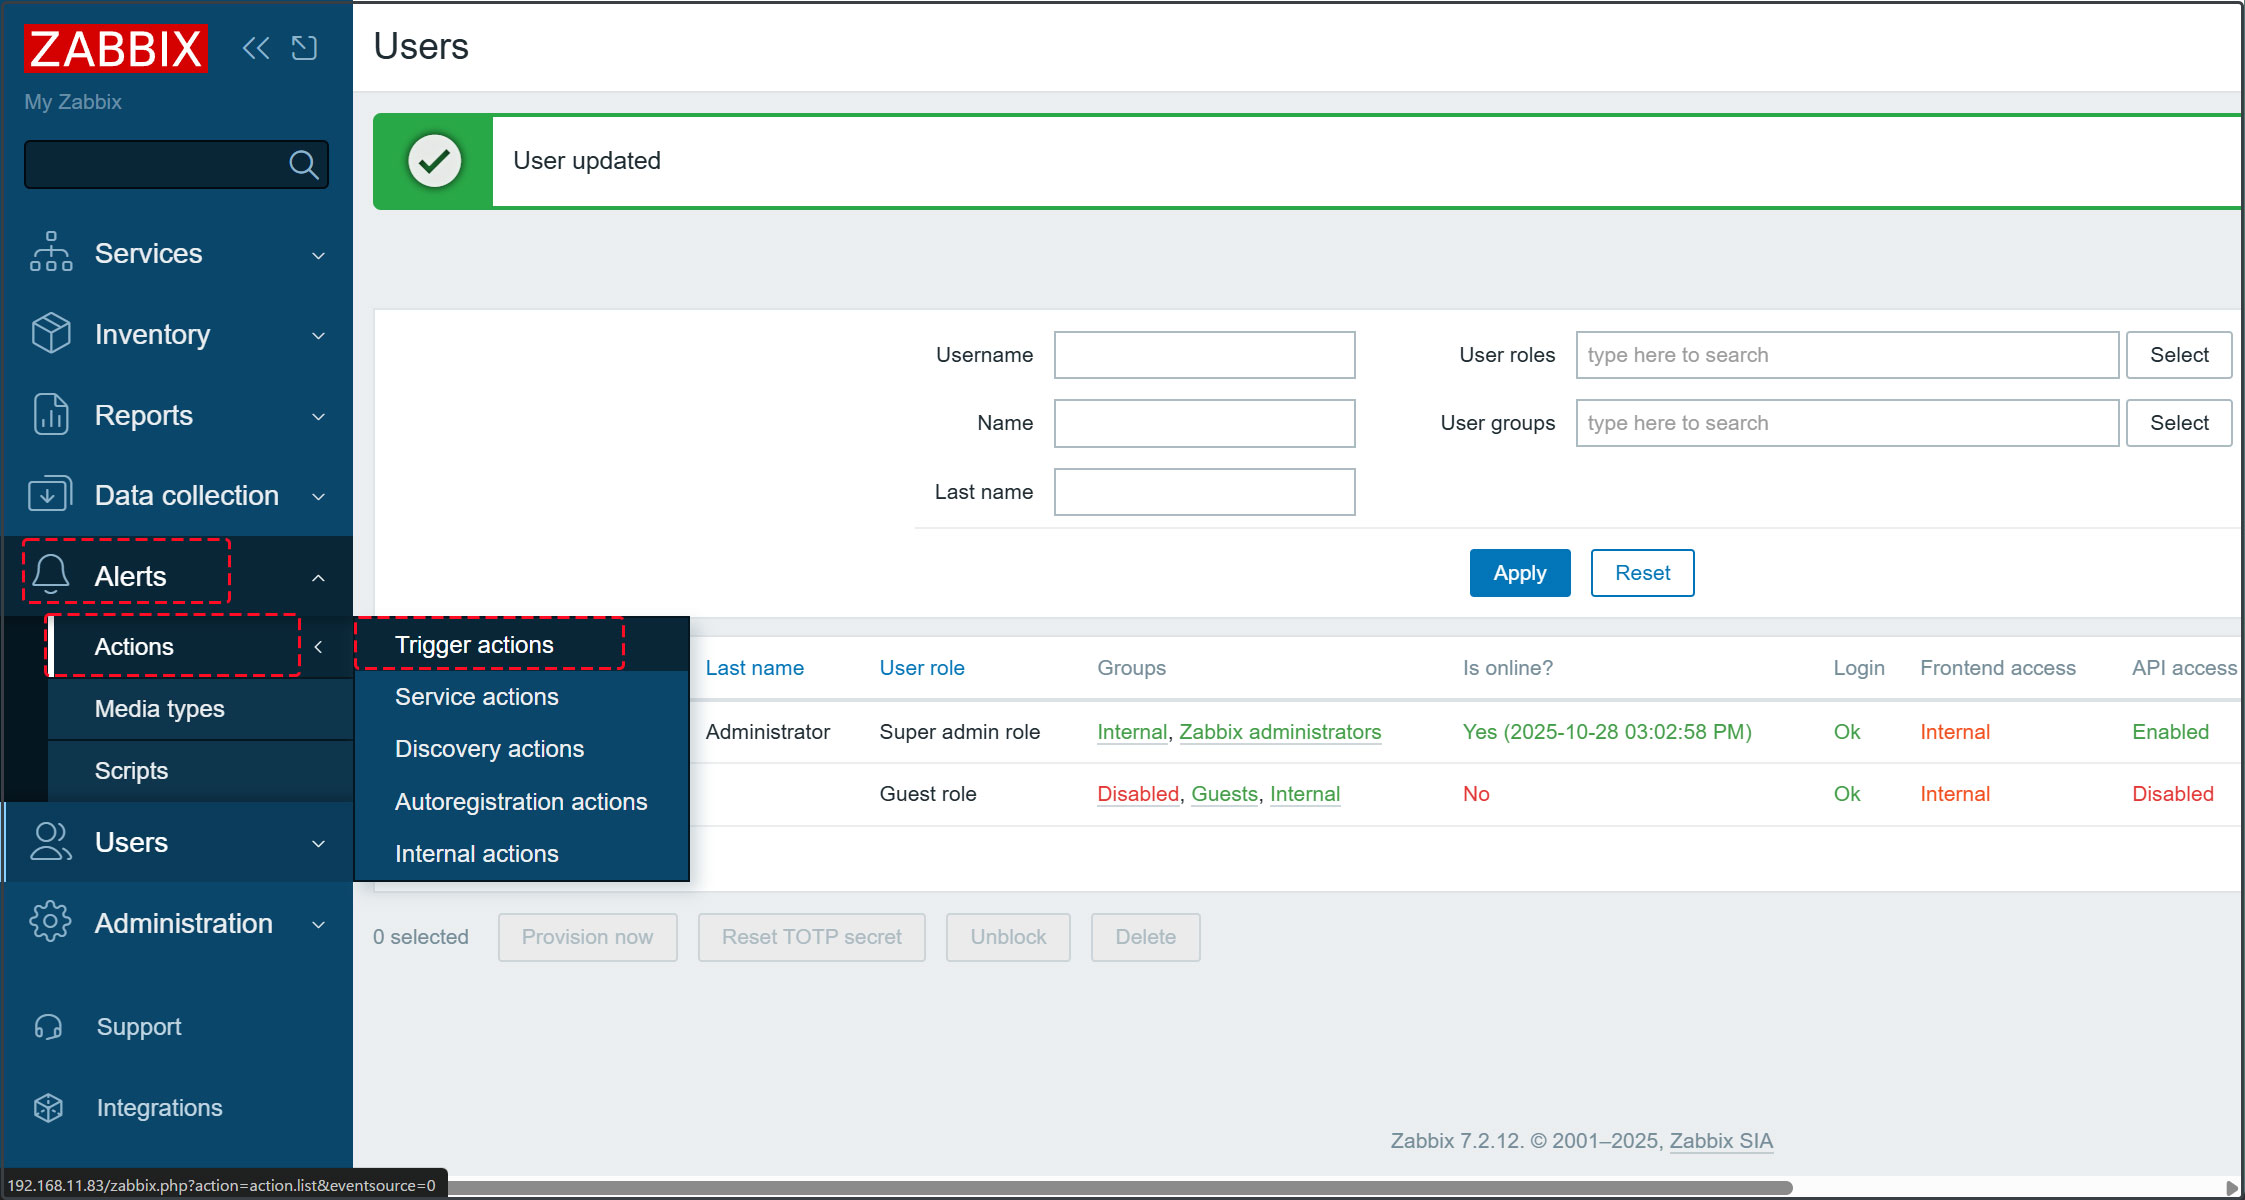
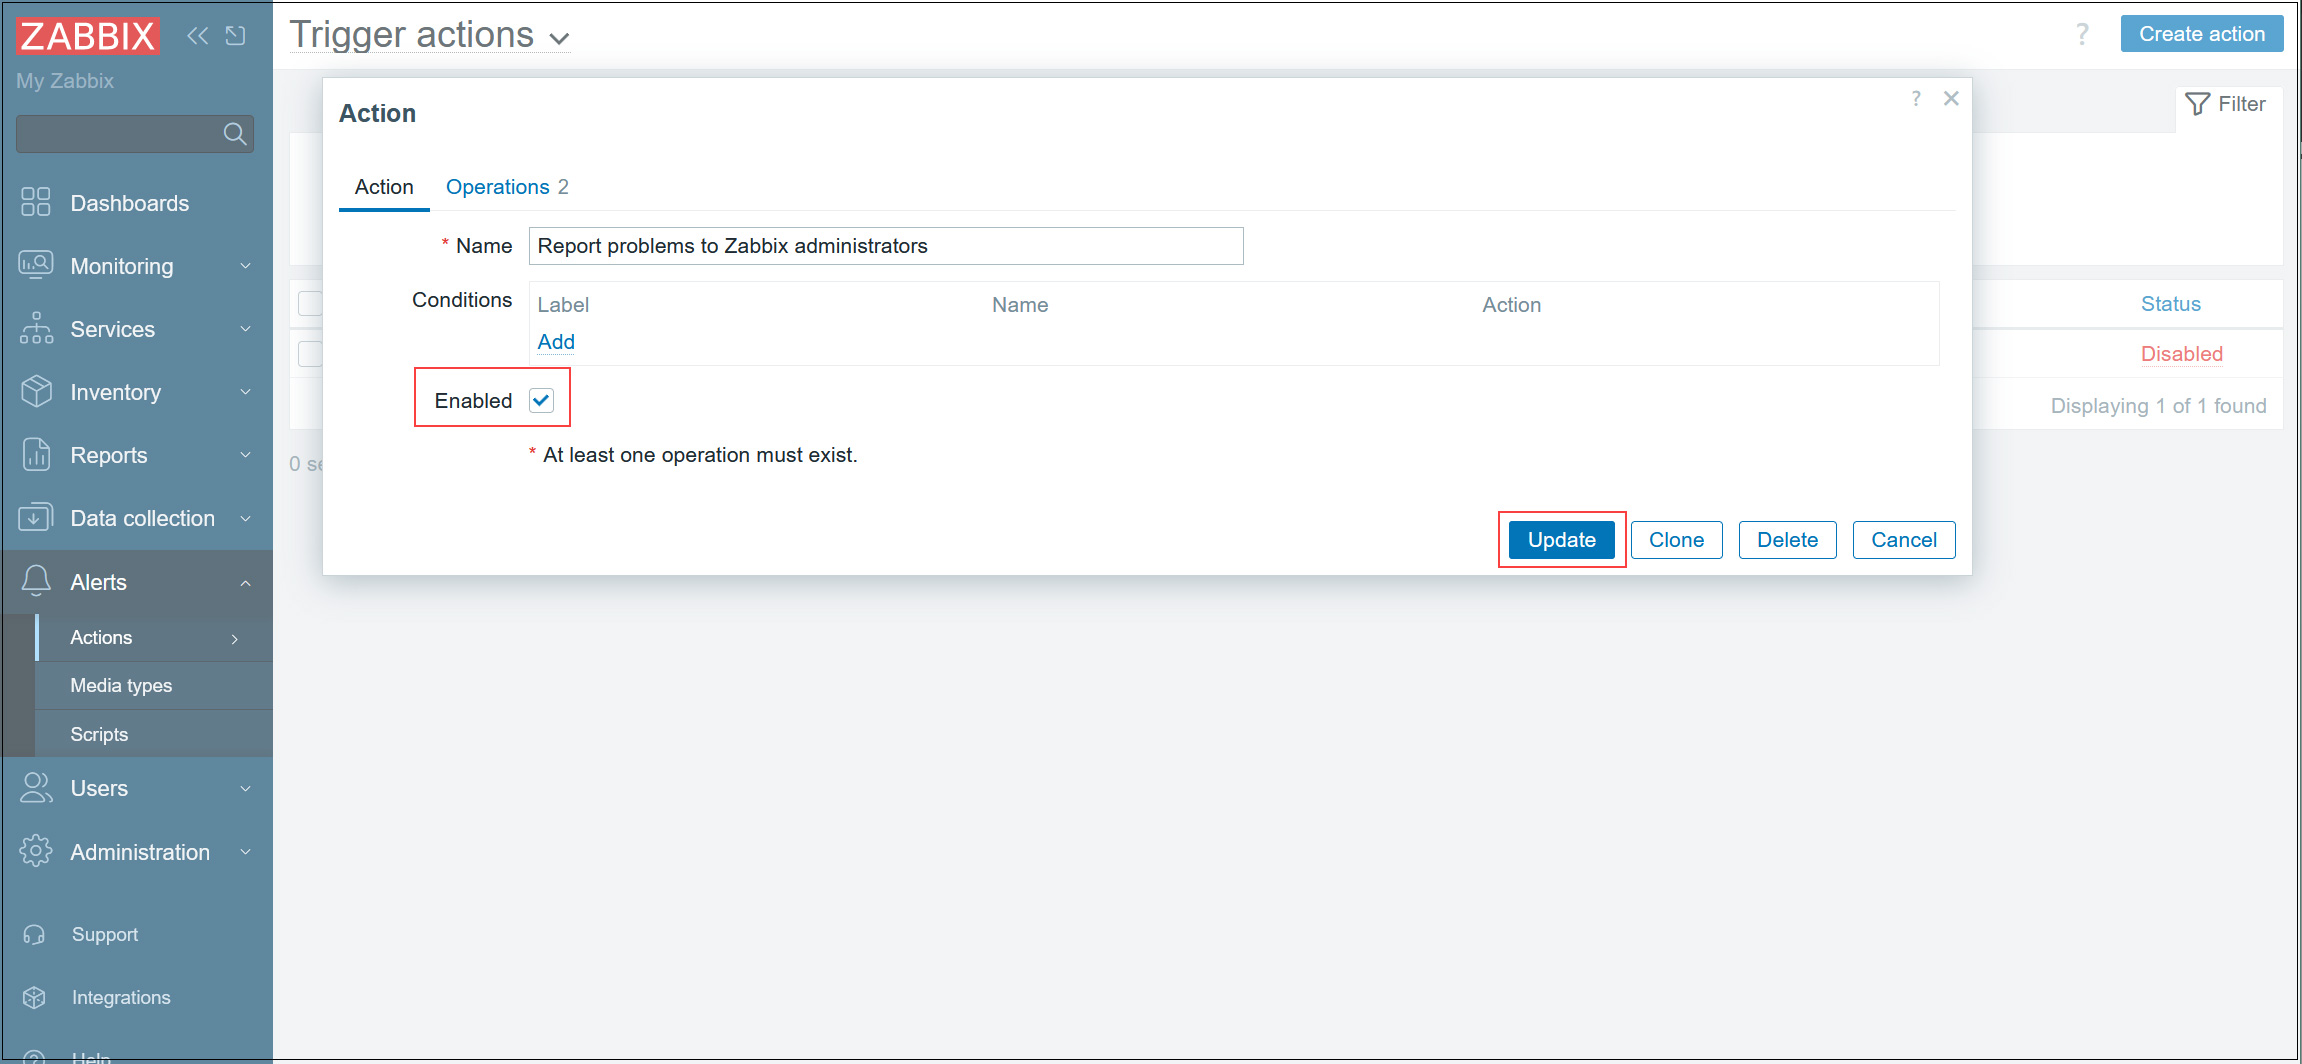
⑧In the left pane, select [Alerts] - [Actions] - [Trigger actions].
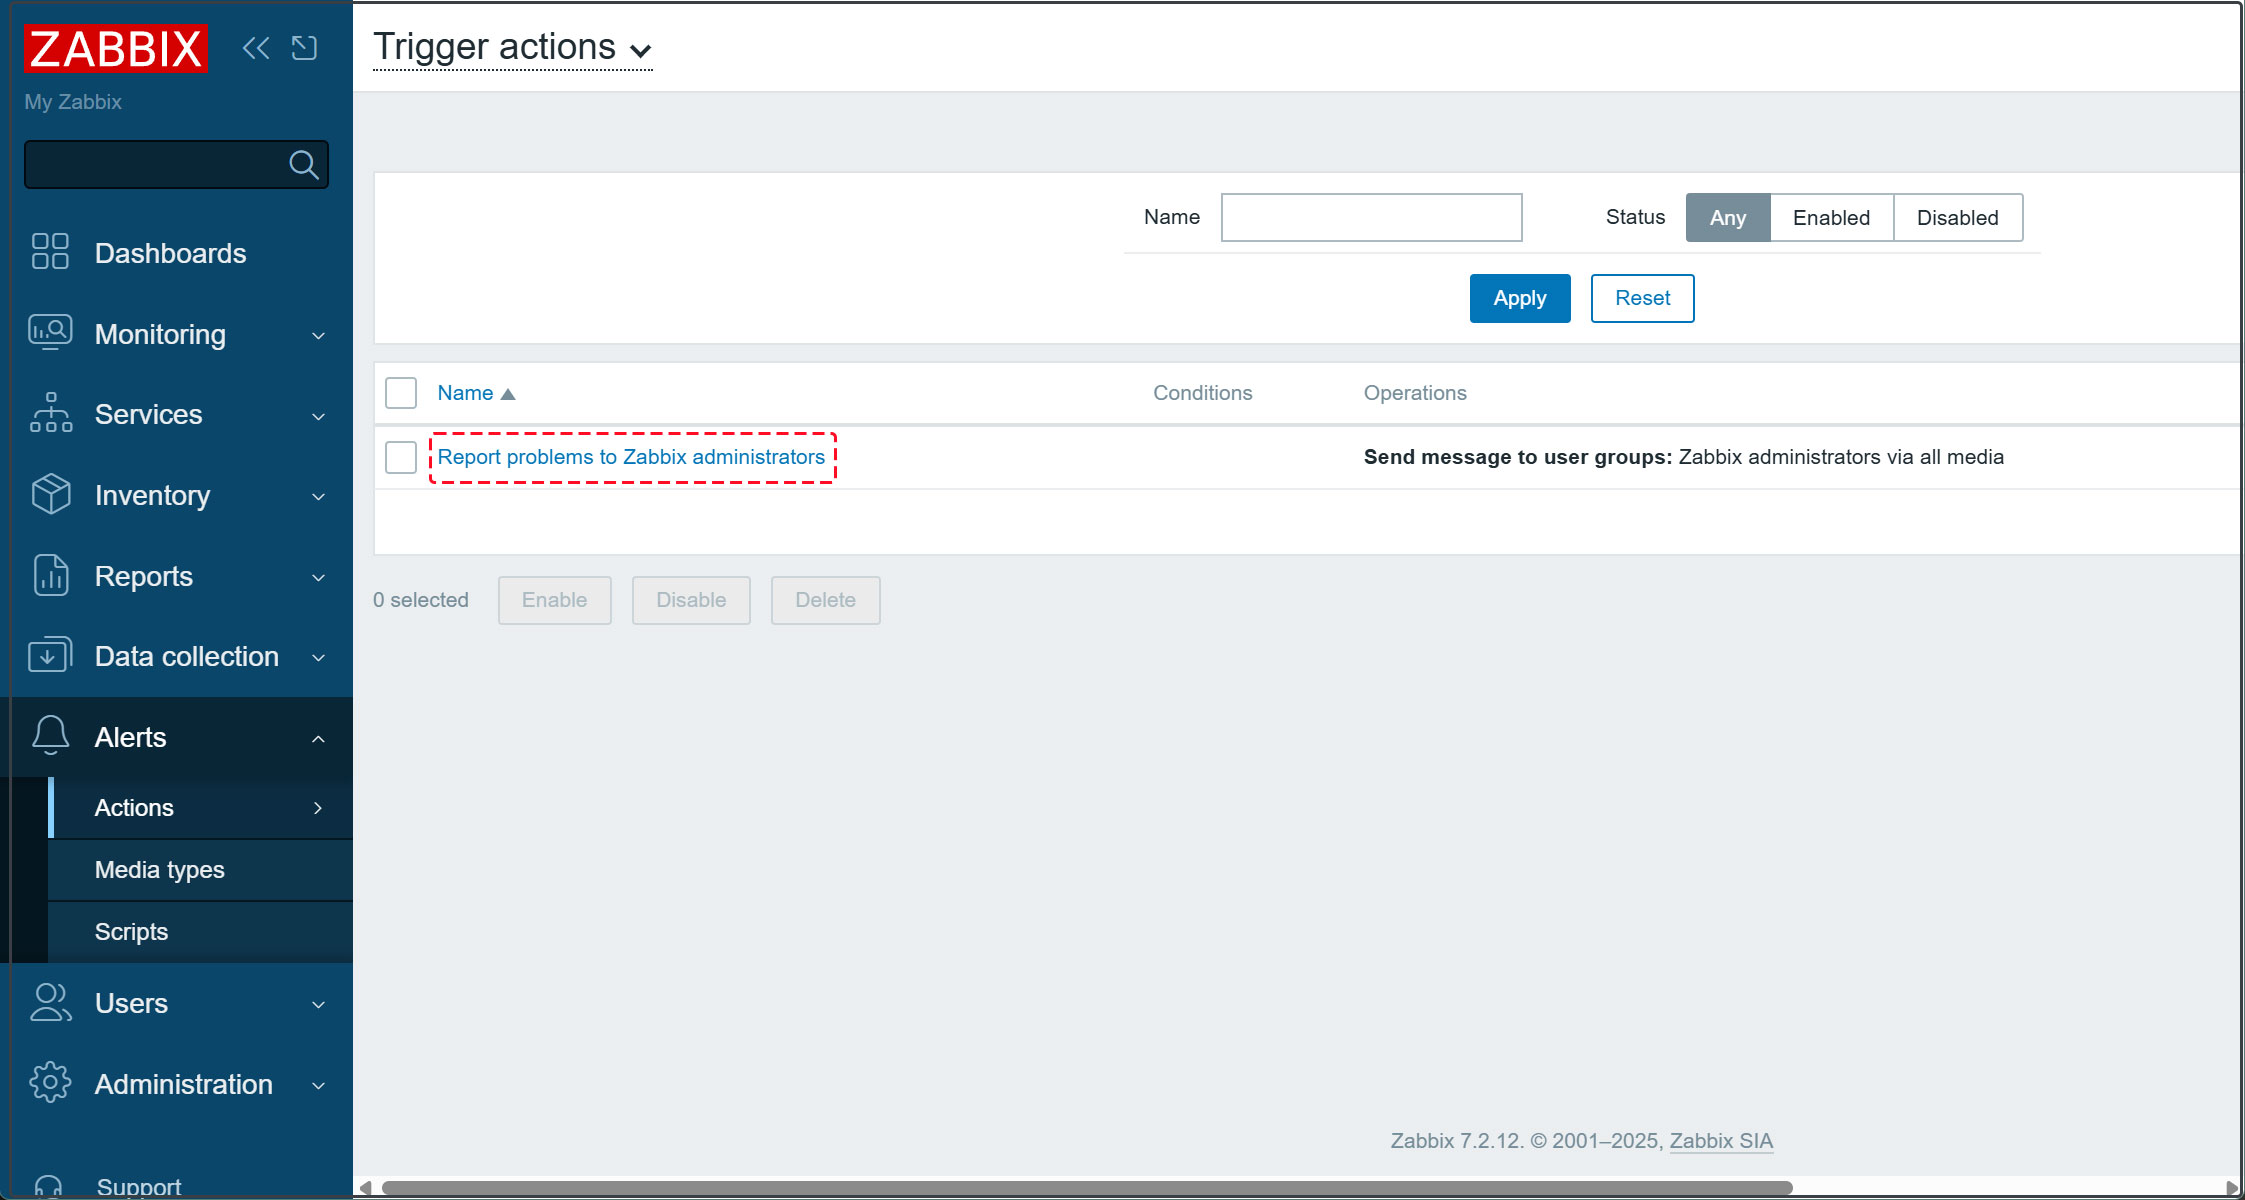
⑨Click [Report problems to Zabbix administrators] in the right pane.
⑩Check [Enabled] and click the [Update] button.
This completes the configuration to send various failure notifications to the specified email address.
Add monitored hosts
Add the following servers as targets
OS : FreeBSD14.3
IP Address : 192.168.11.85
Host name : Lion
1.Configuration on the server to be monitored
1.1 Install Zabbix Agent
# pkg install -y zabbix74-agent
1.2 Editing the Zabbix Agent Configuration File
#  vi /usr/local/etc/zabbix74/zabbix_agentd.conf

Line 113: Specify the Zabbix server (in this case, 192.168.11.83)
Server=192.168.11.83
Line 169: Specify the Zabbix server (in this case, 192.168.11.83)
ServerActive=192.168.11.83
Line 178: Change to your own hostname (in this case, Lion)
Hostname=Lion
# service zabbix_agentd enable
zabbix_agentd enabled in /etc/rc.conf
# service zabbix_agentd start
1.3 Configure the firewall on the Zabbix agent side
You must allow Zabbix ports 10050 (Zabbix server side) and 10051 (Zabbix agent side).(xxx,*** must specify a number that does not overlap with others.)

# vi /usr/local/etc/ipfw.rules

$IPF xxx allow tcp from any to any 10050 in
$IPF xxx allow tcp from any to any 10050 out

$IPF *** allow tcp from any to any 10051 in
$IPF *** allow tcp from any to any 10051 out
# service ipfw restart
2. Configuration in the Zabbix Web UI
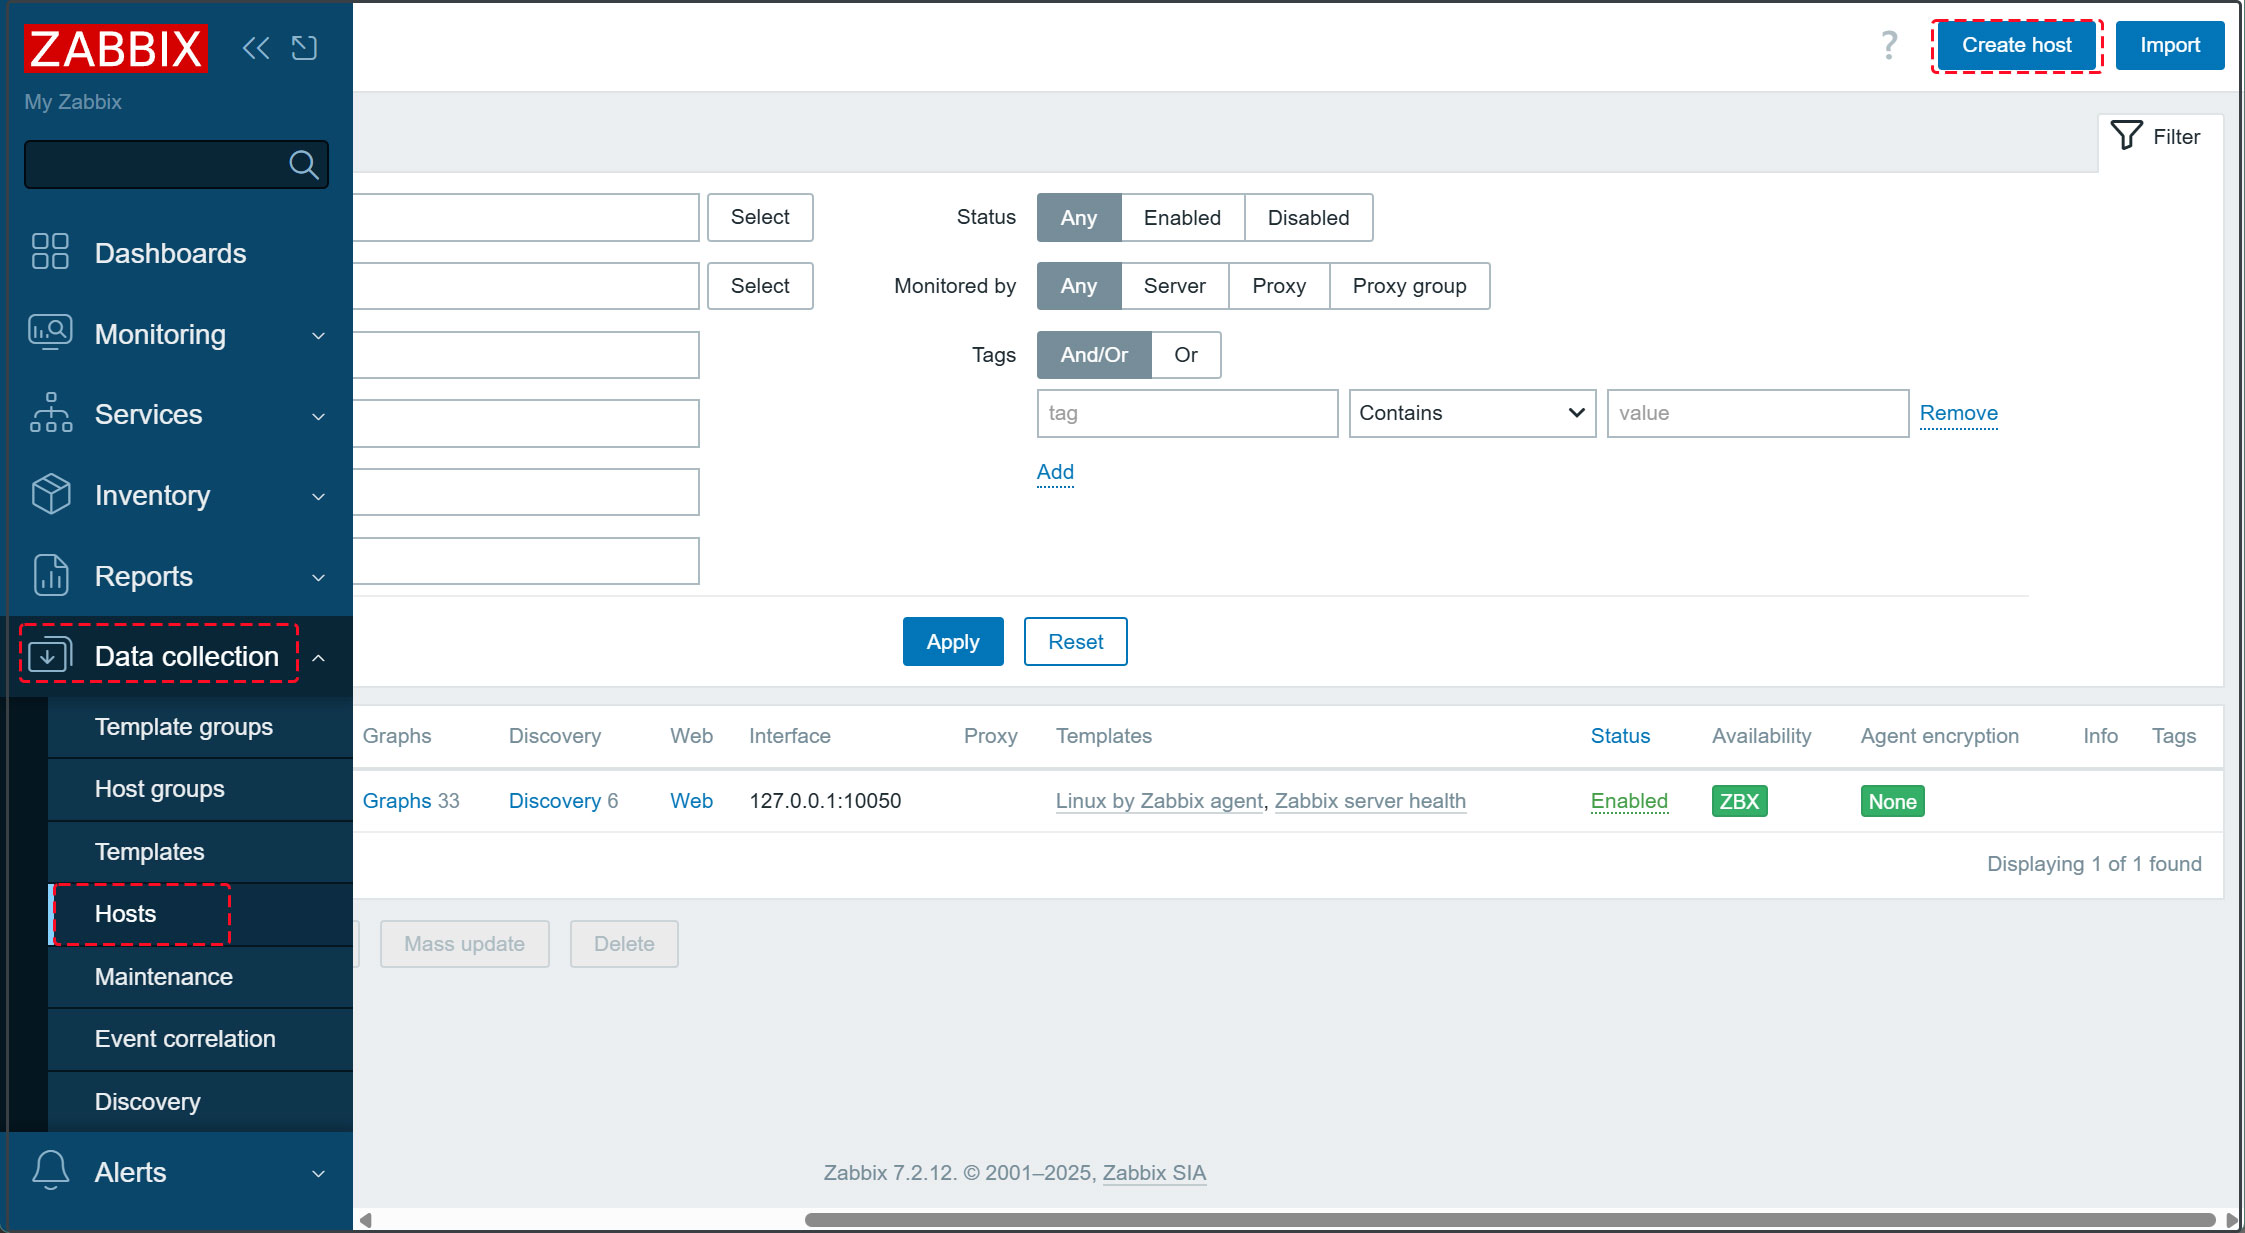
2.1 Log in to the Zabbix management site, select [Datacollection] - [Hosts] in the left pane, and click the [Create Host] button at the top of the right pane.
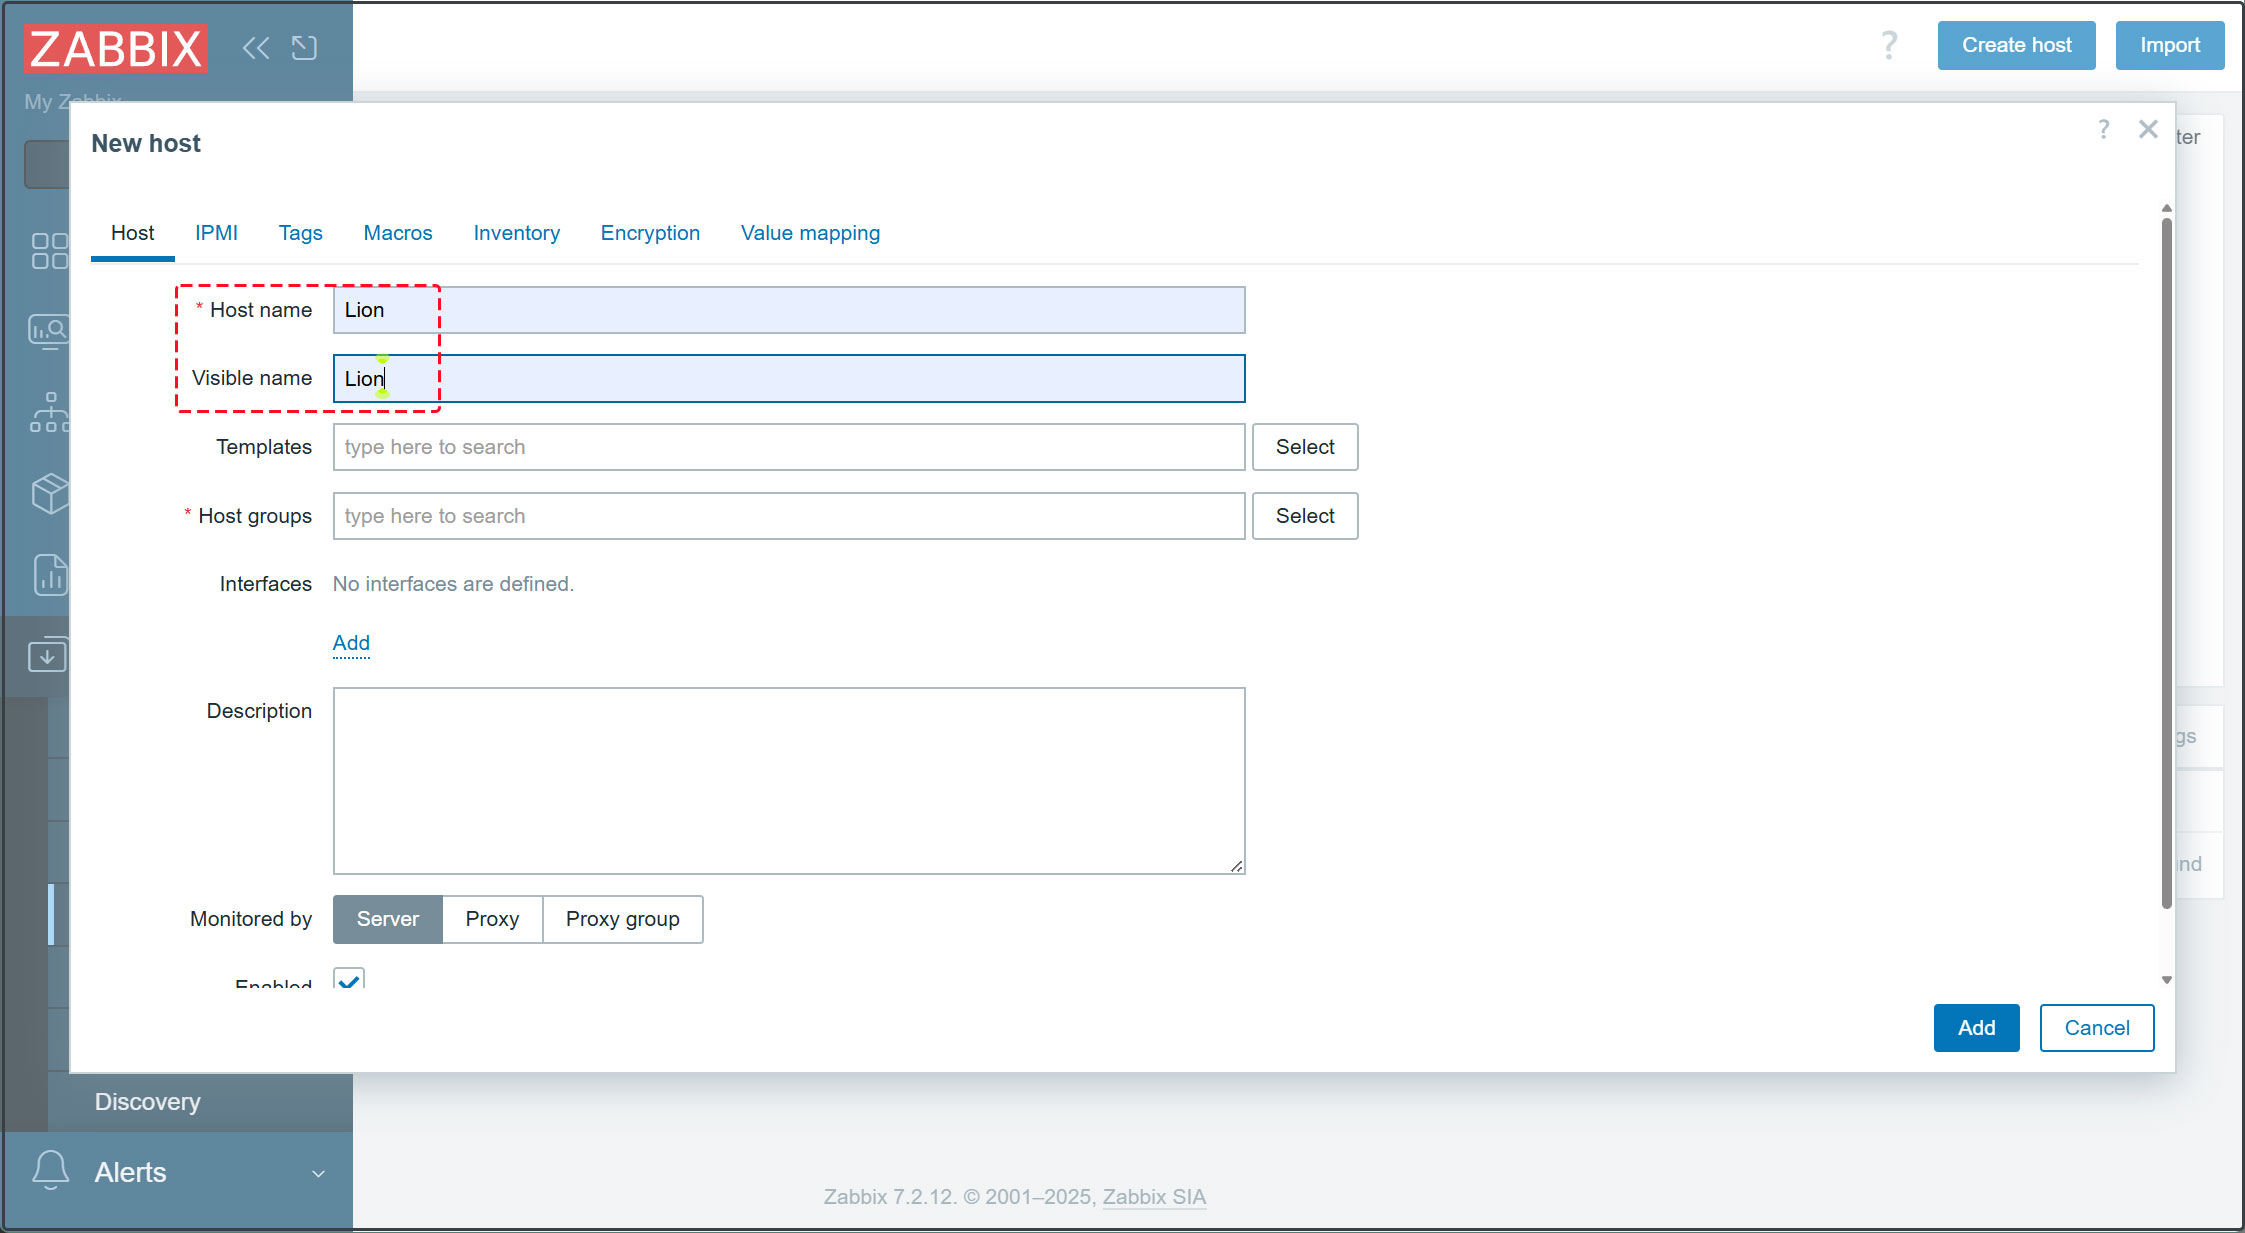
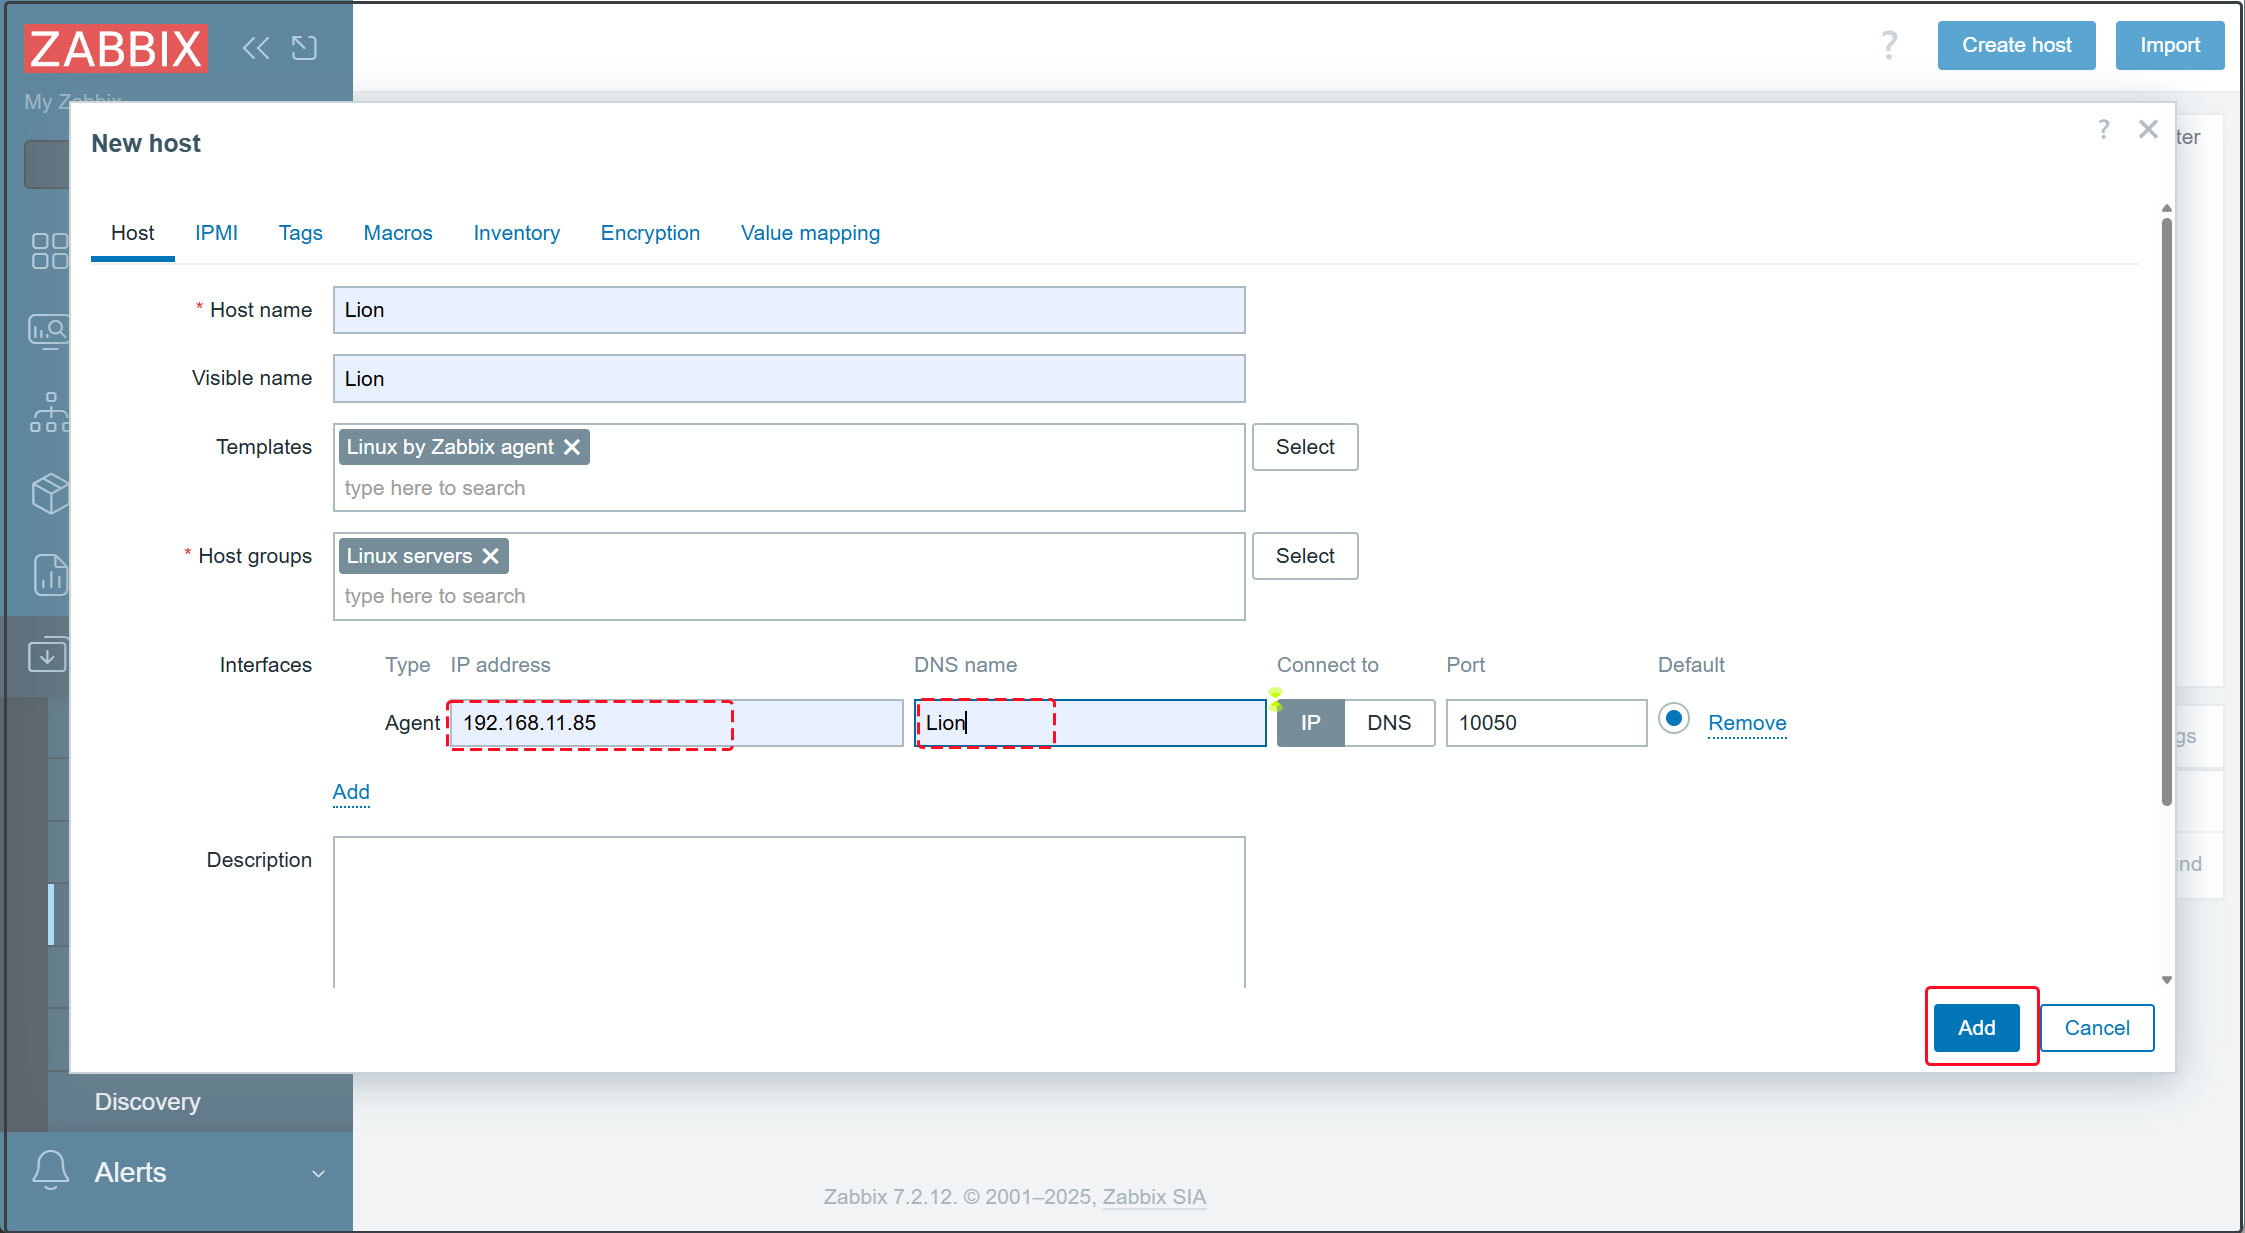
2.2 Enter the hostname in [Hostname] (Lion in this case), and set the name to be displayed in [Visible name] (Lion in this case).
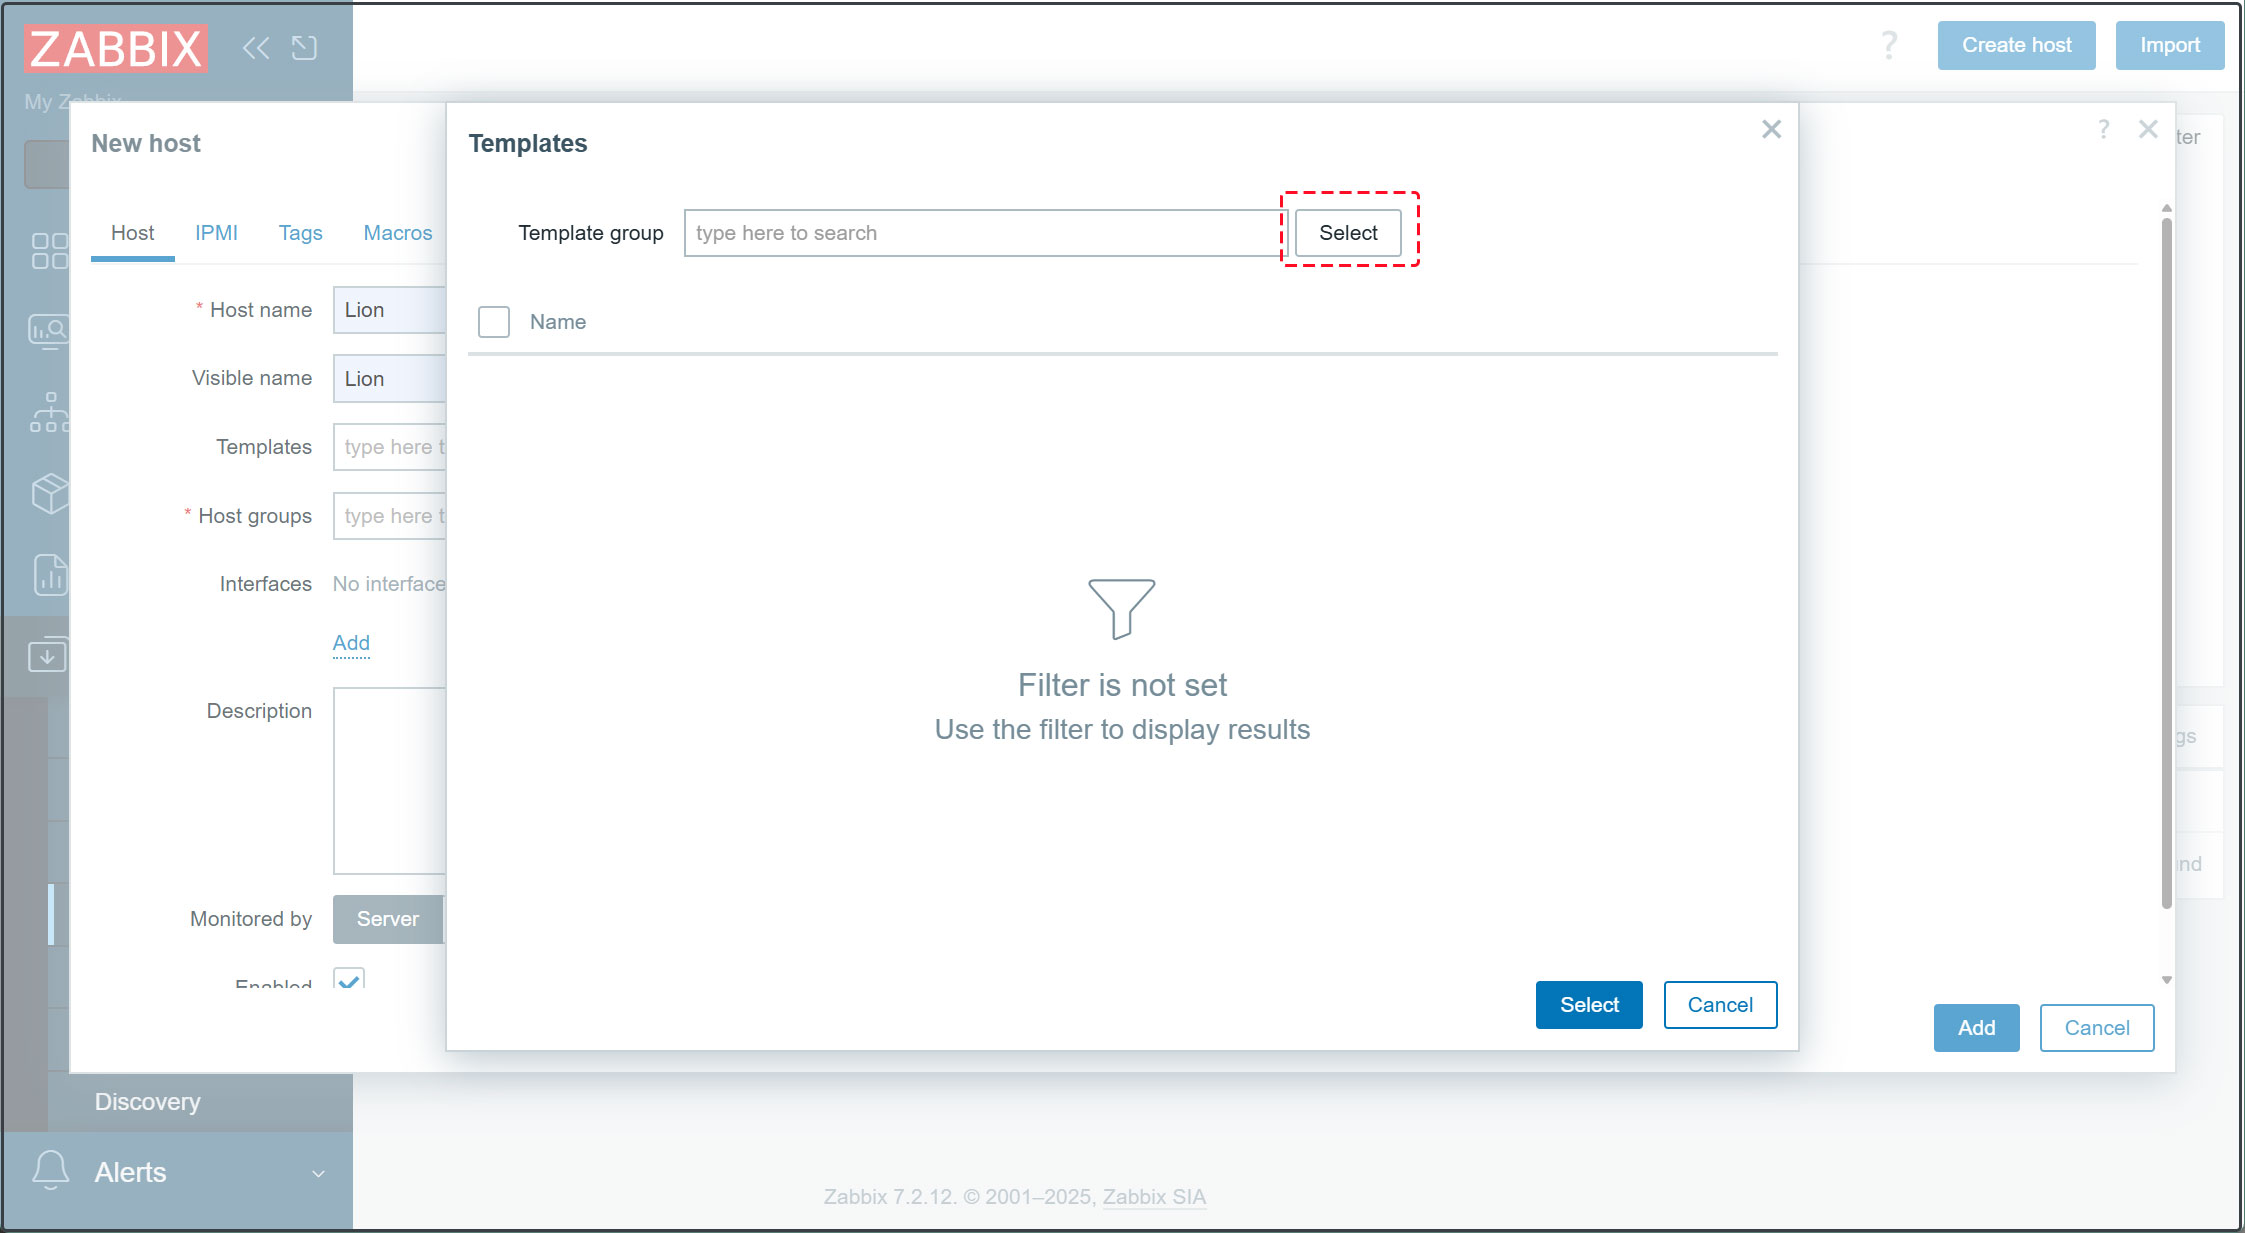
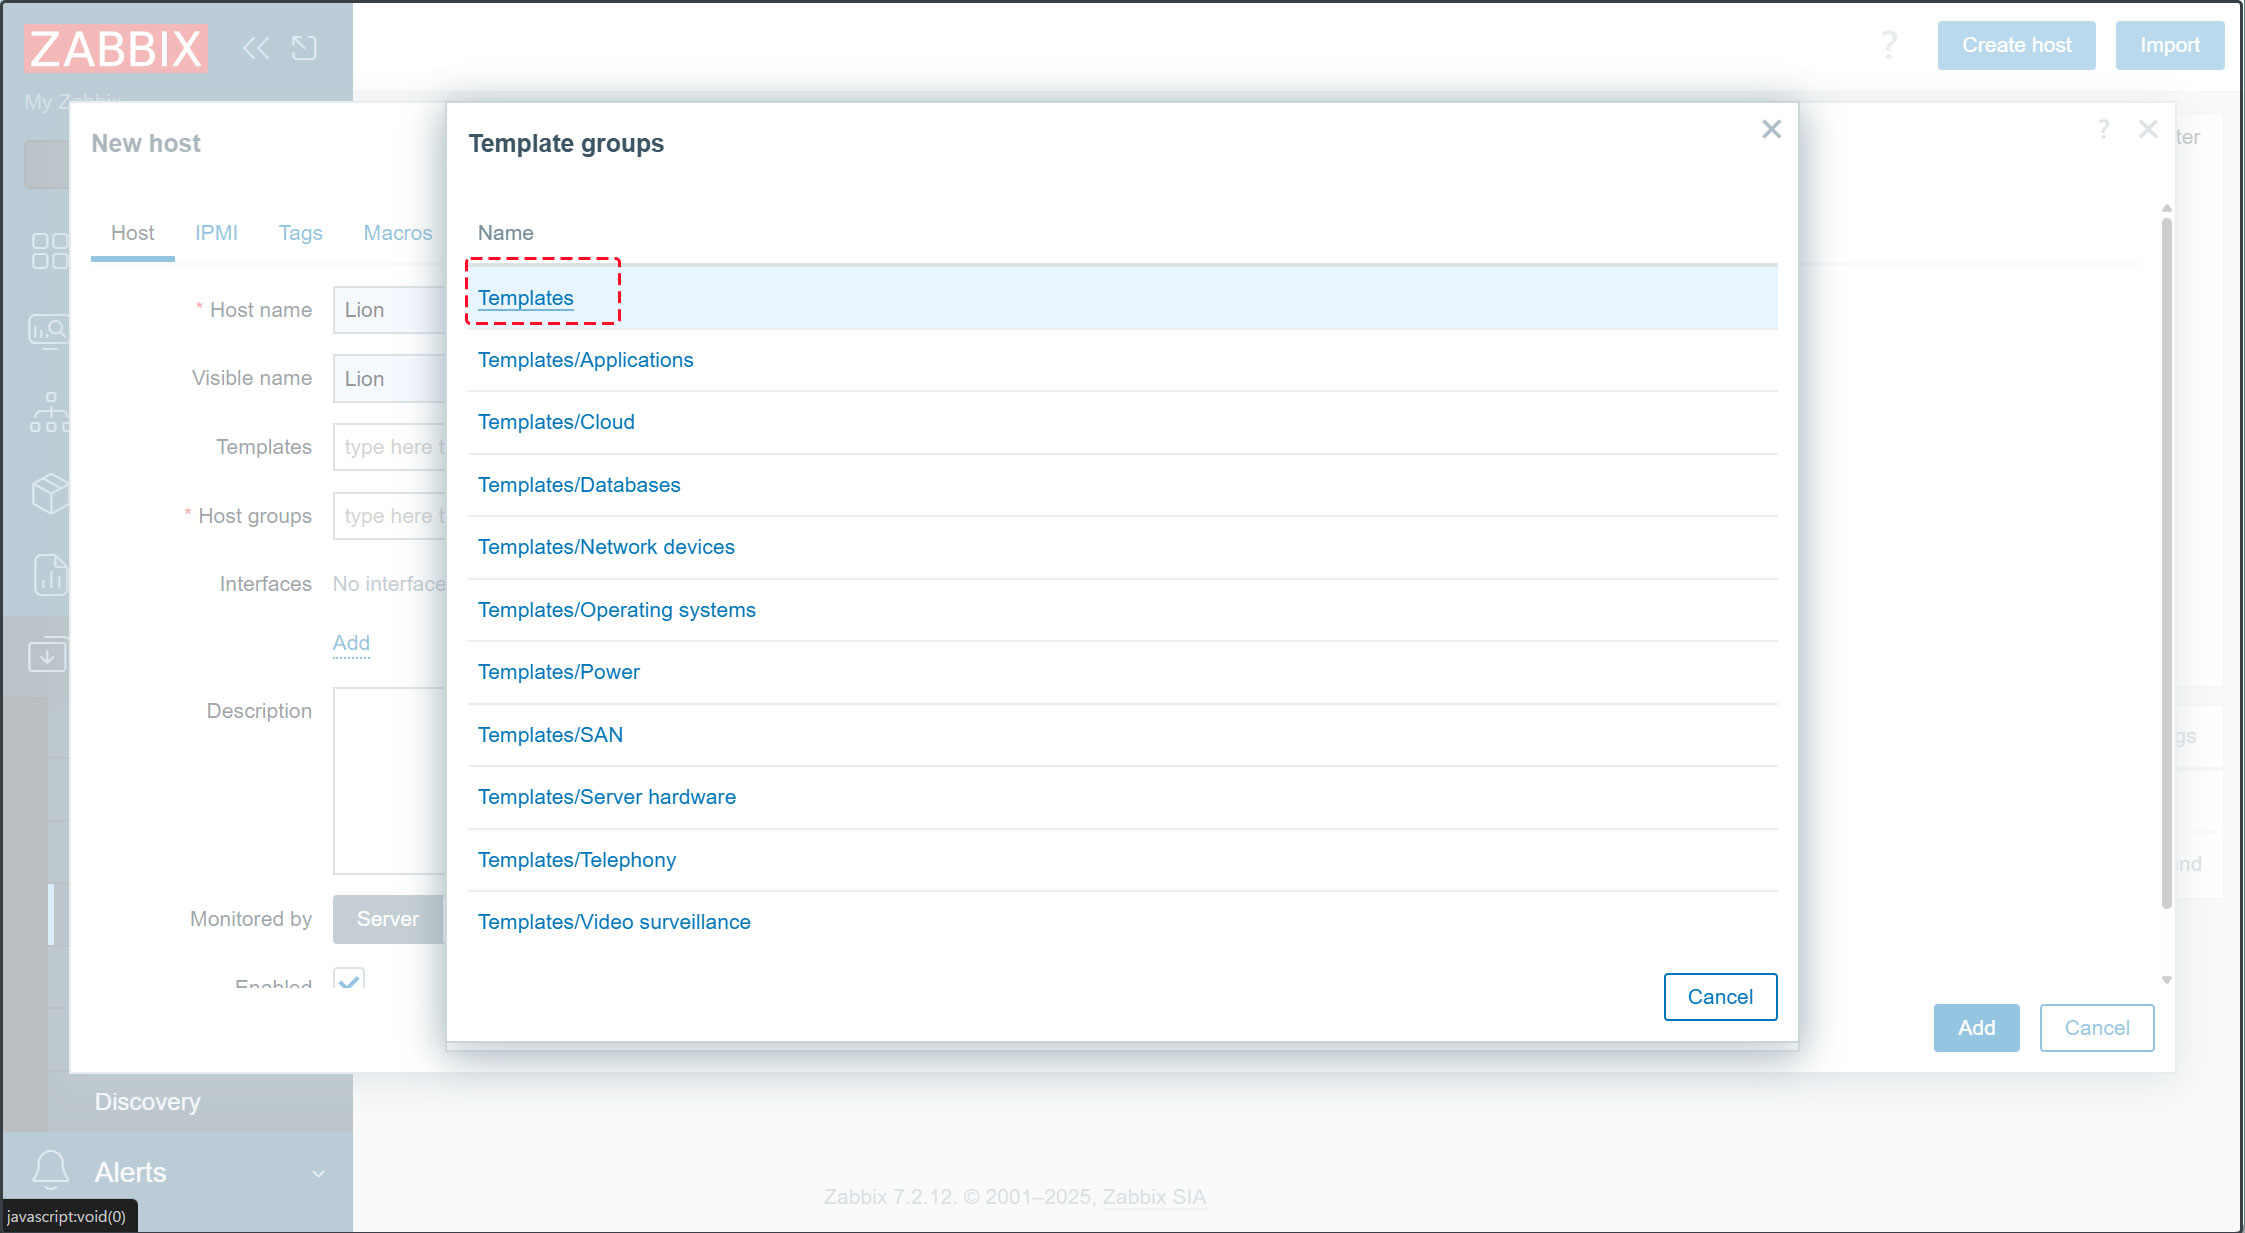
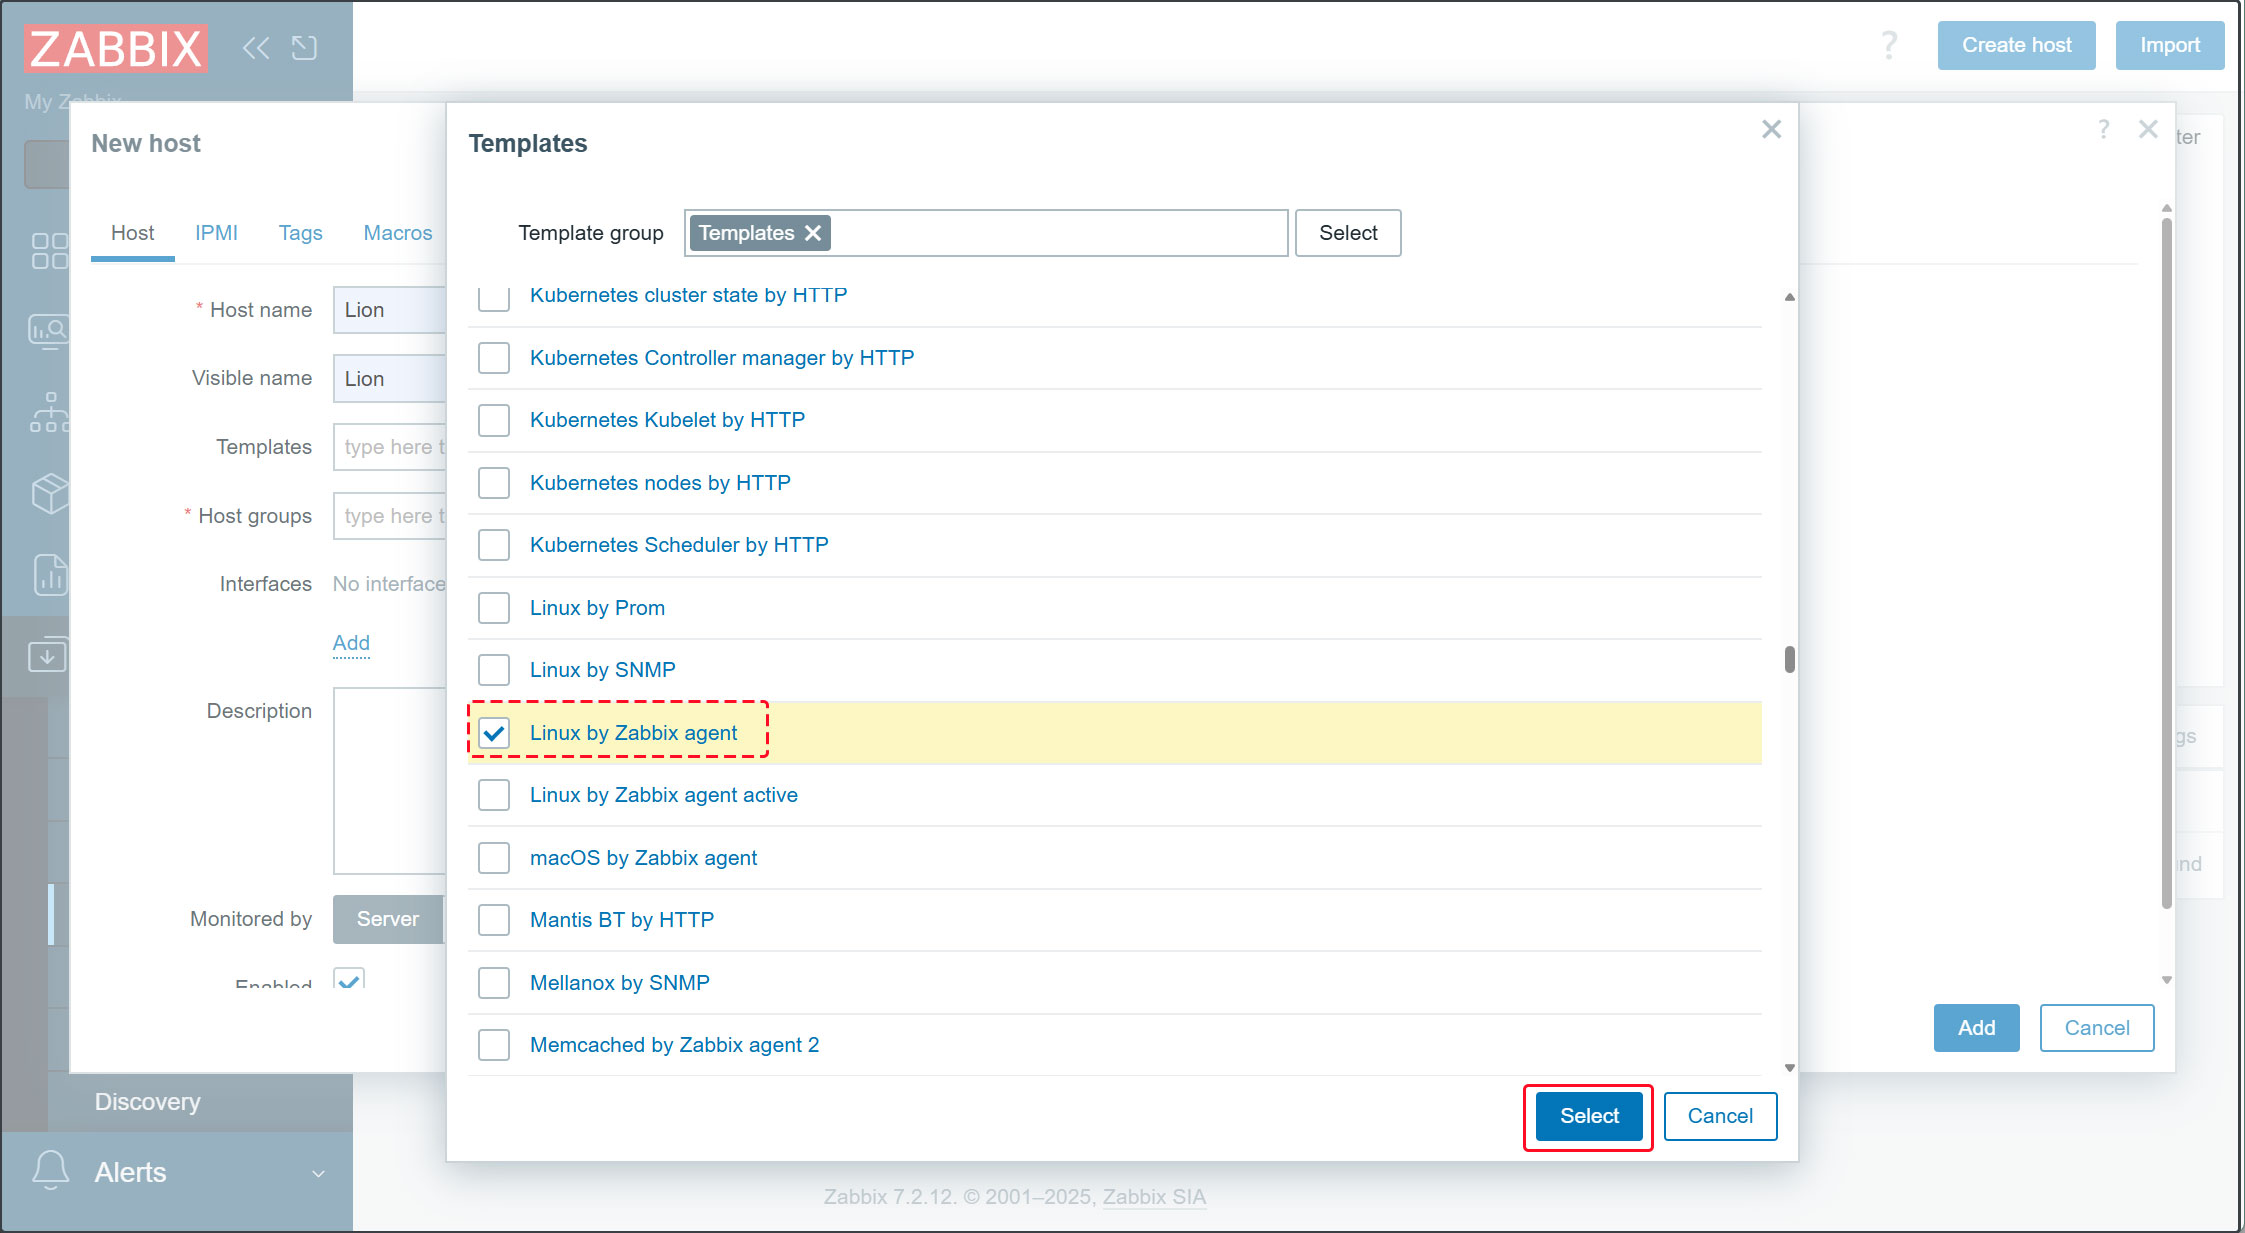
2.3 [Templates] Click the [Select] button. For [Template group], click [Select] and choose [Templates]. From the list of monitoring templates, select [Linux by Zabbix agent] to monitor common items like CPU on Linux OS. Click [Select] at the bottom.
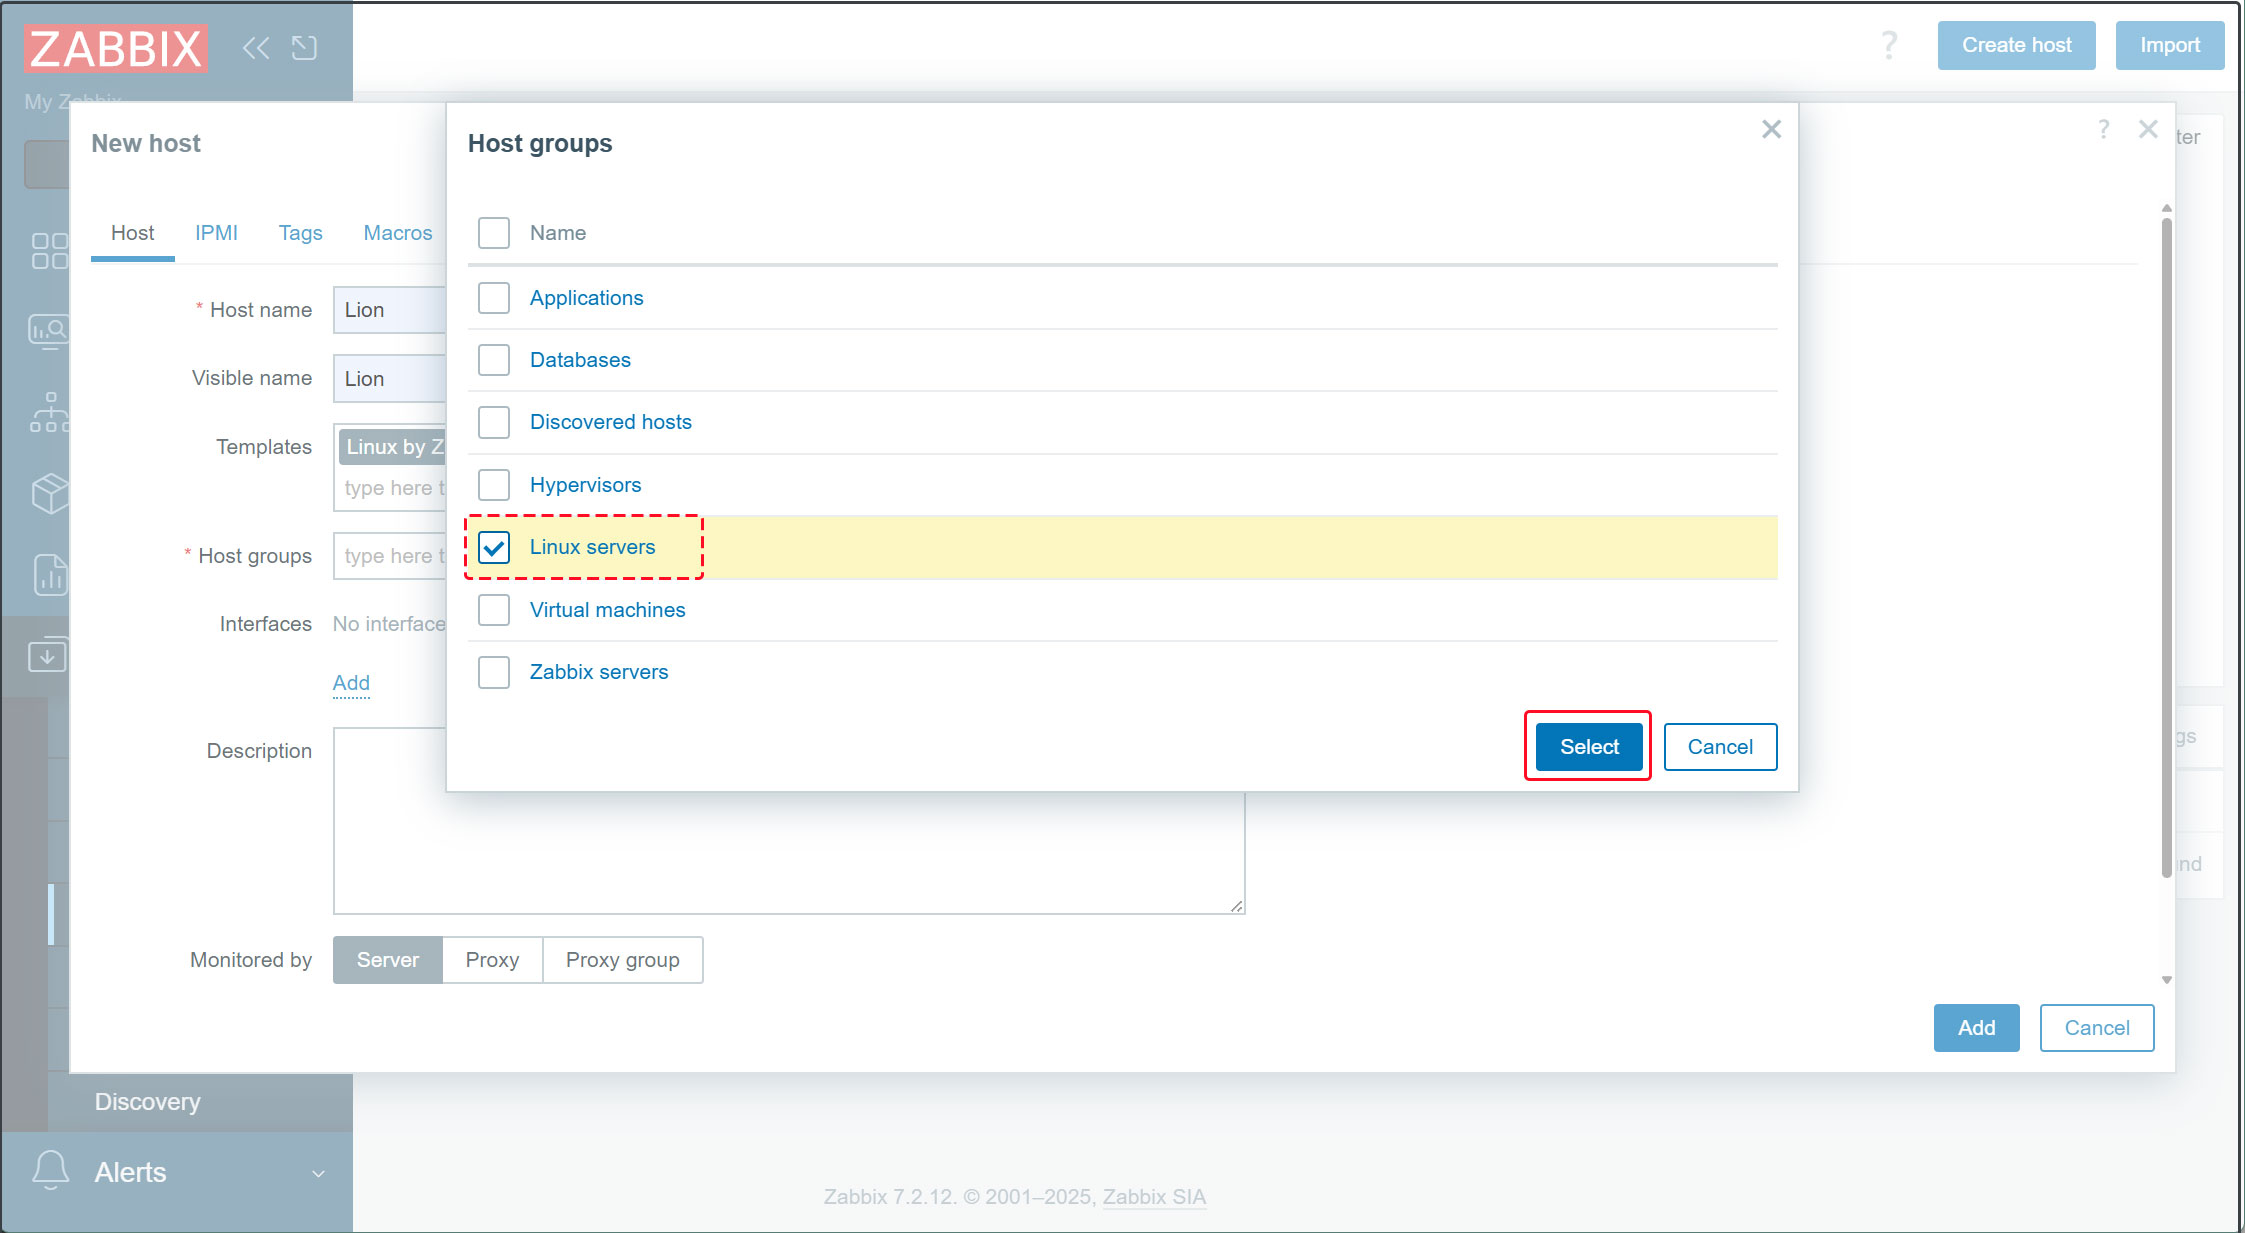
2.4Select [Linux servers] for [Host groups]
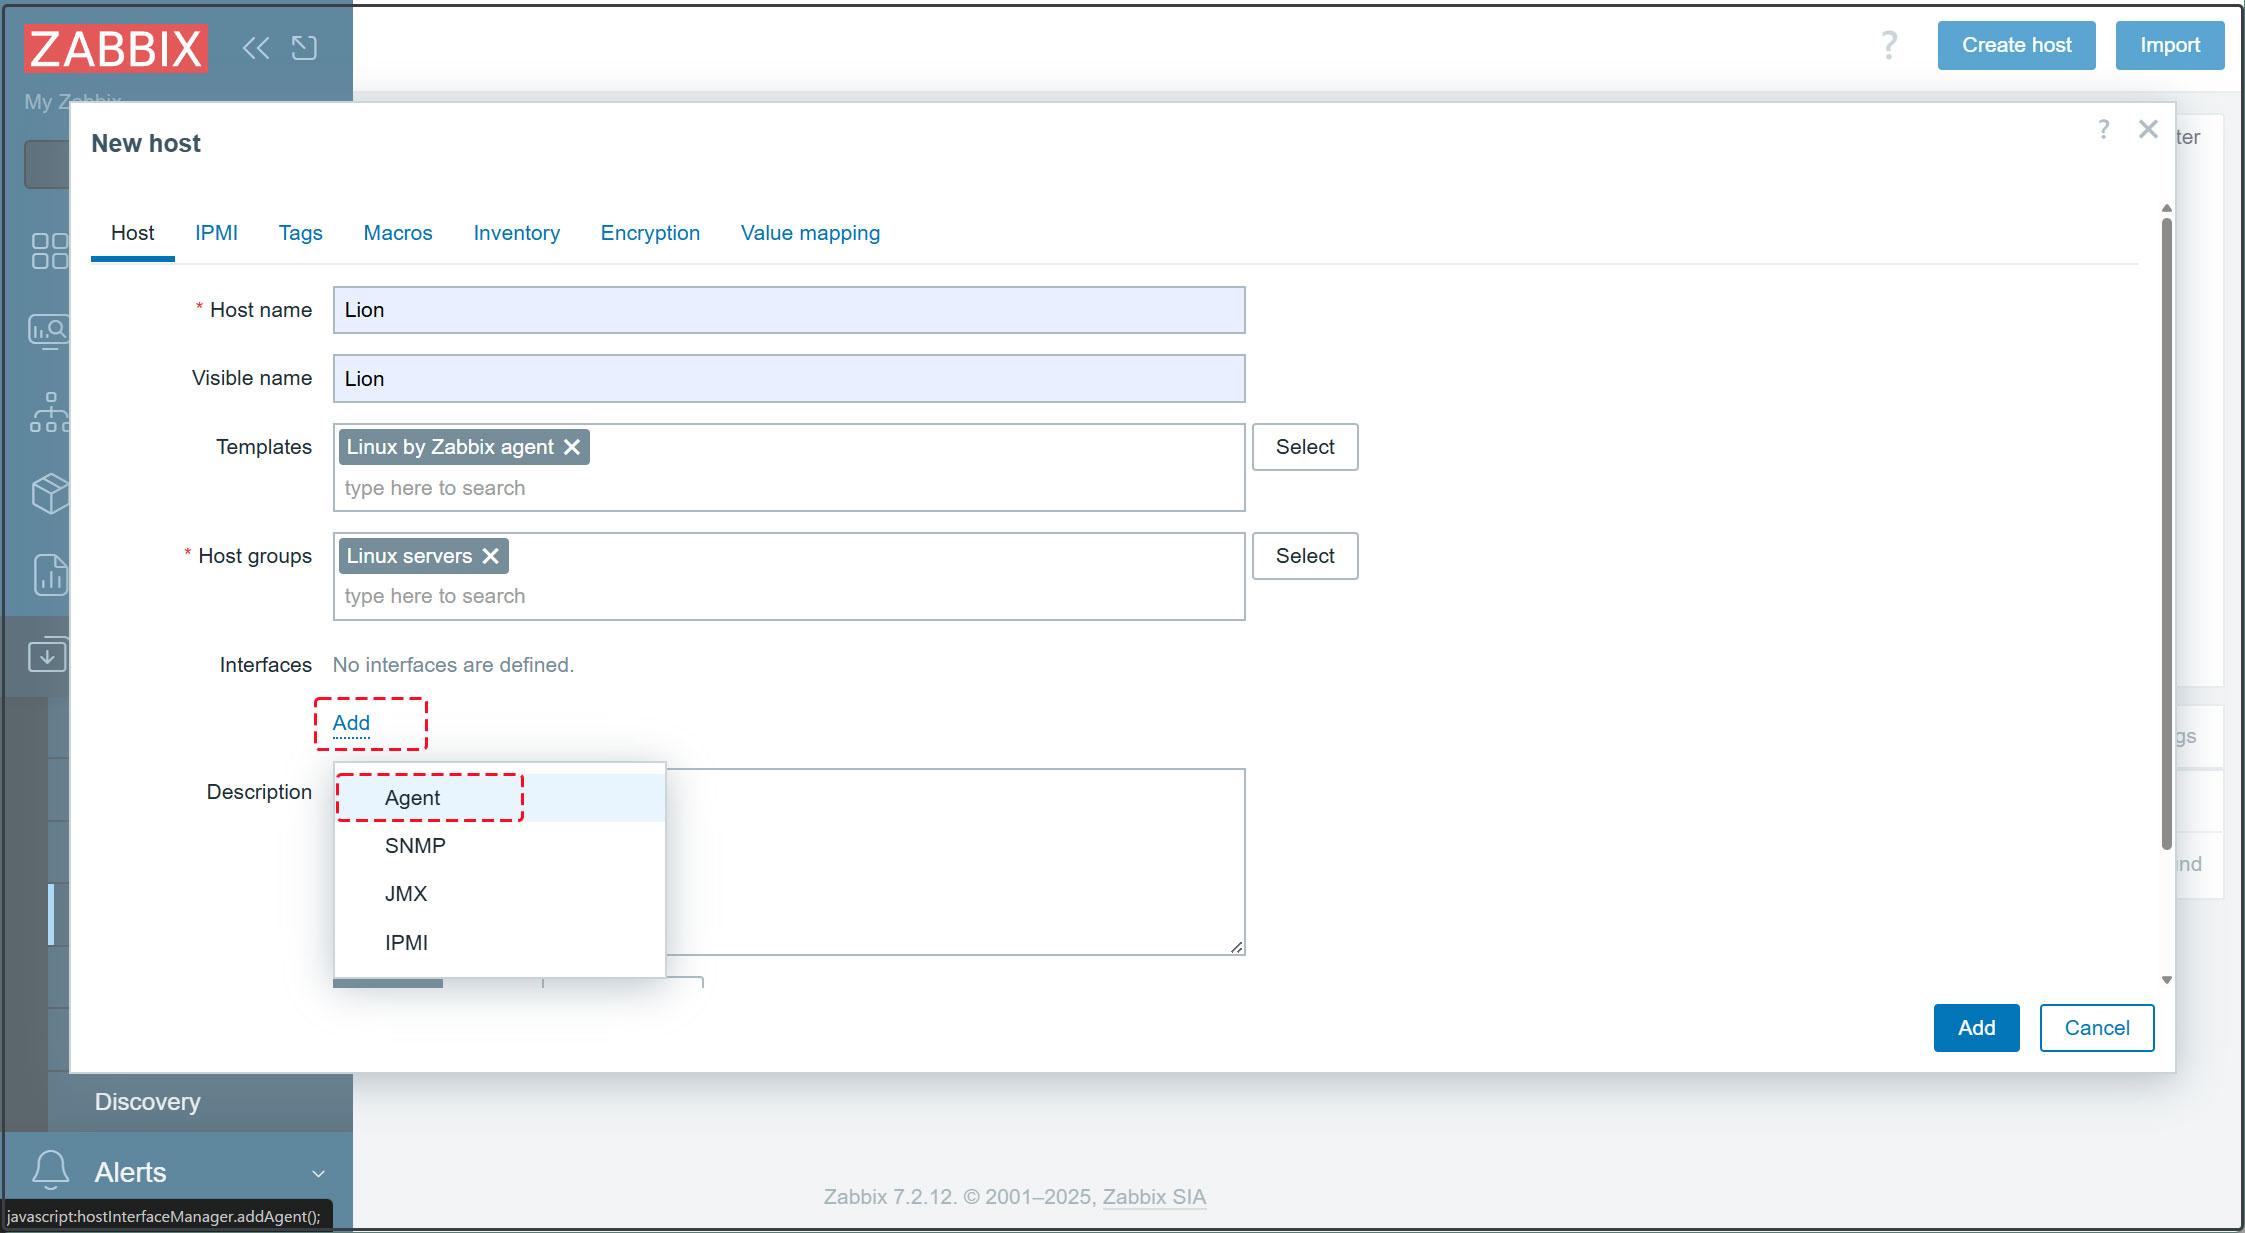
2.5 [Interfaces] Click [Add] within Interfaces, select [Agent], enter the IP address to monitor and the hostname in [DNS name], then click [Add] at the bottom.
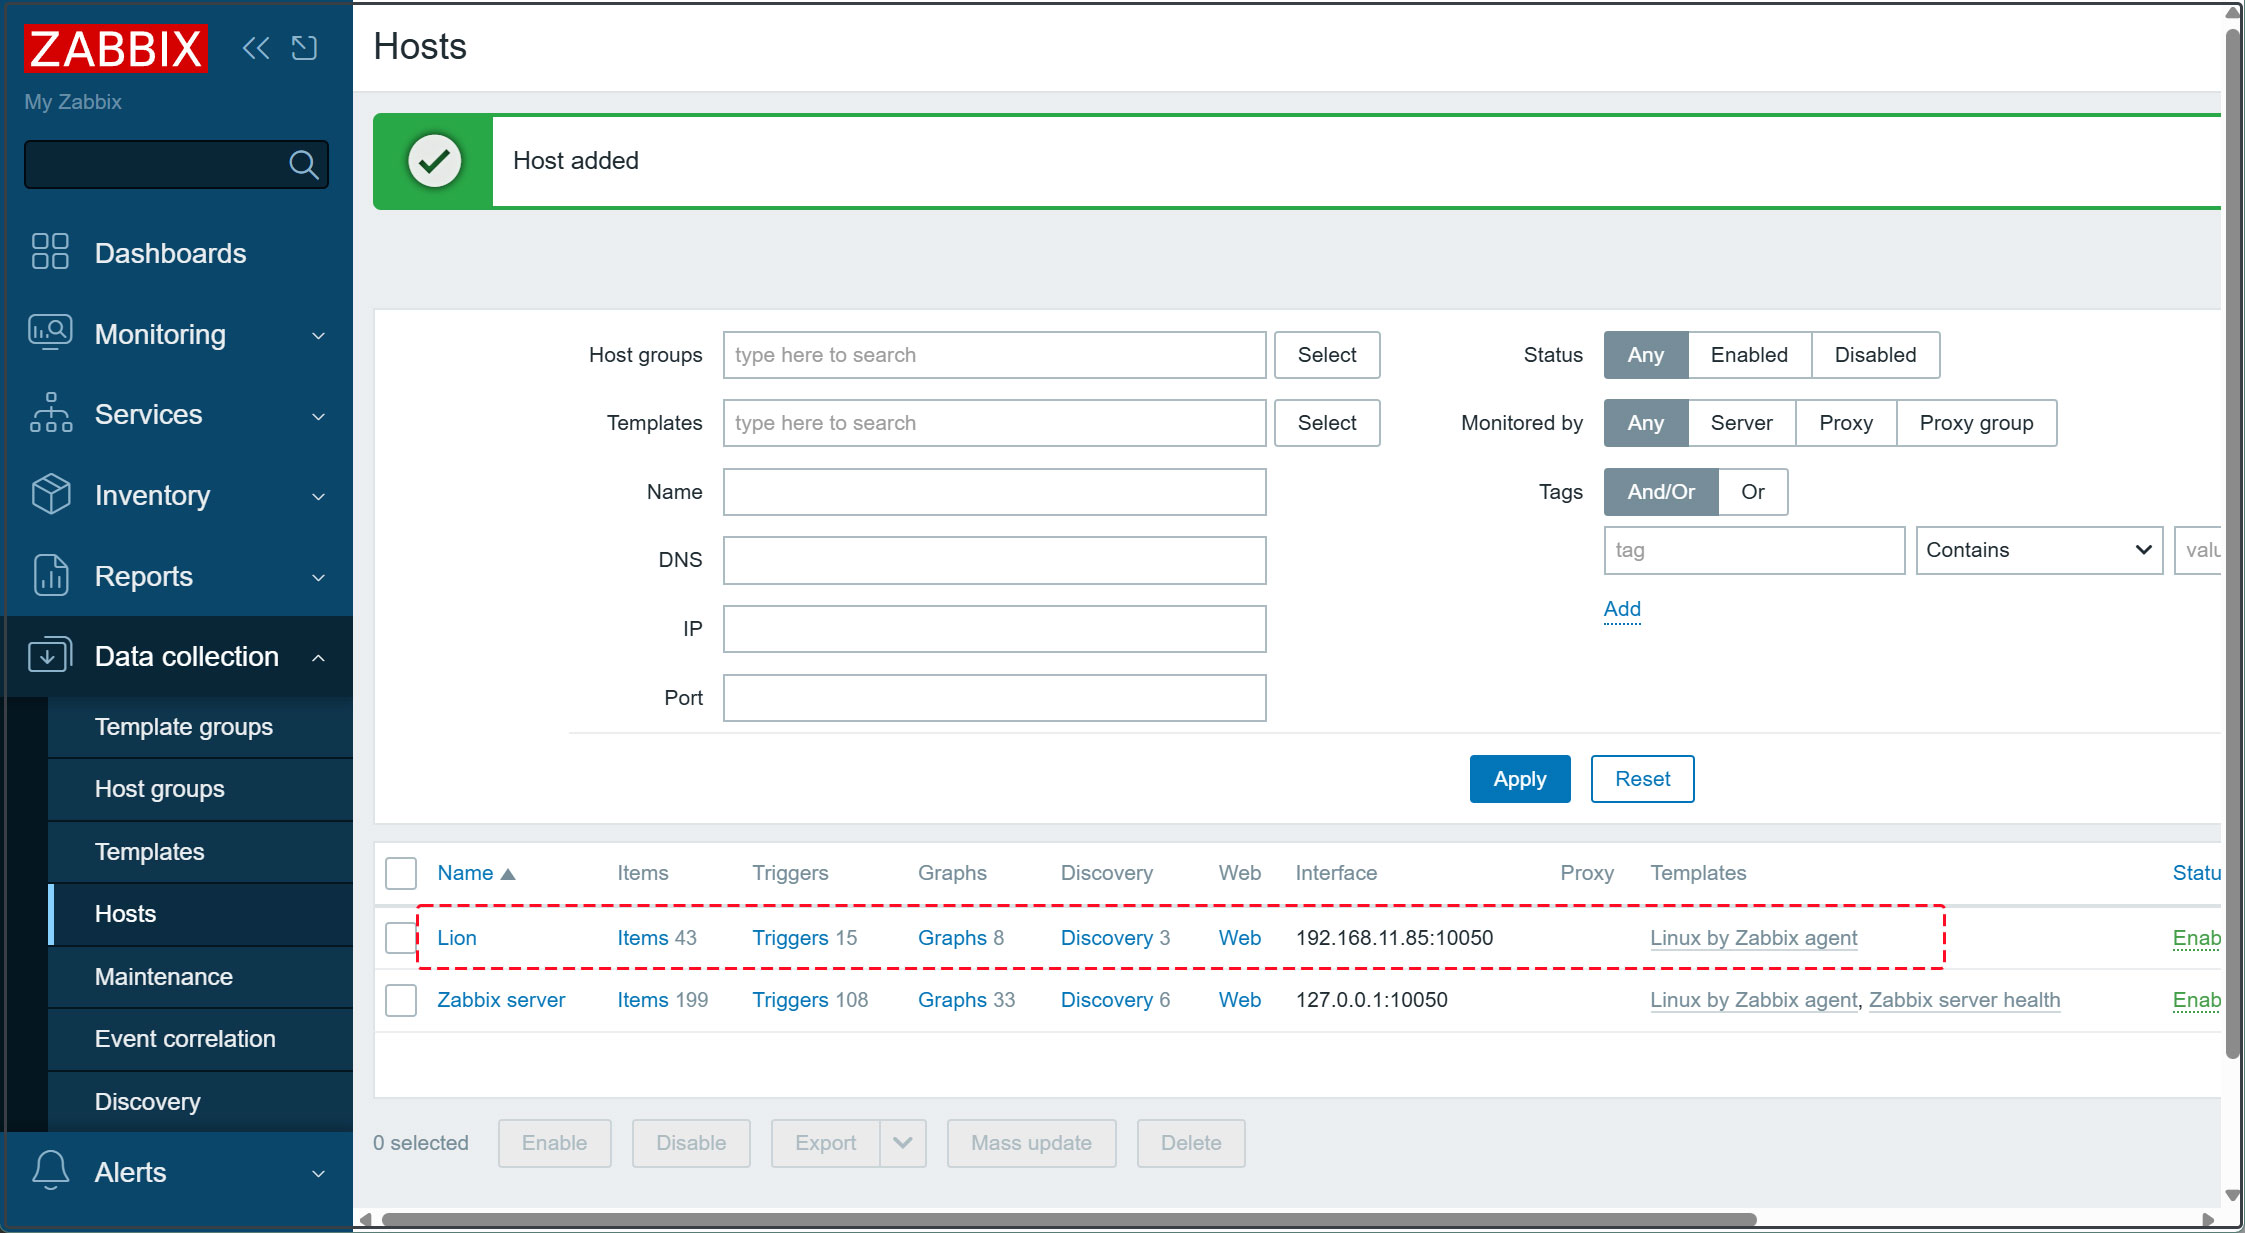
2.6 A new monitored server has been registered.
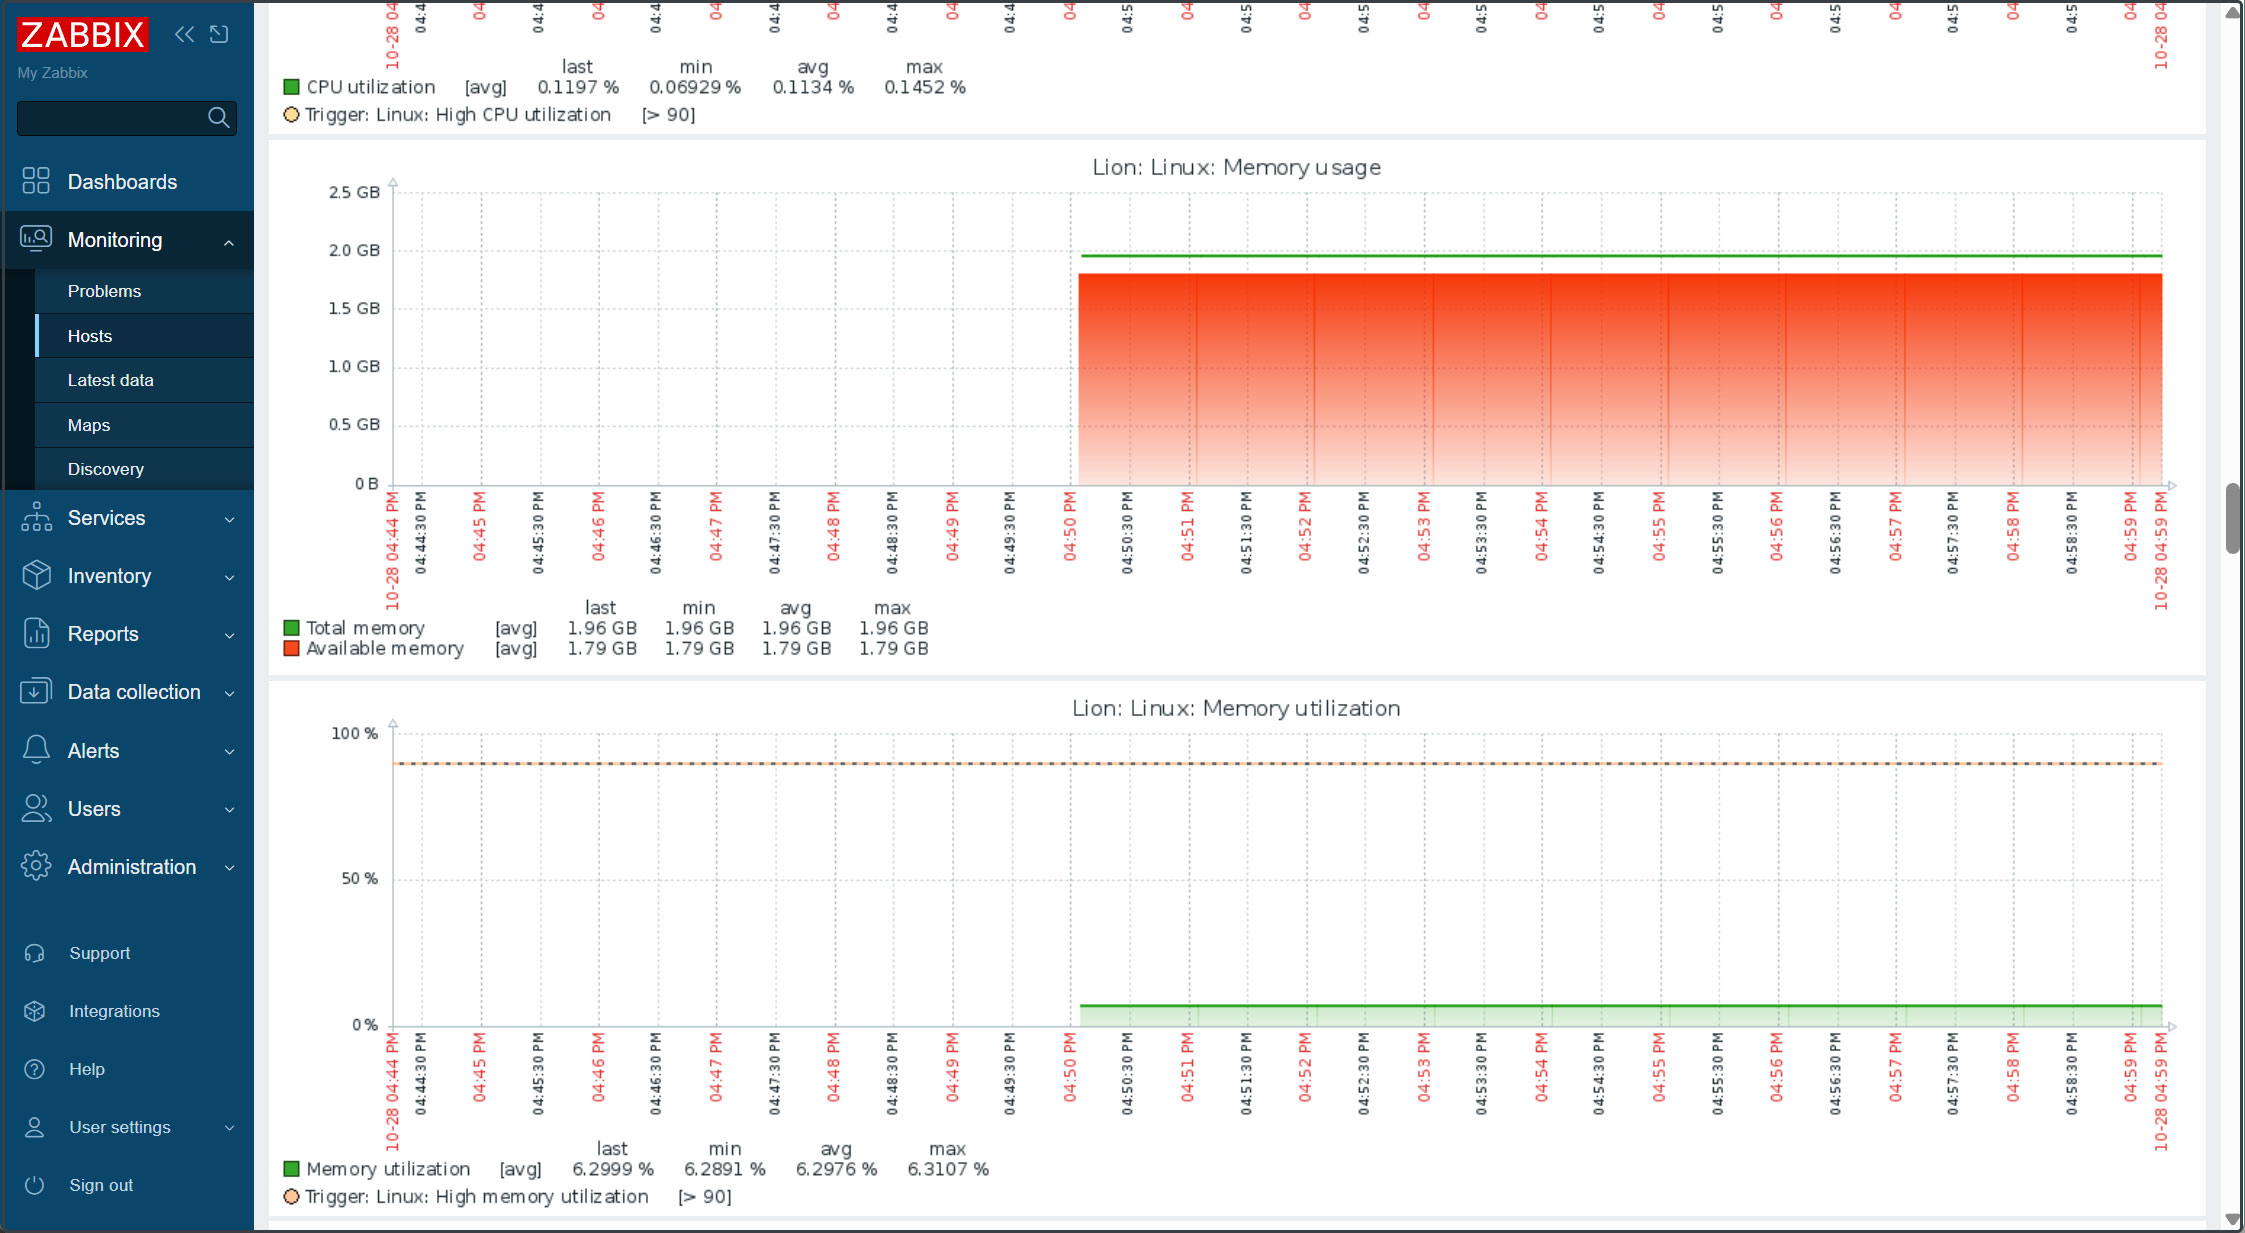
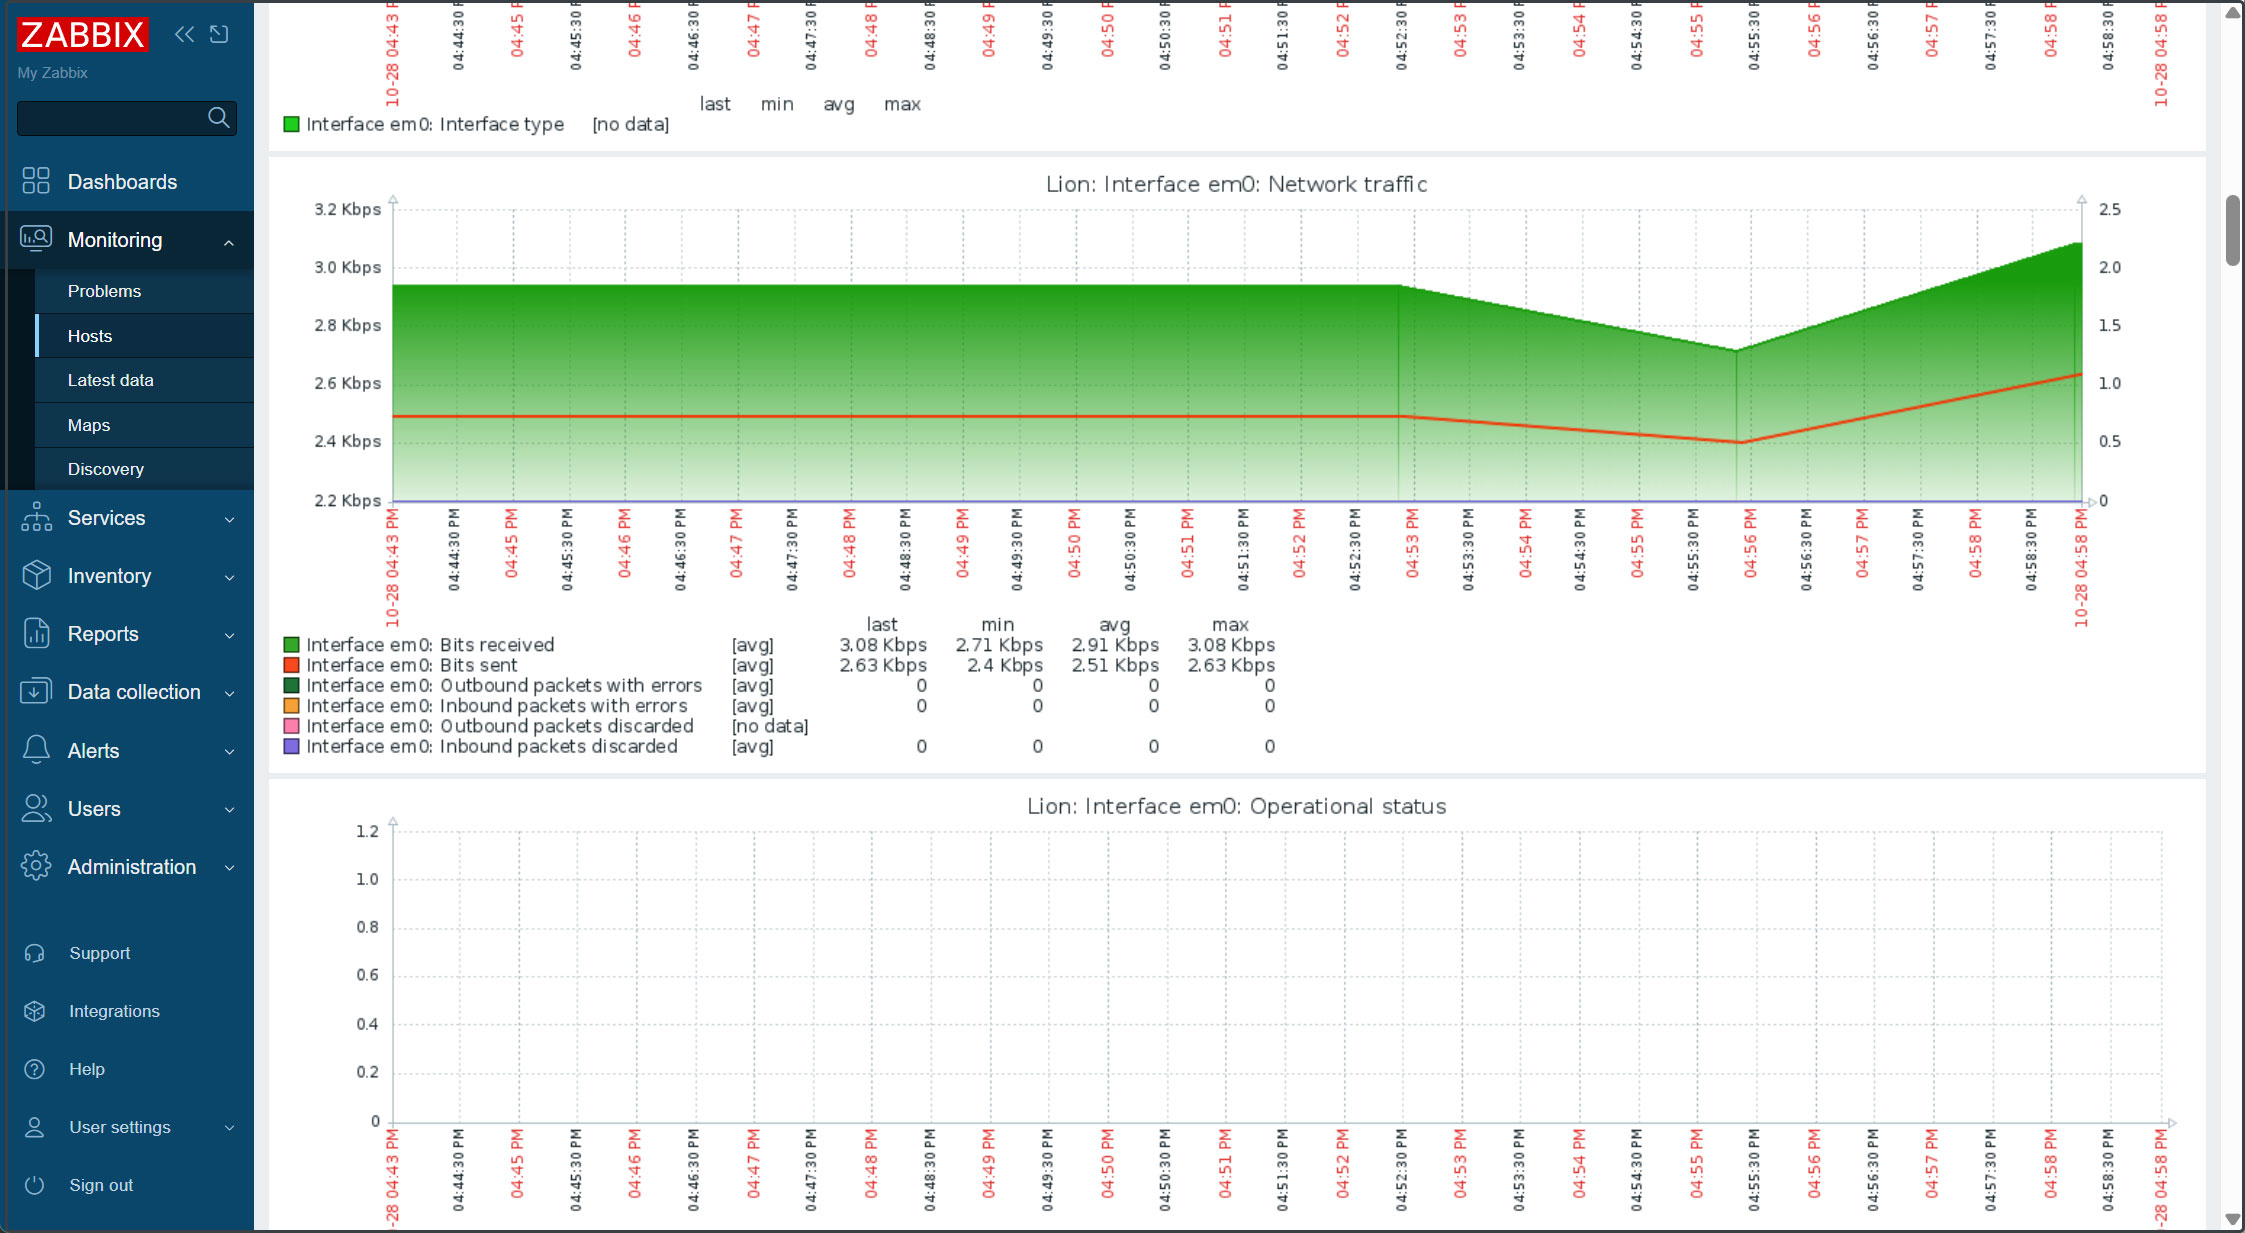
After a short while, data for the added host will begin to appear.
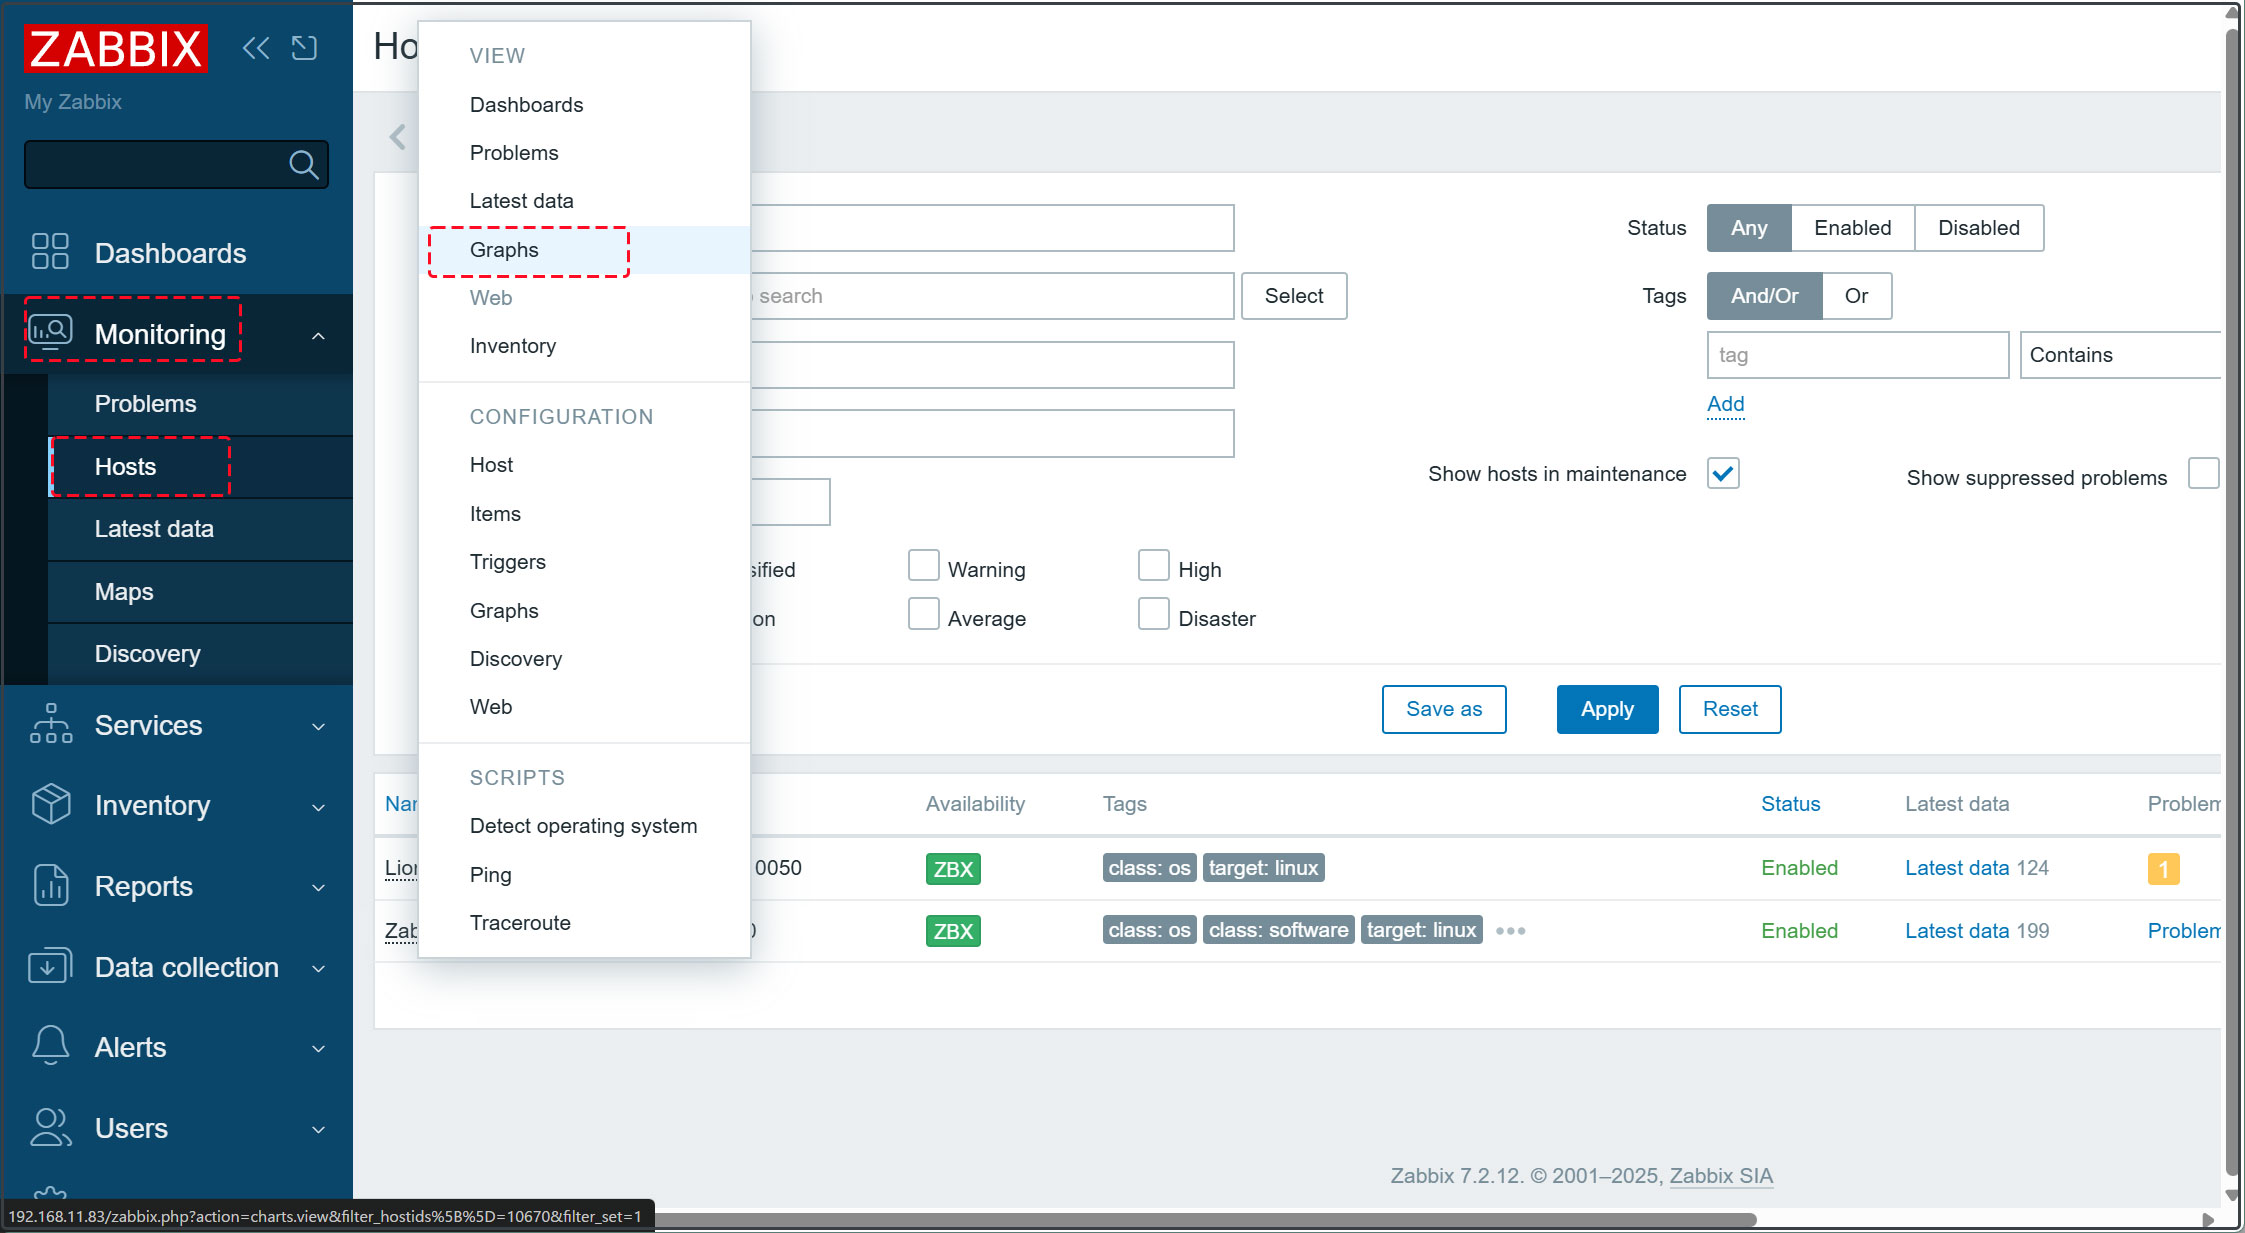
Click [Monitoring][Hosts] in the left pane, then click the added monitored host in the right pane and click [Graphs].
Add monitored items
This time, we will add the Apache httpd service on the Zabbix server to the list of monitored services.
1. Enable server-status in Apache httpd on the Zabbix server to be monitored
Edit the Apache configuration file httpd.conf
 # vi  /usr/local/etc/apache24/httpd.conf

Line 161: Verify that the status_module is enabled.
LoadModule status_module libexec/apache24/mod_status.so

Add the following to the last line
<Location /server-status>
    SetHandler server-status
    Require local
</Location>
# service apache24 restart
2.Log in to the Zabbix management site, click [Data collection] - [Hosts] in the left pane, and then click the host you want to add monitoring items to in the right pane (in this case, the Zabbix server).
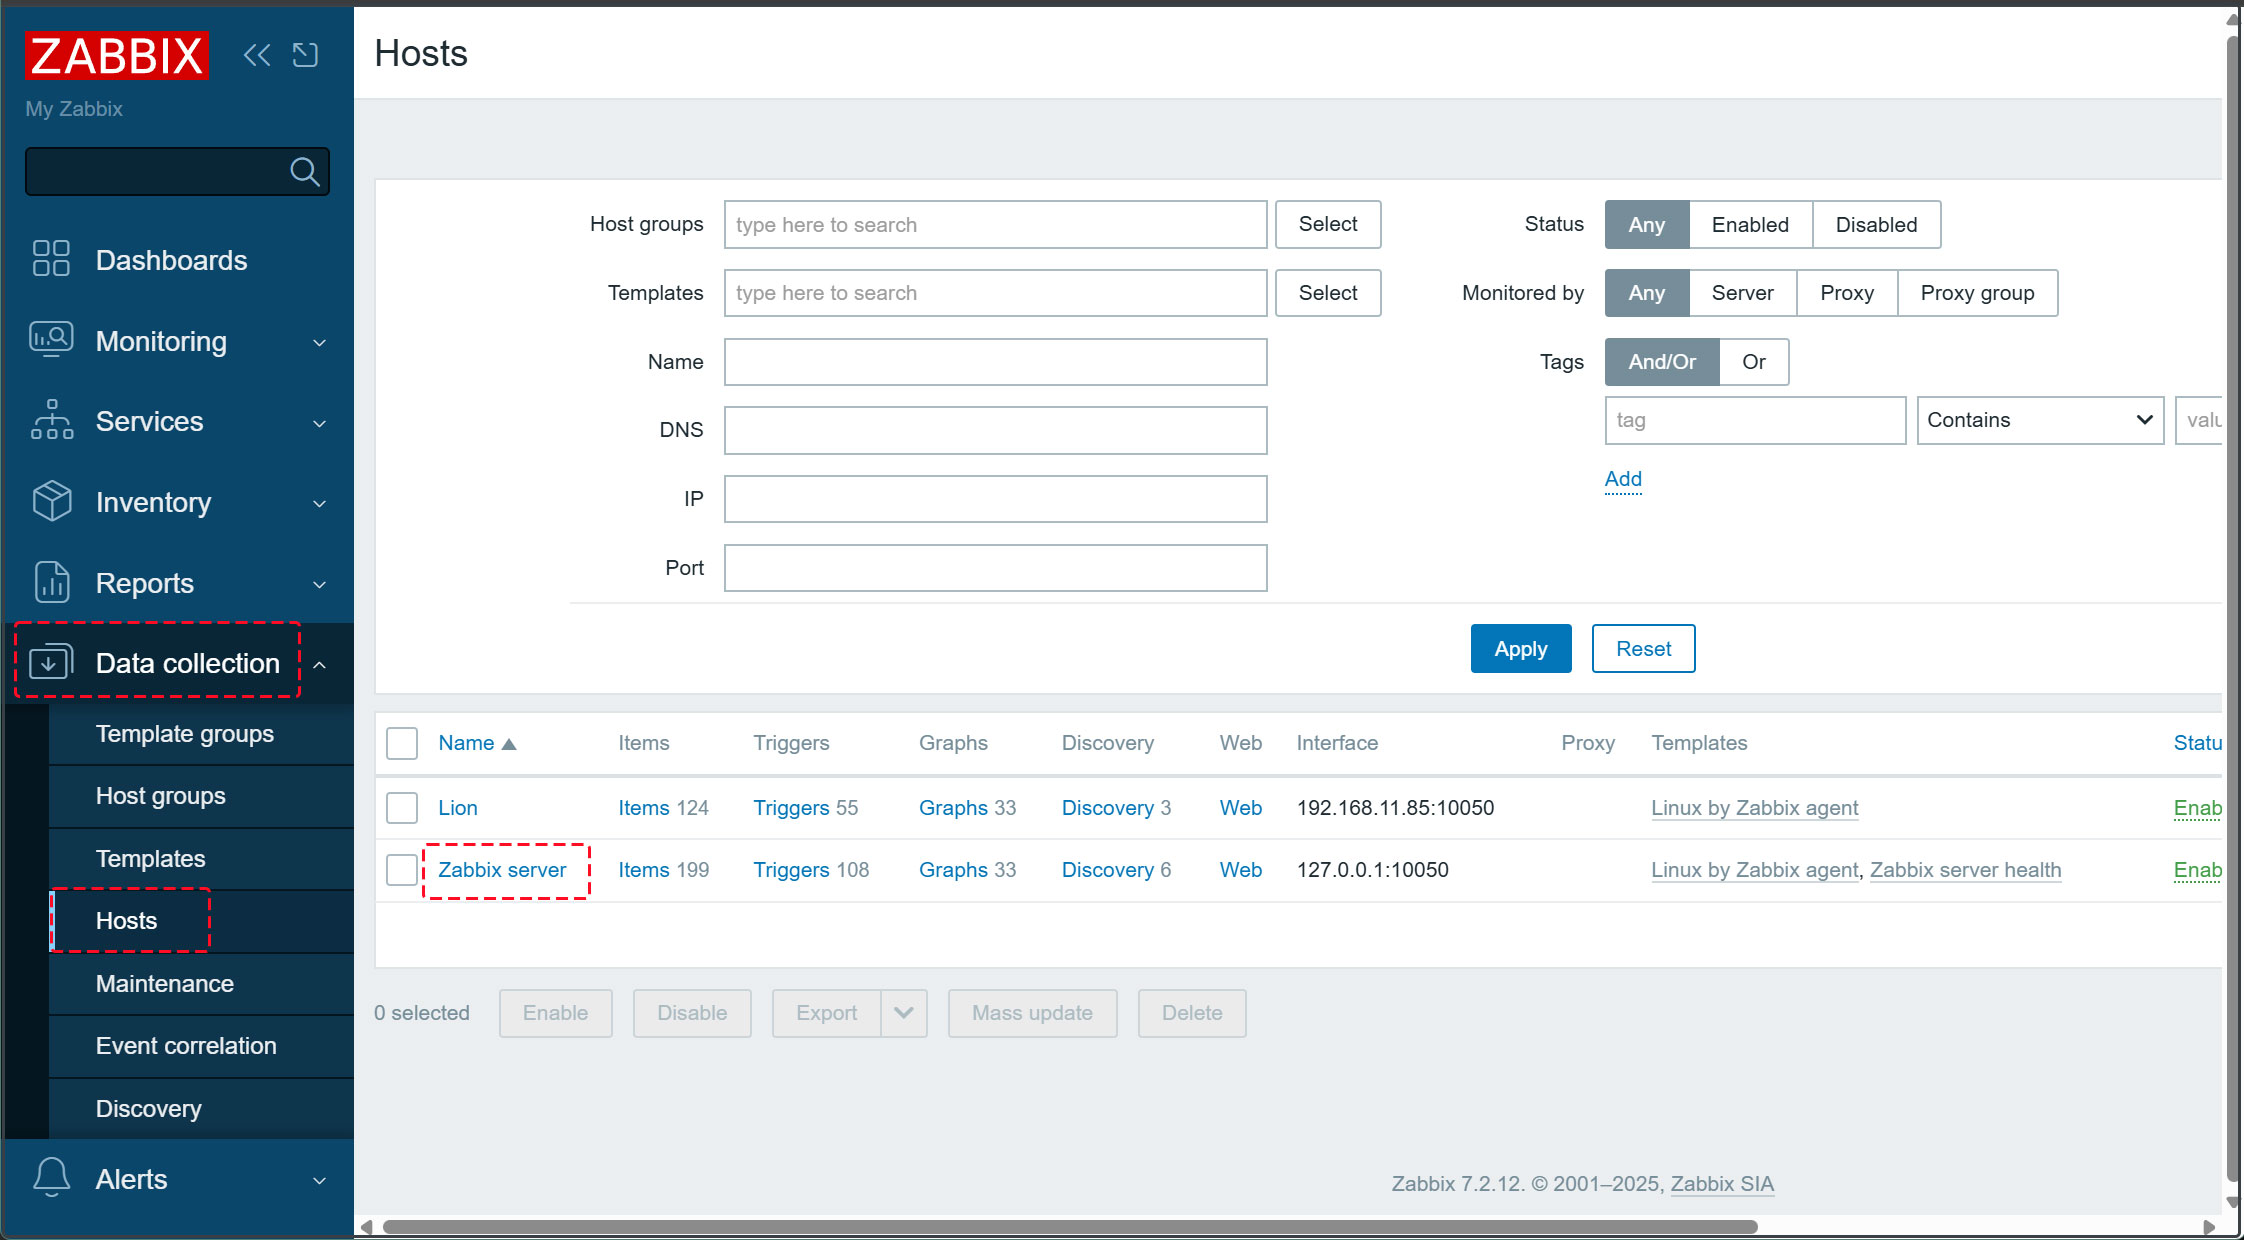
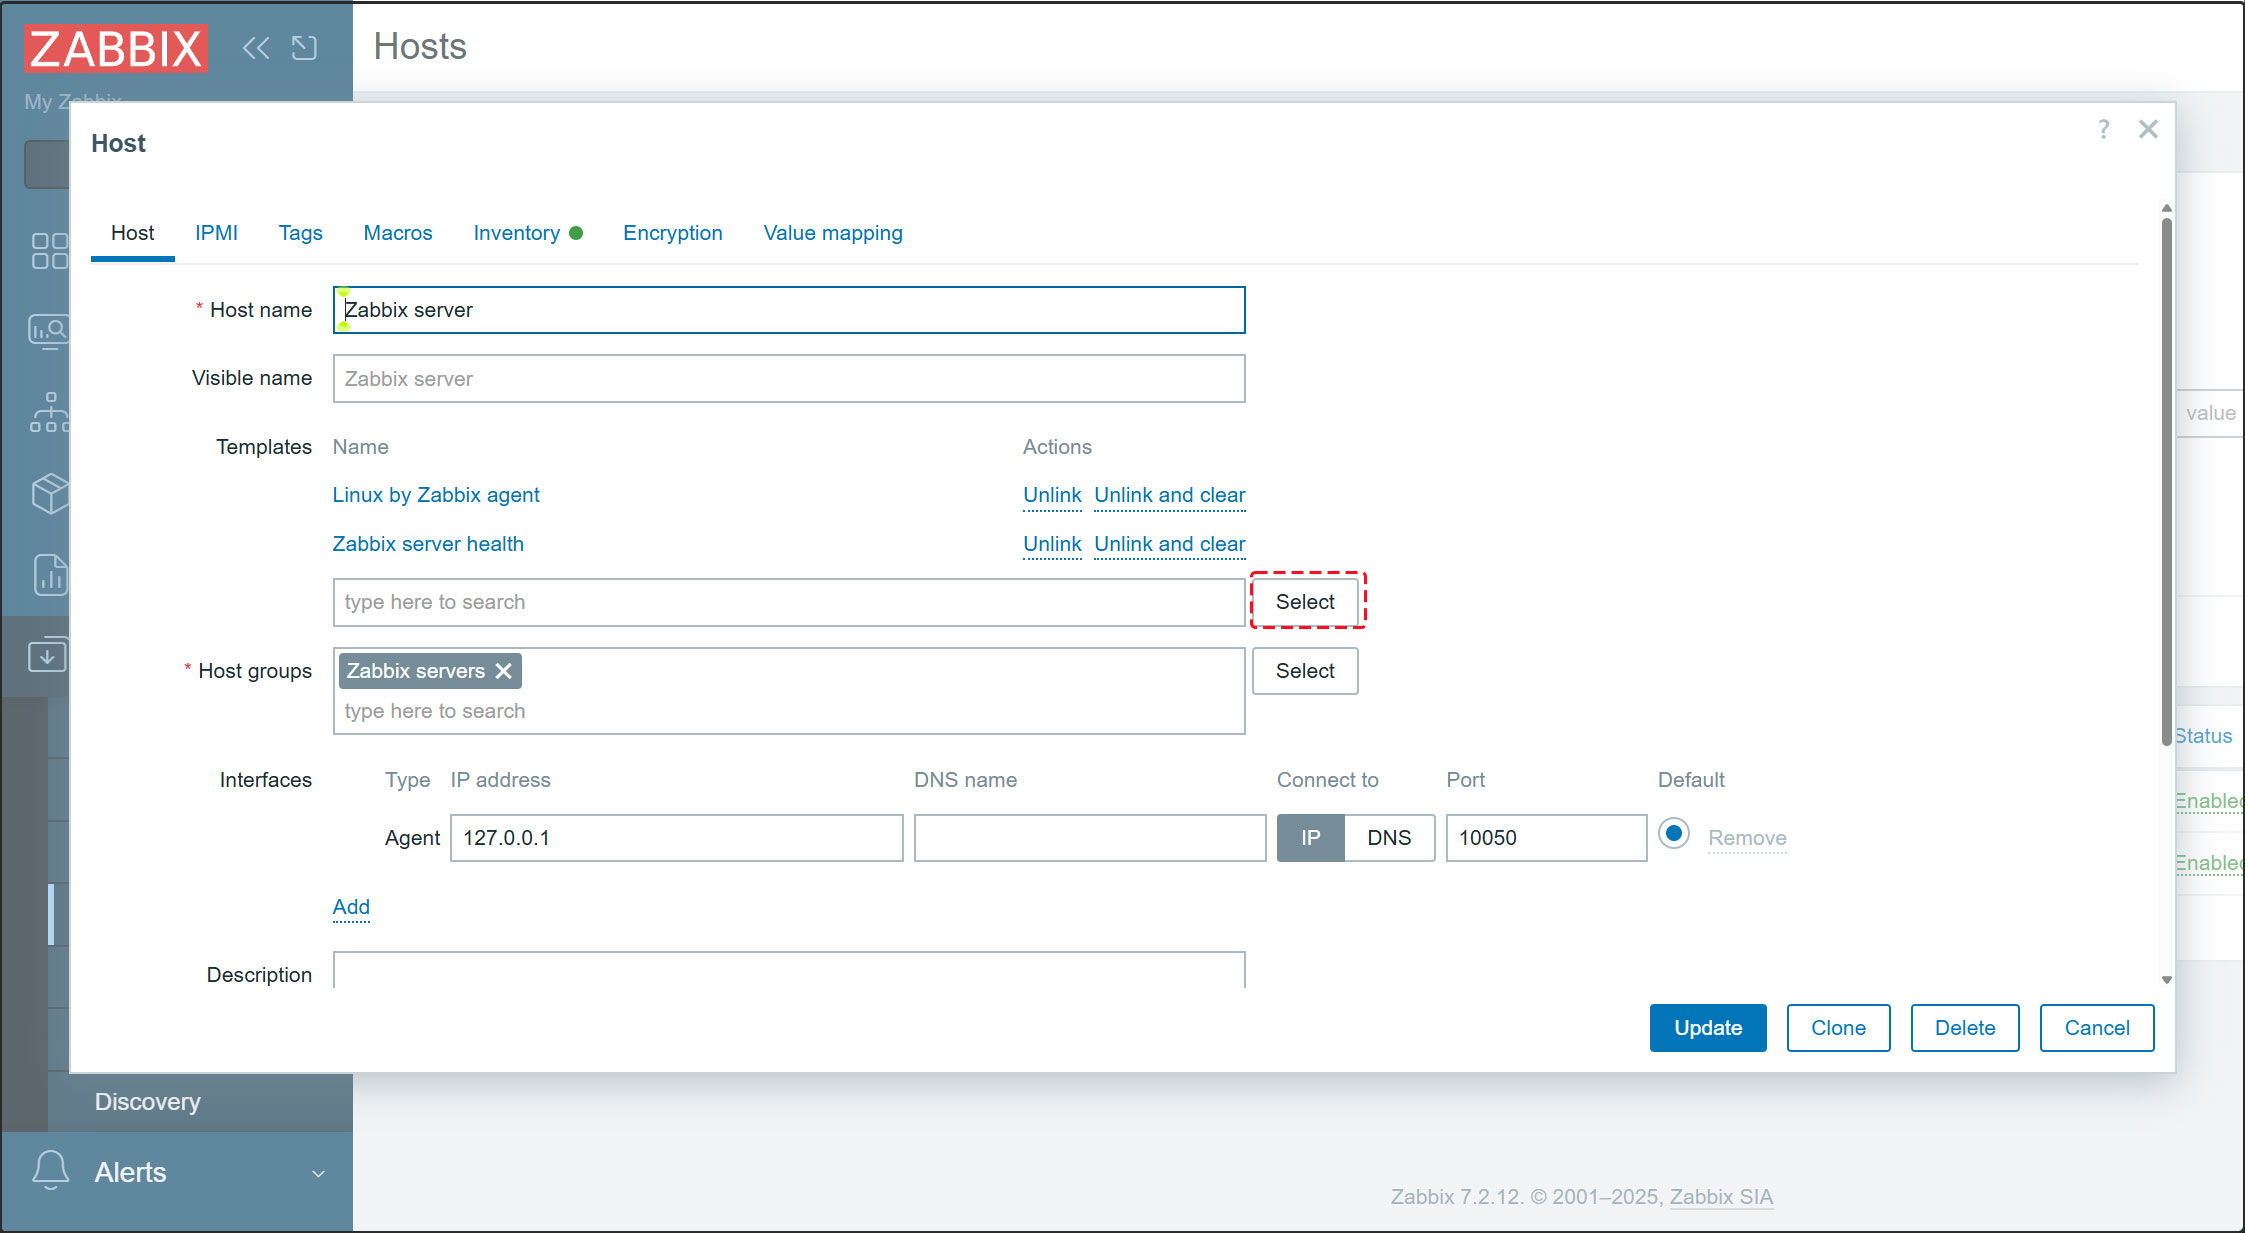
3.Click the [Select] button in the [Templates] section
4.Click the [Select] button
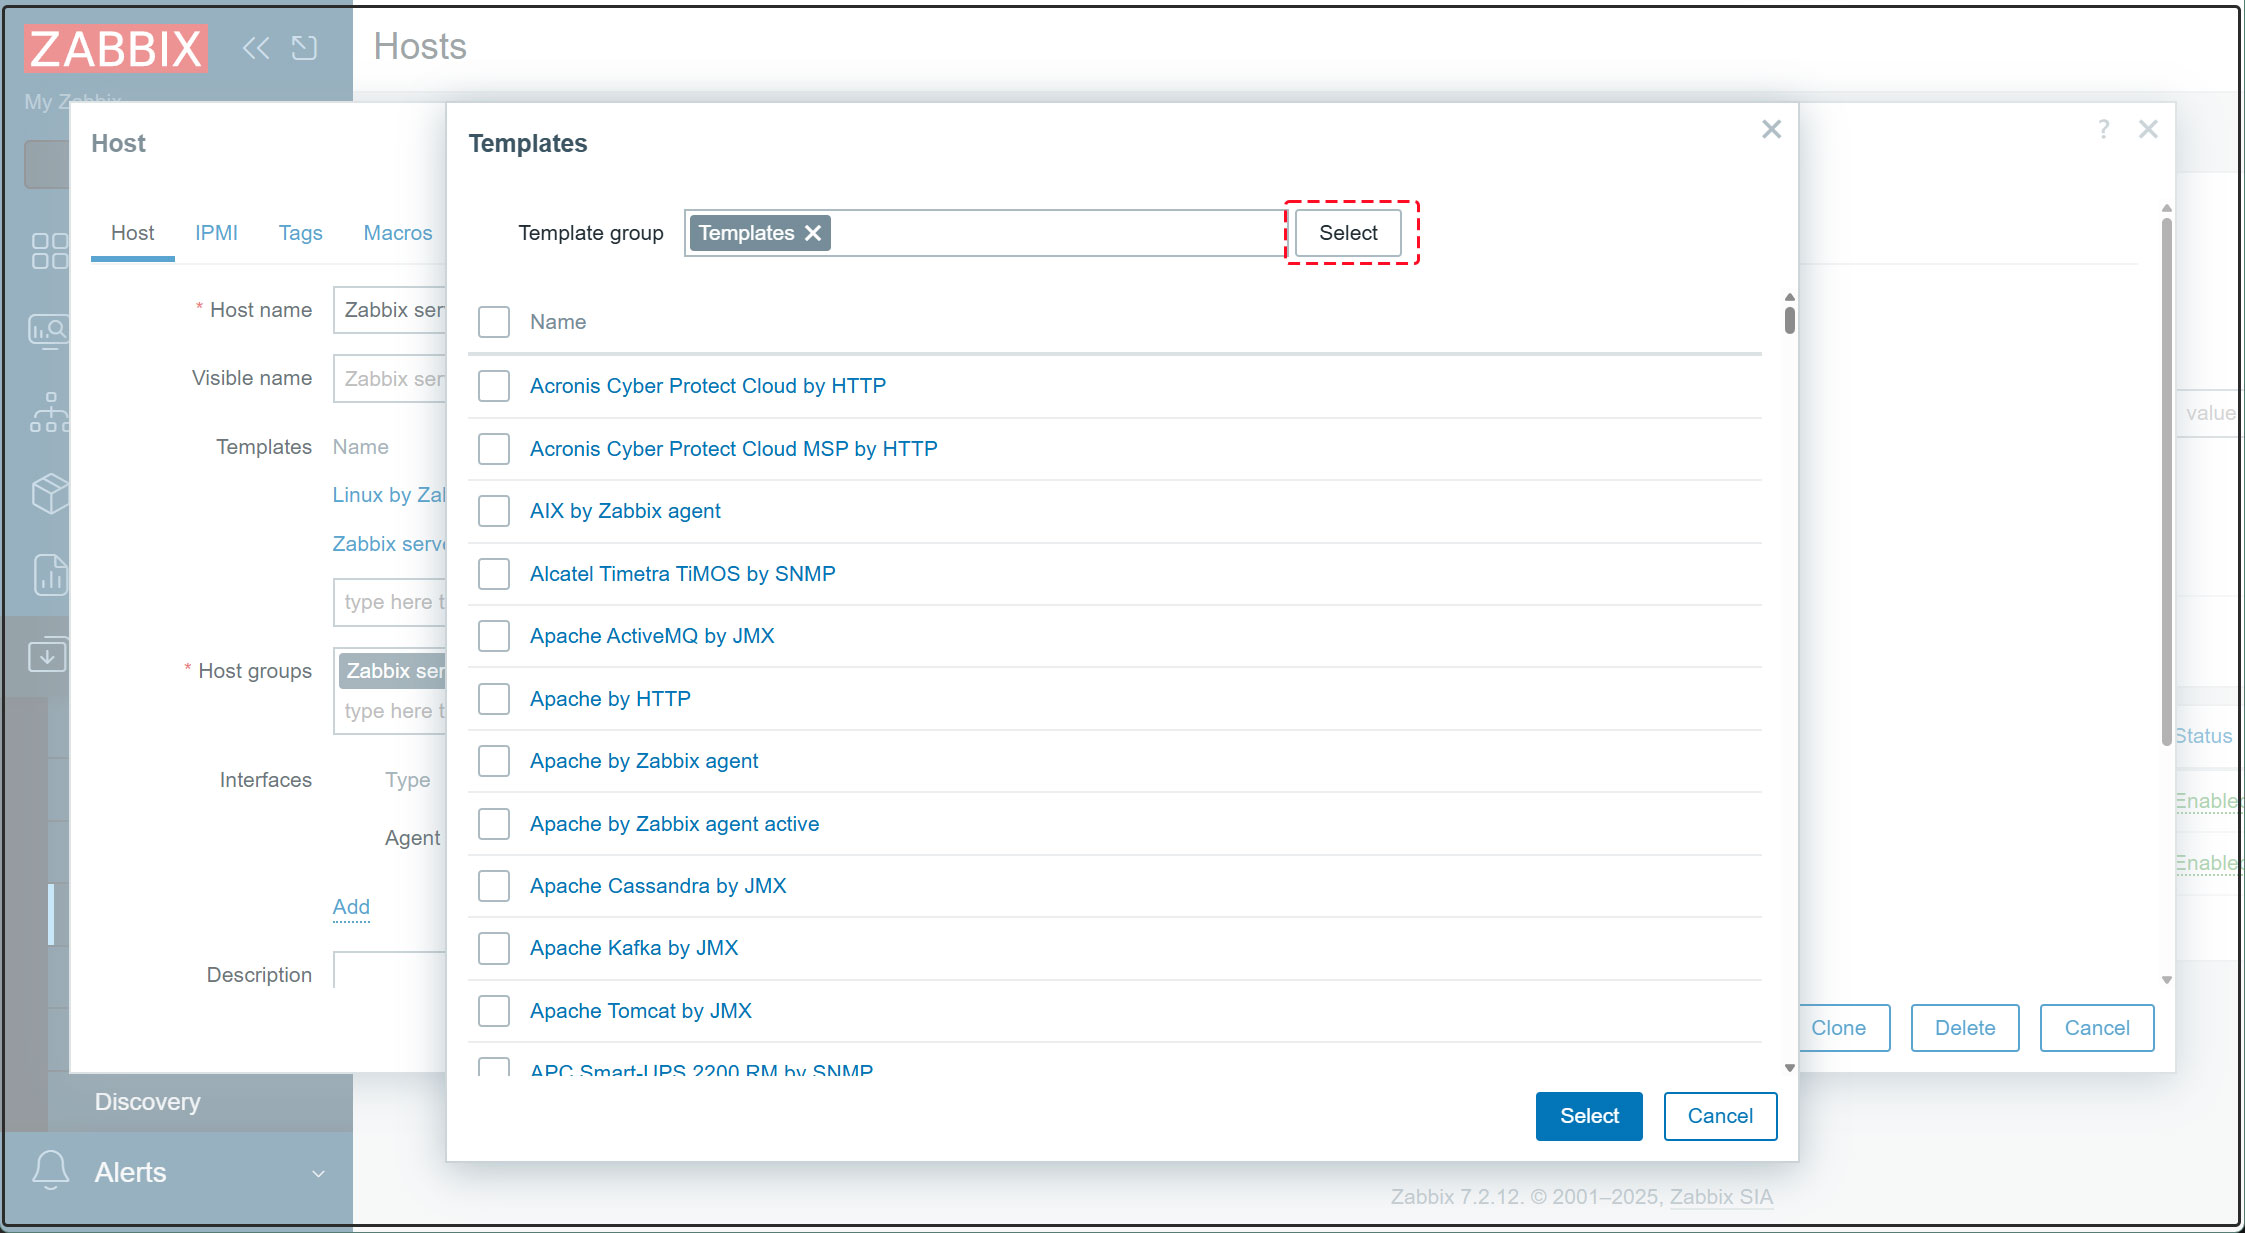
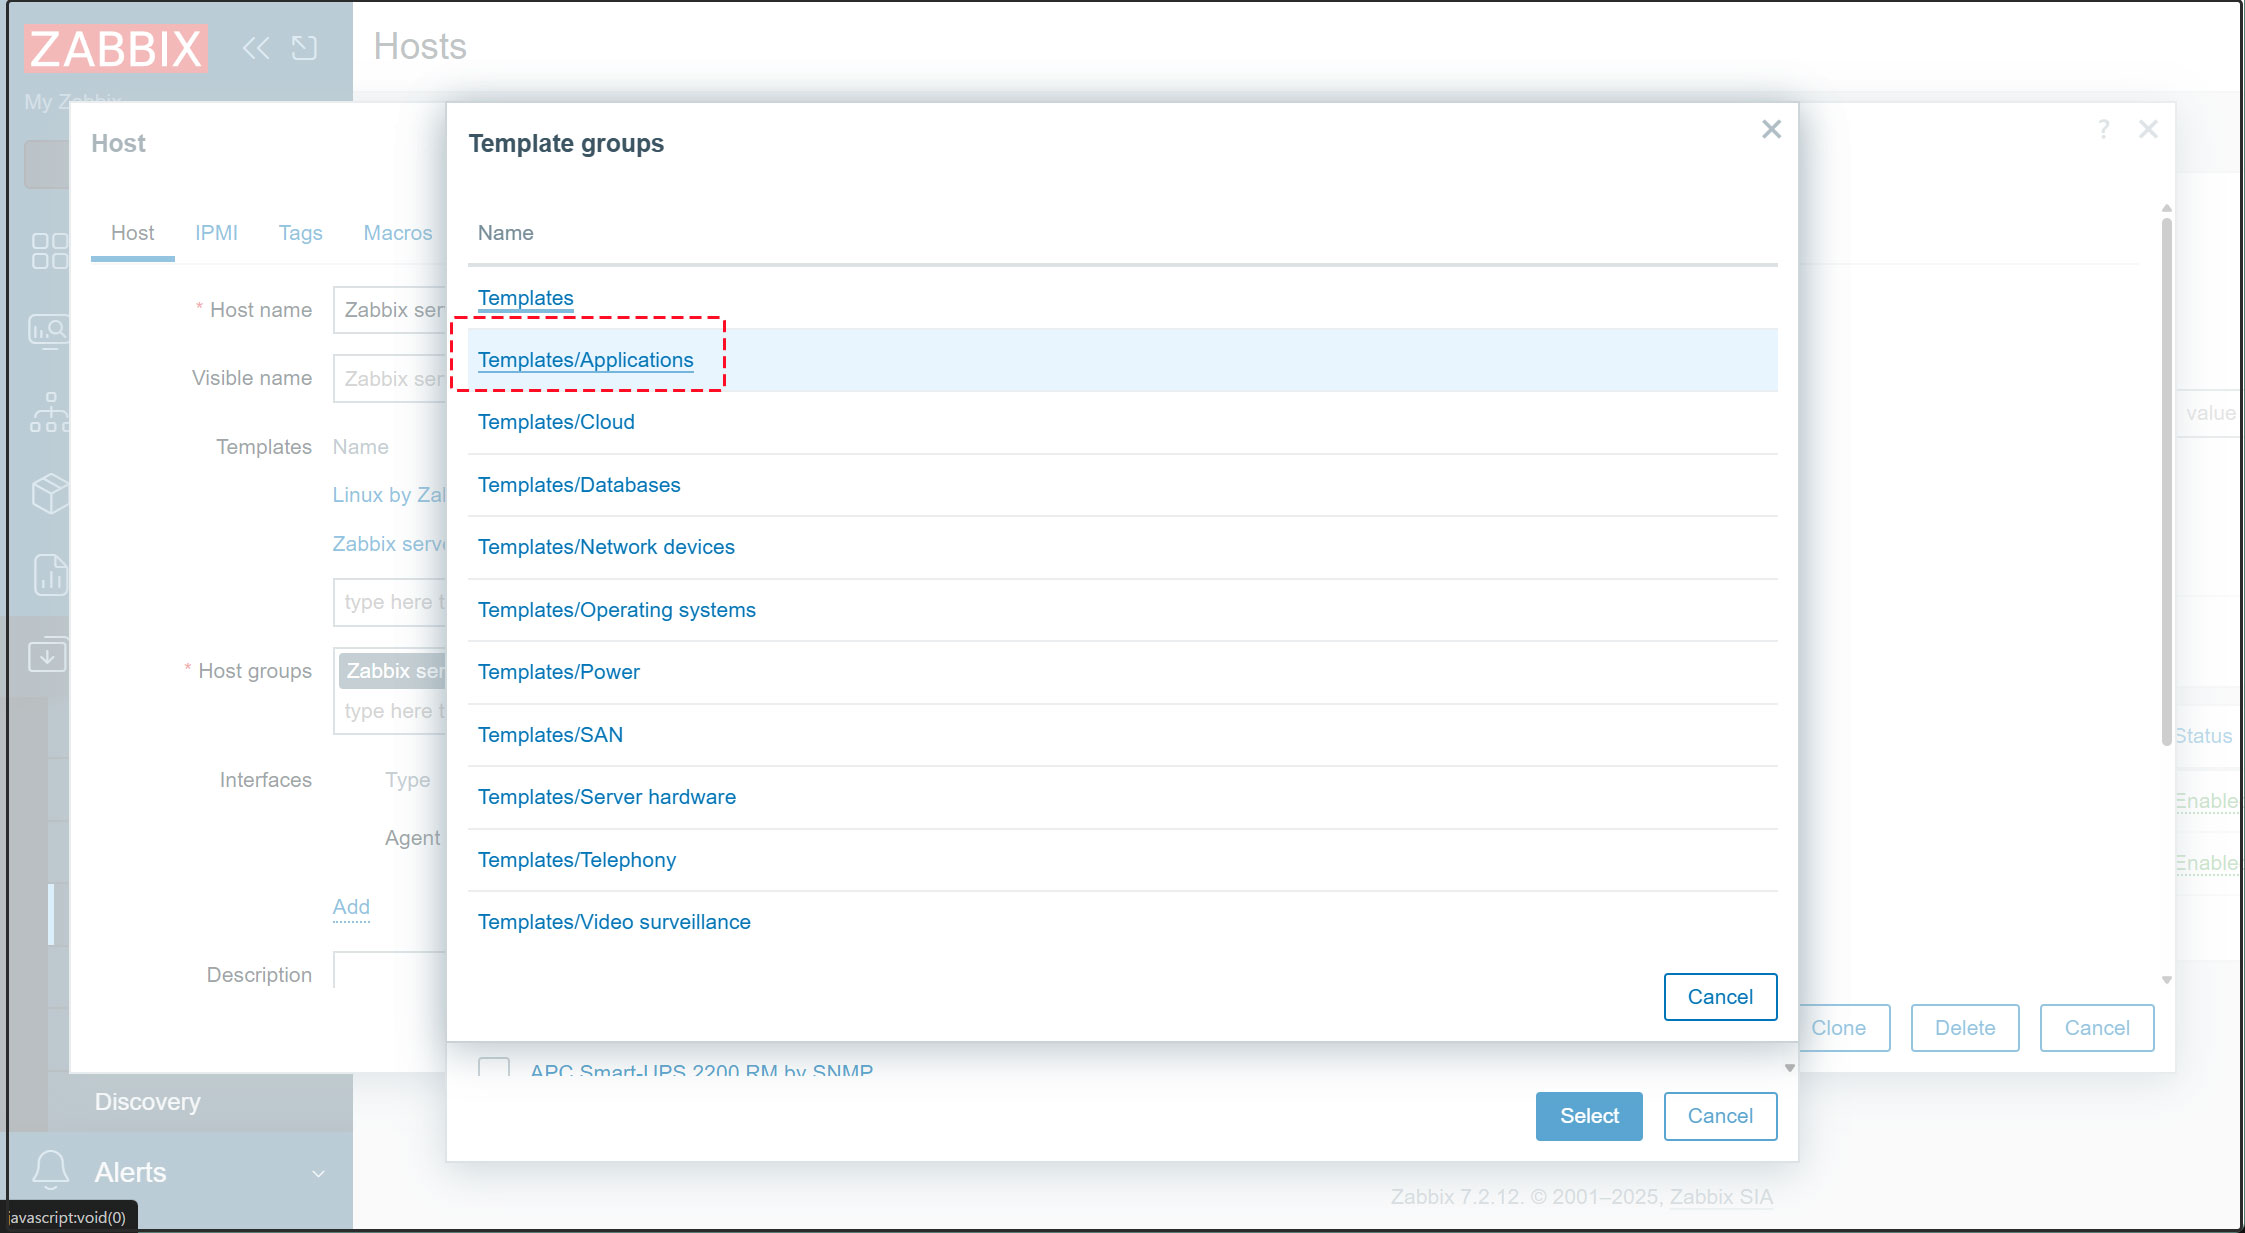
5.Click [Templates/Applications]
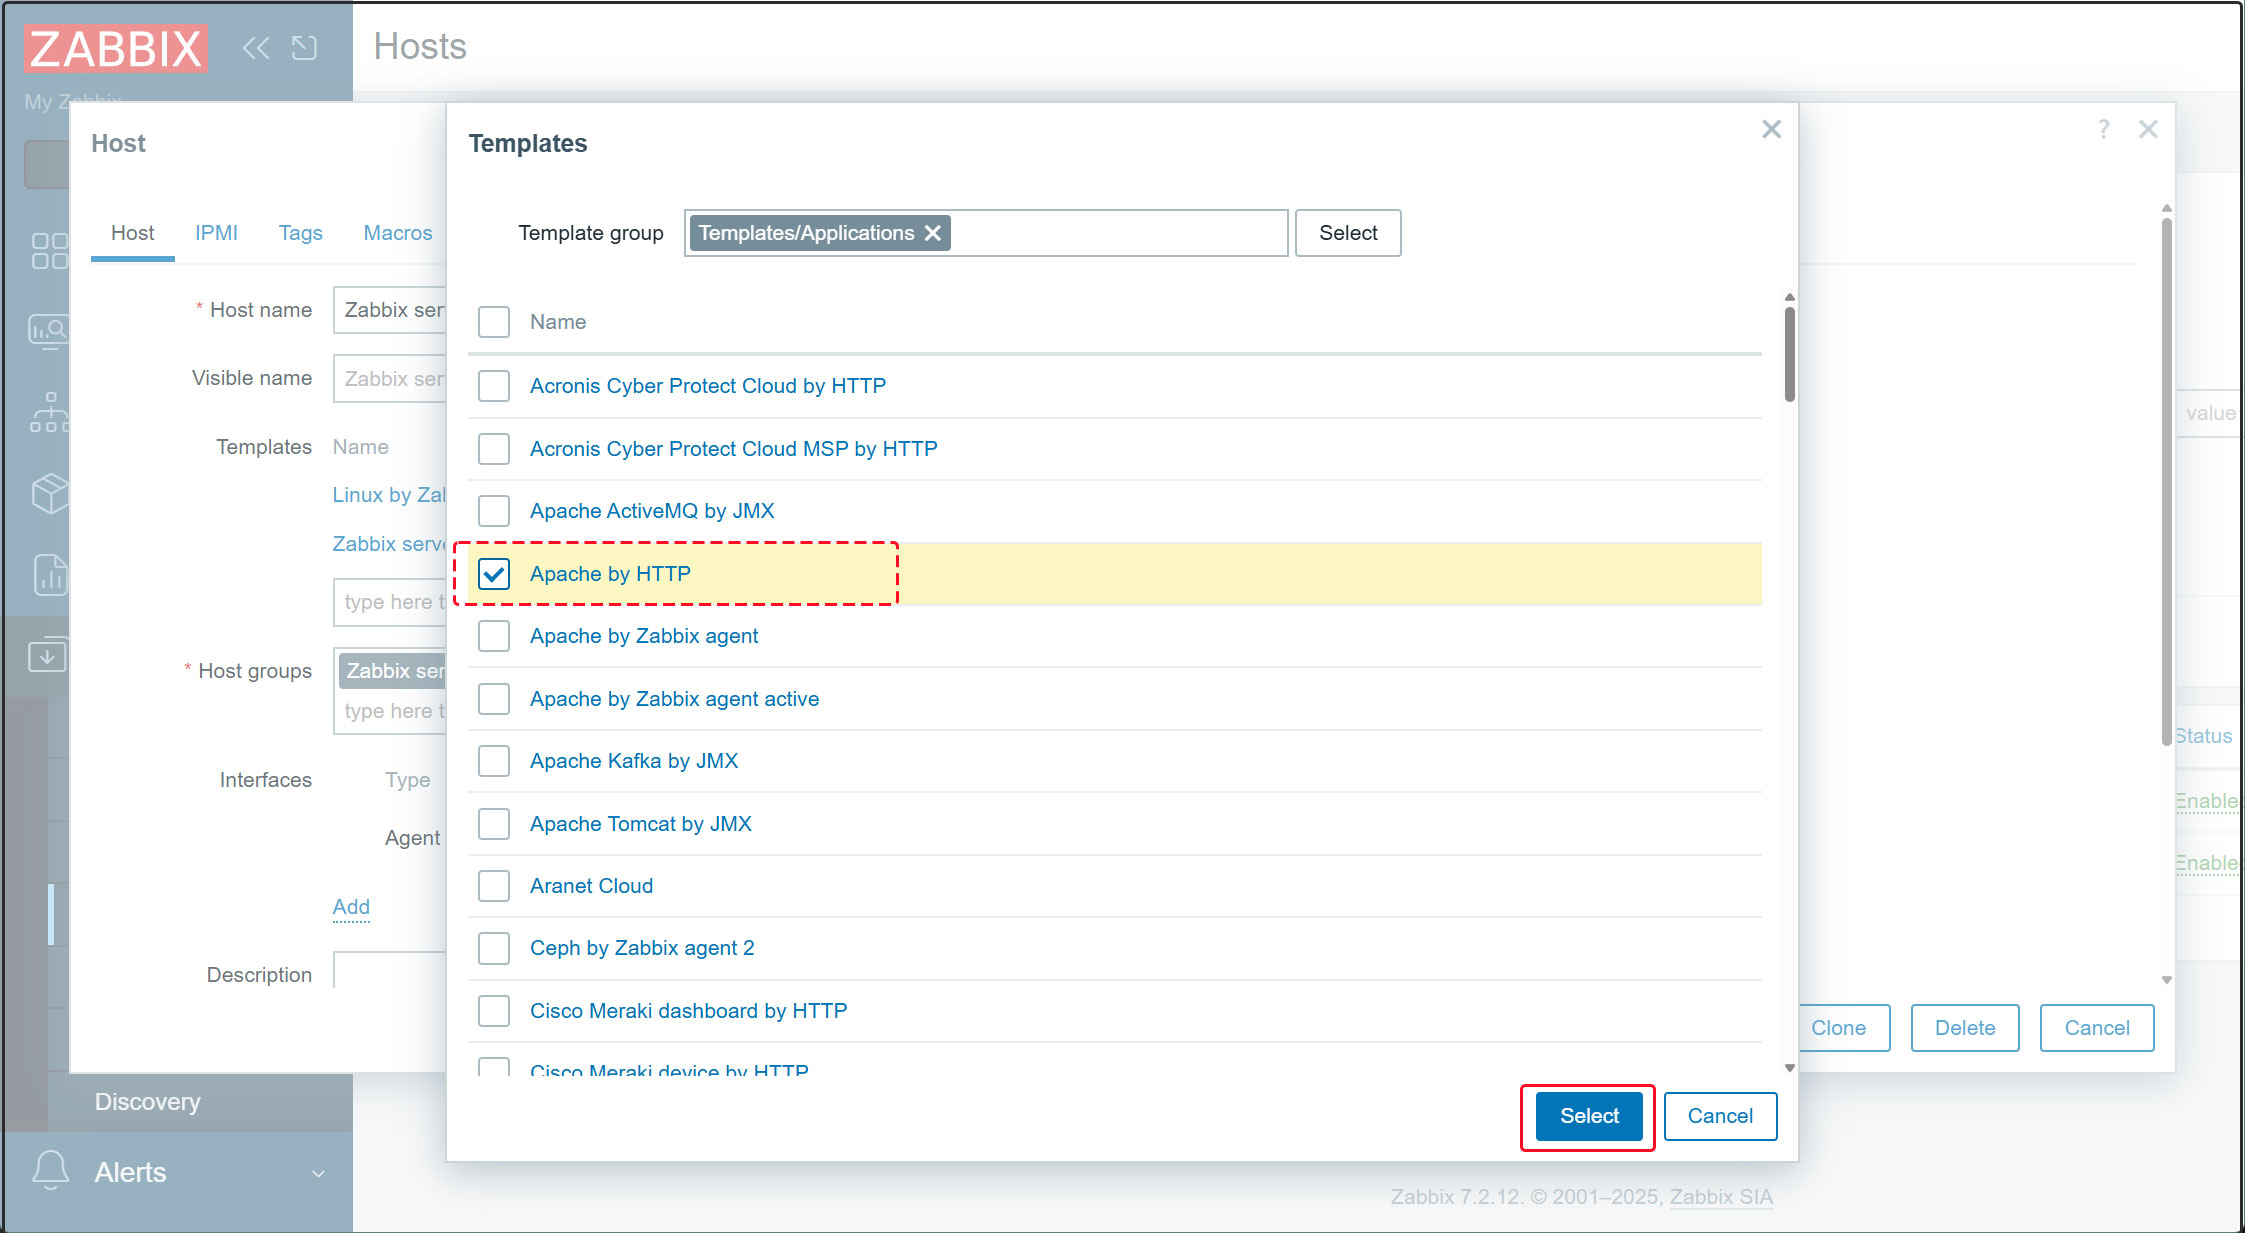
6.Select [Apache by HTTP], then click [Select].
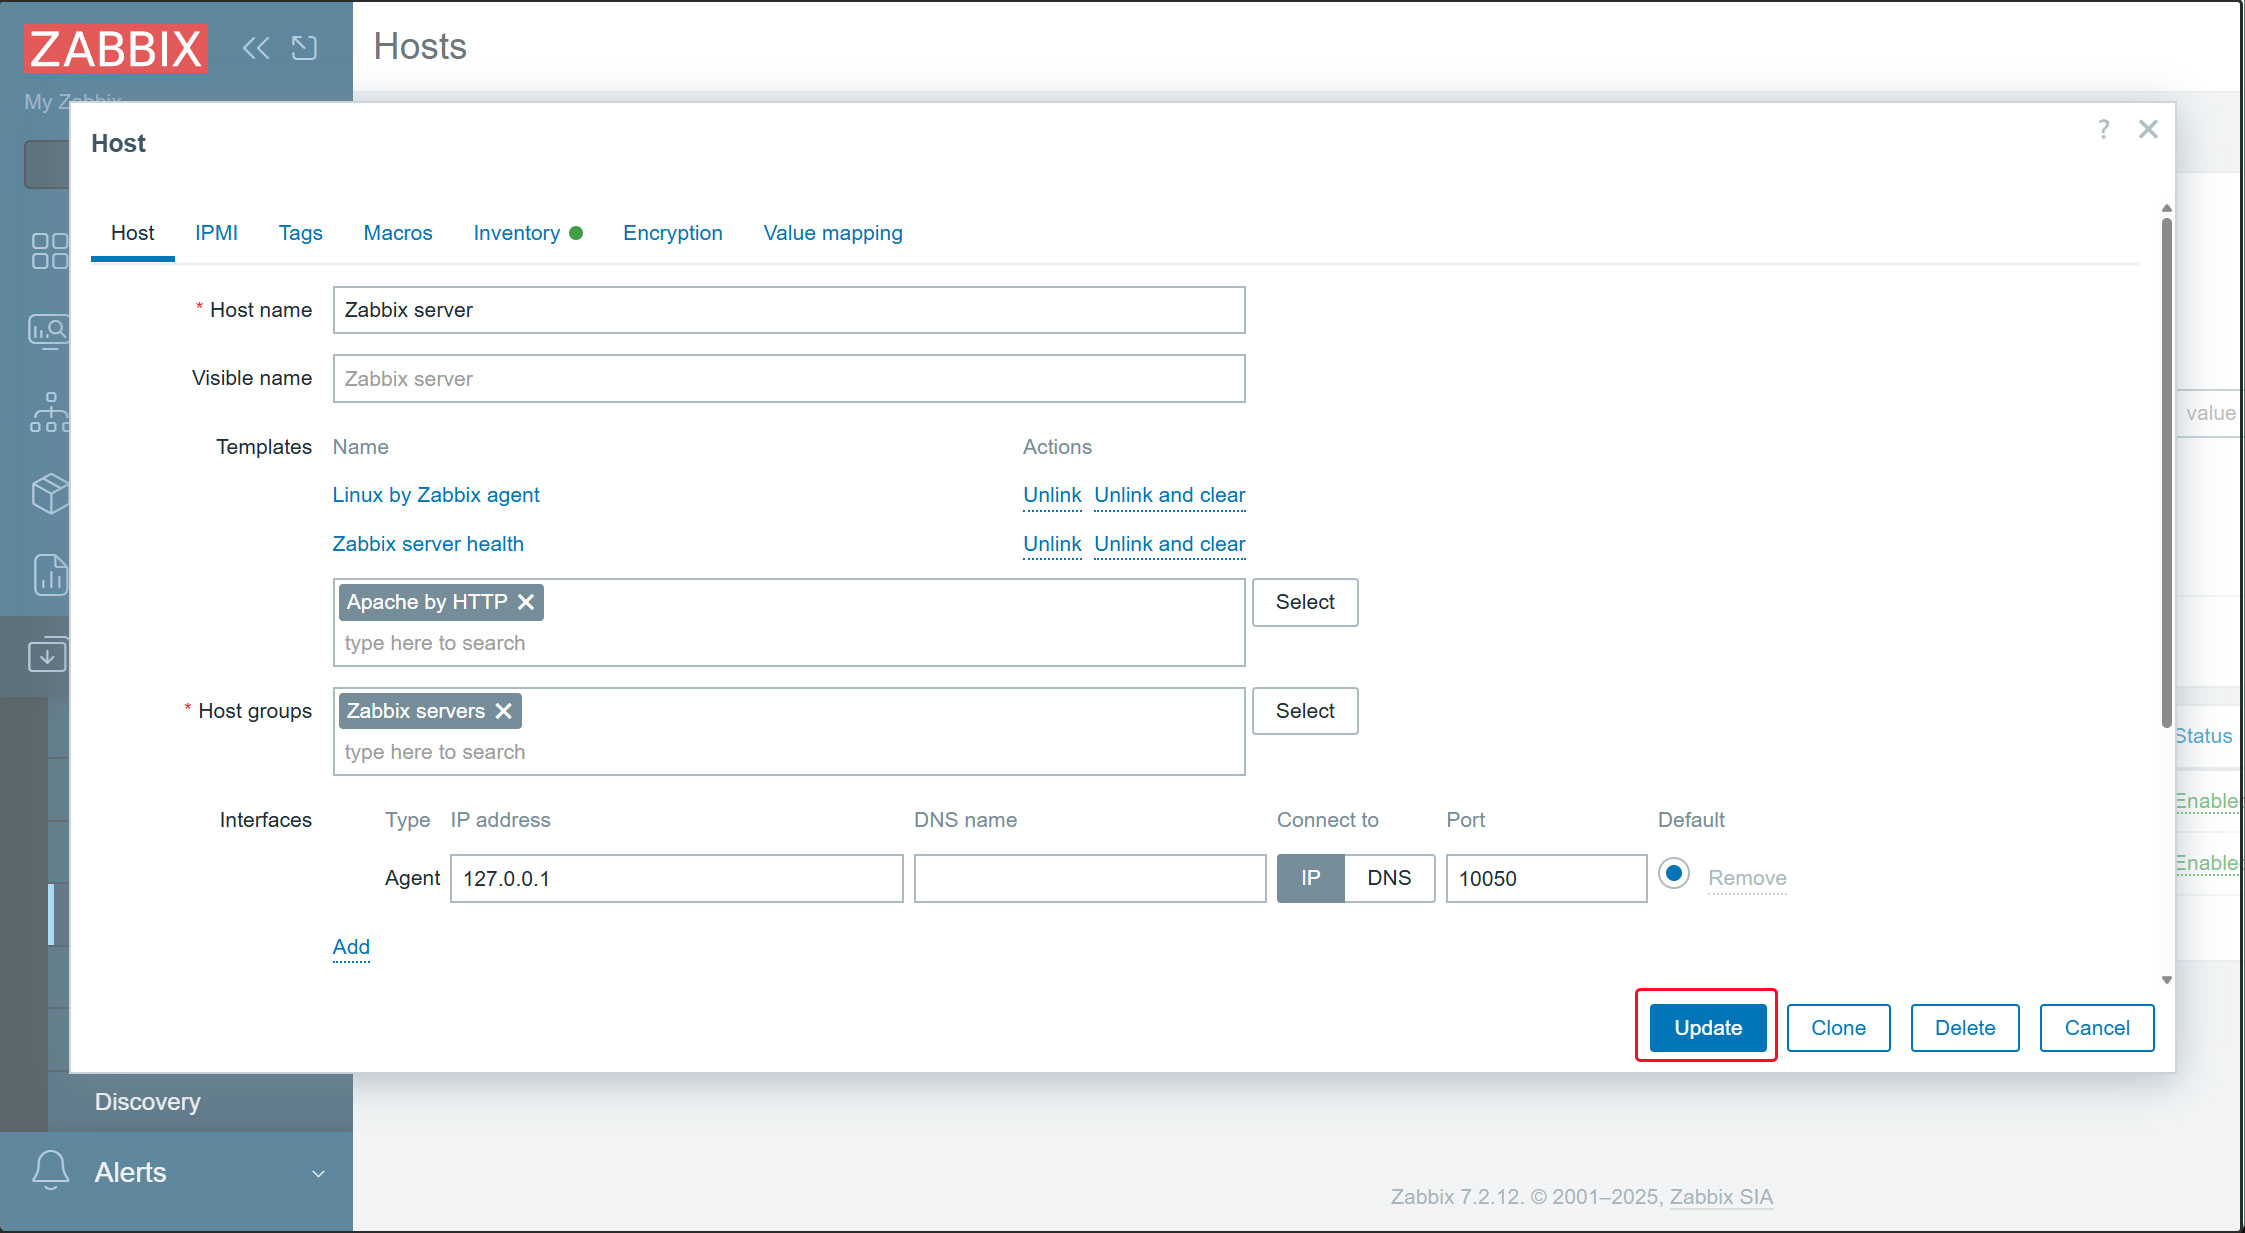
7.Click the [Update] button to update your settings.
8.[Apache by HTTP] Click the link
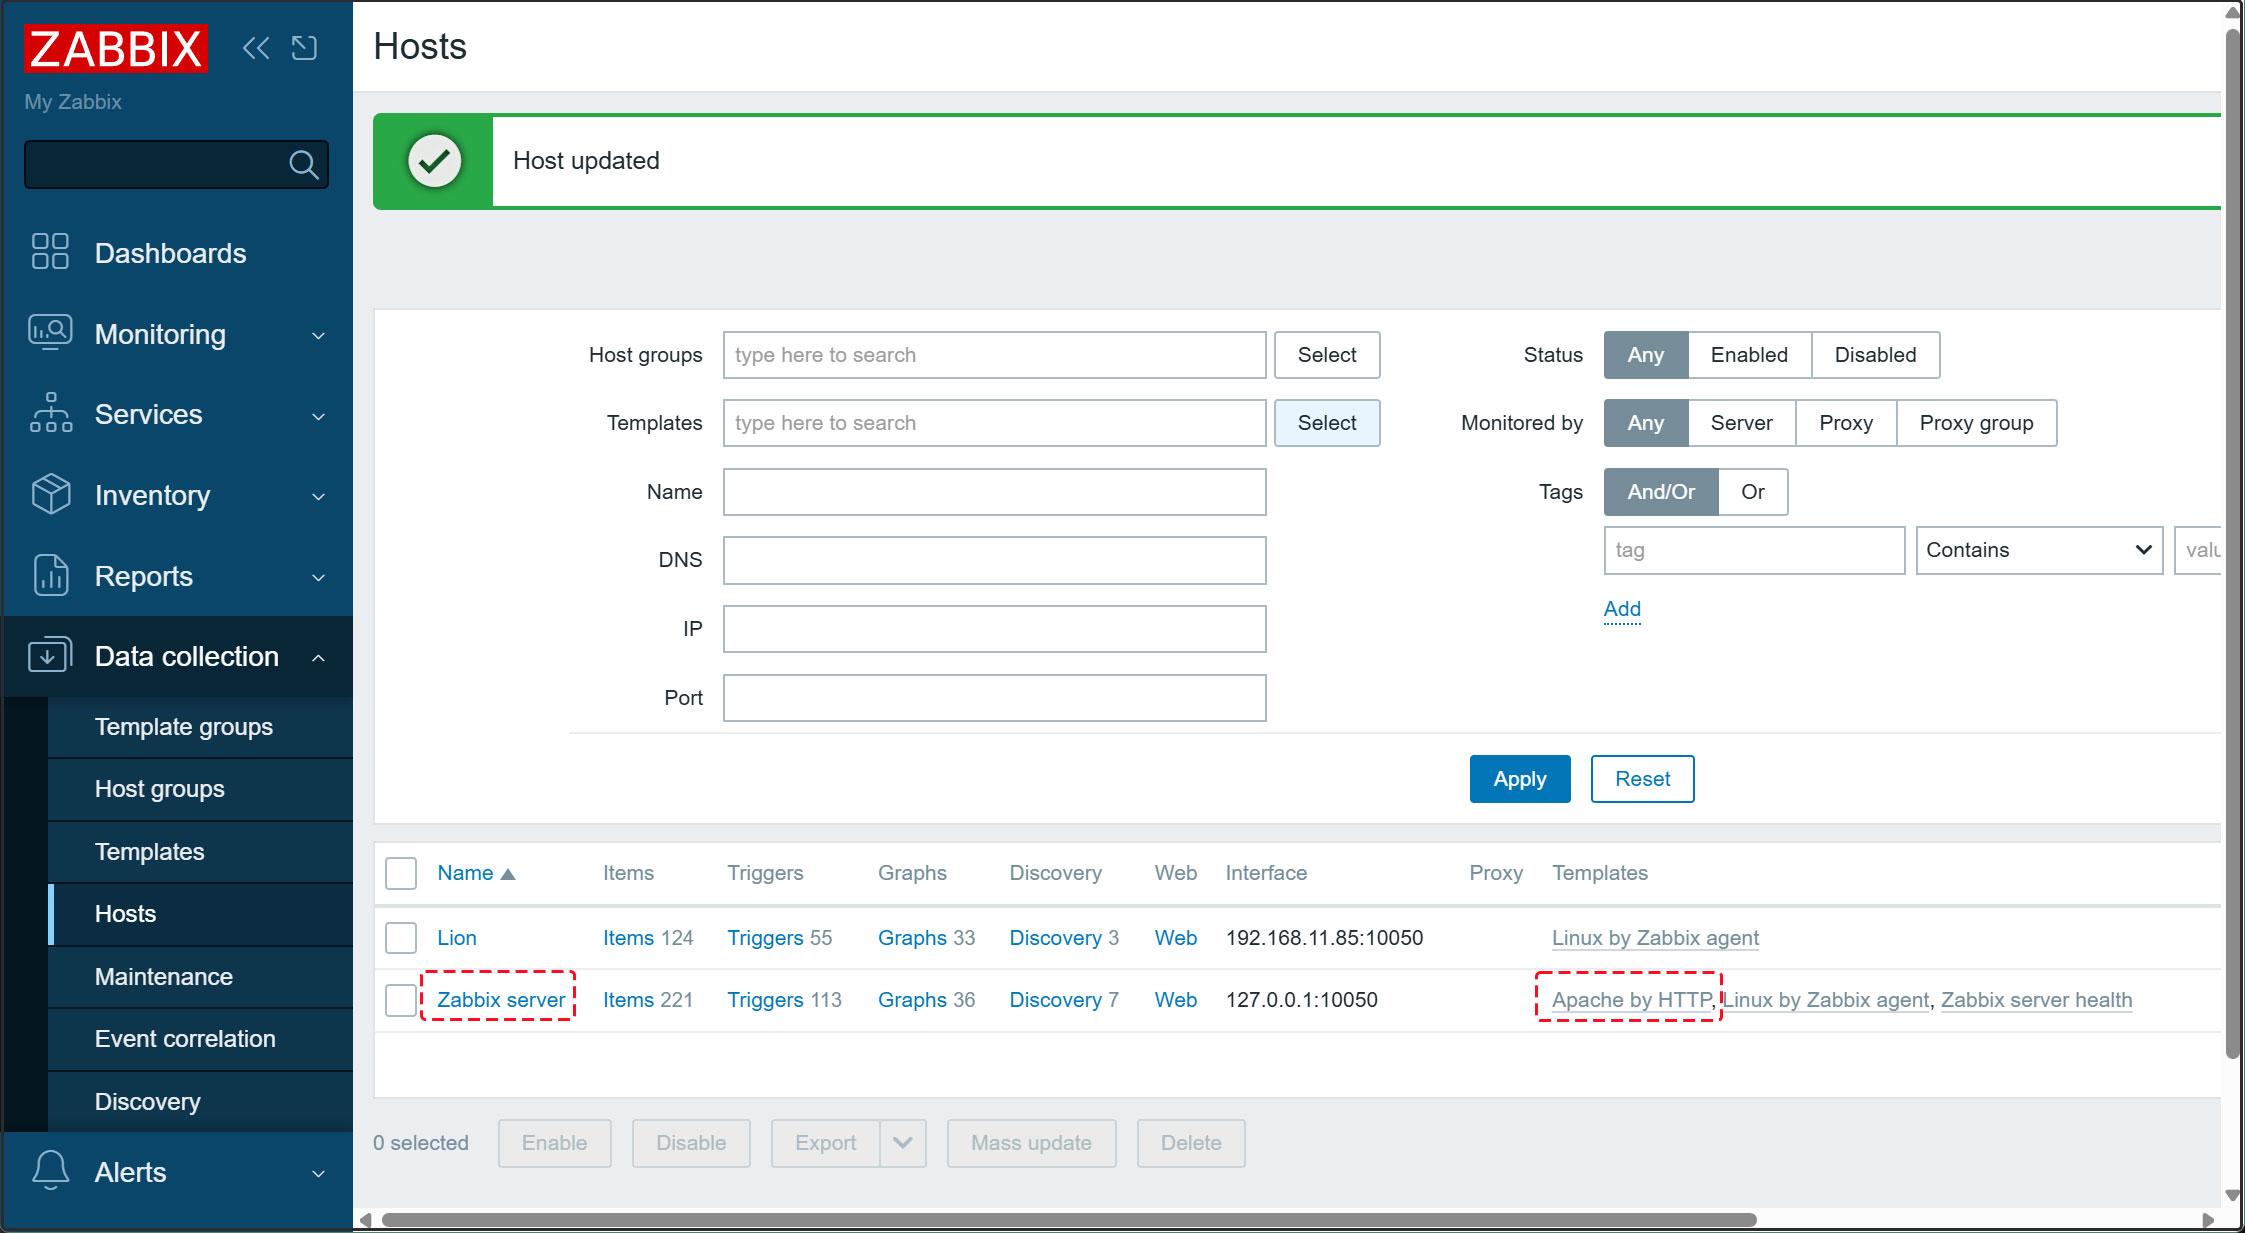
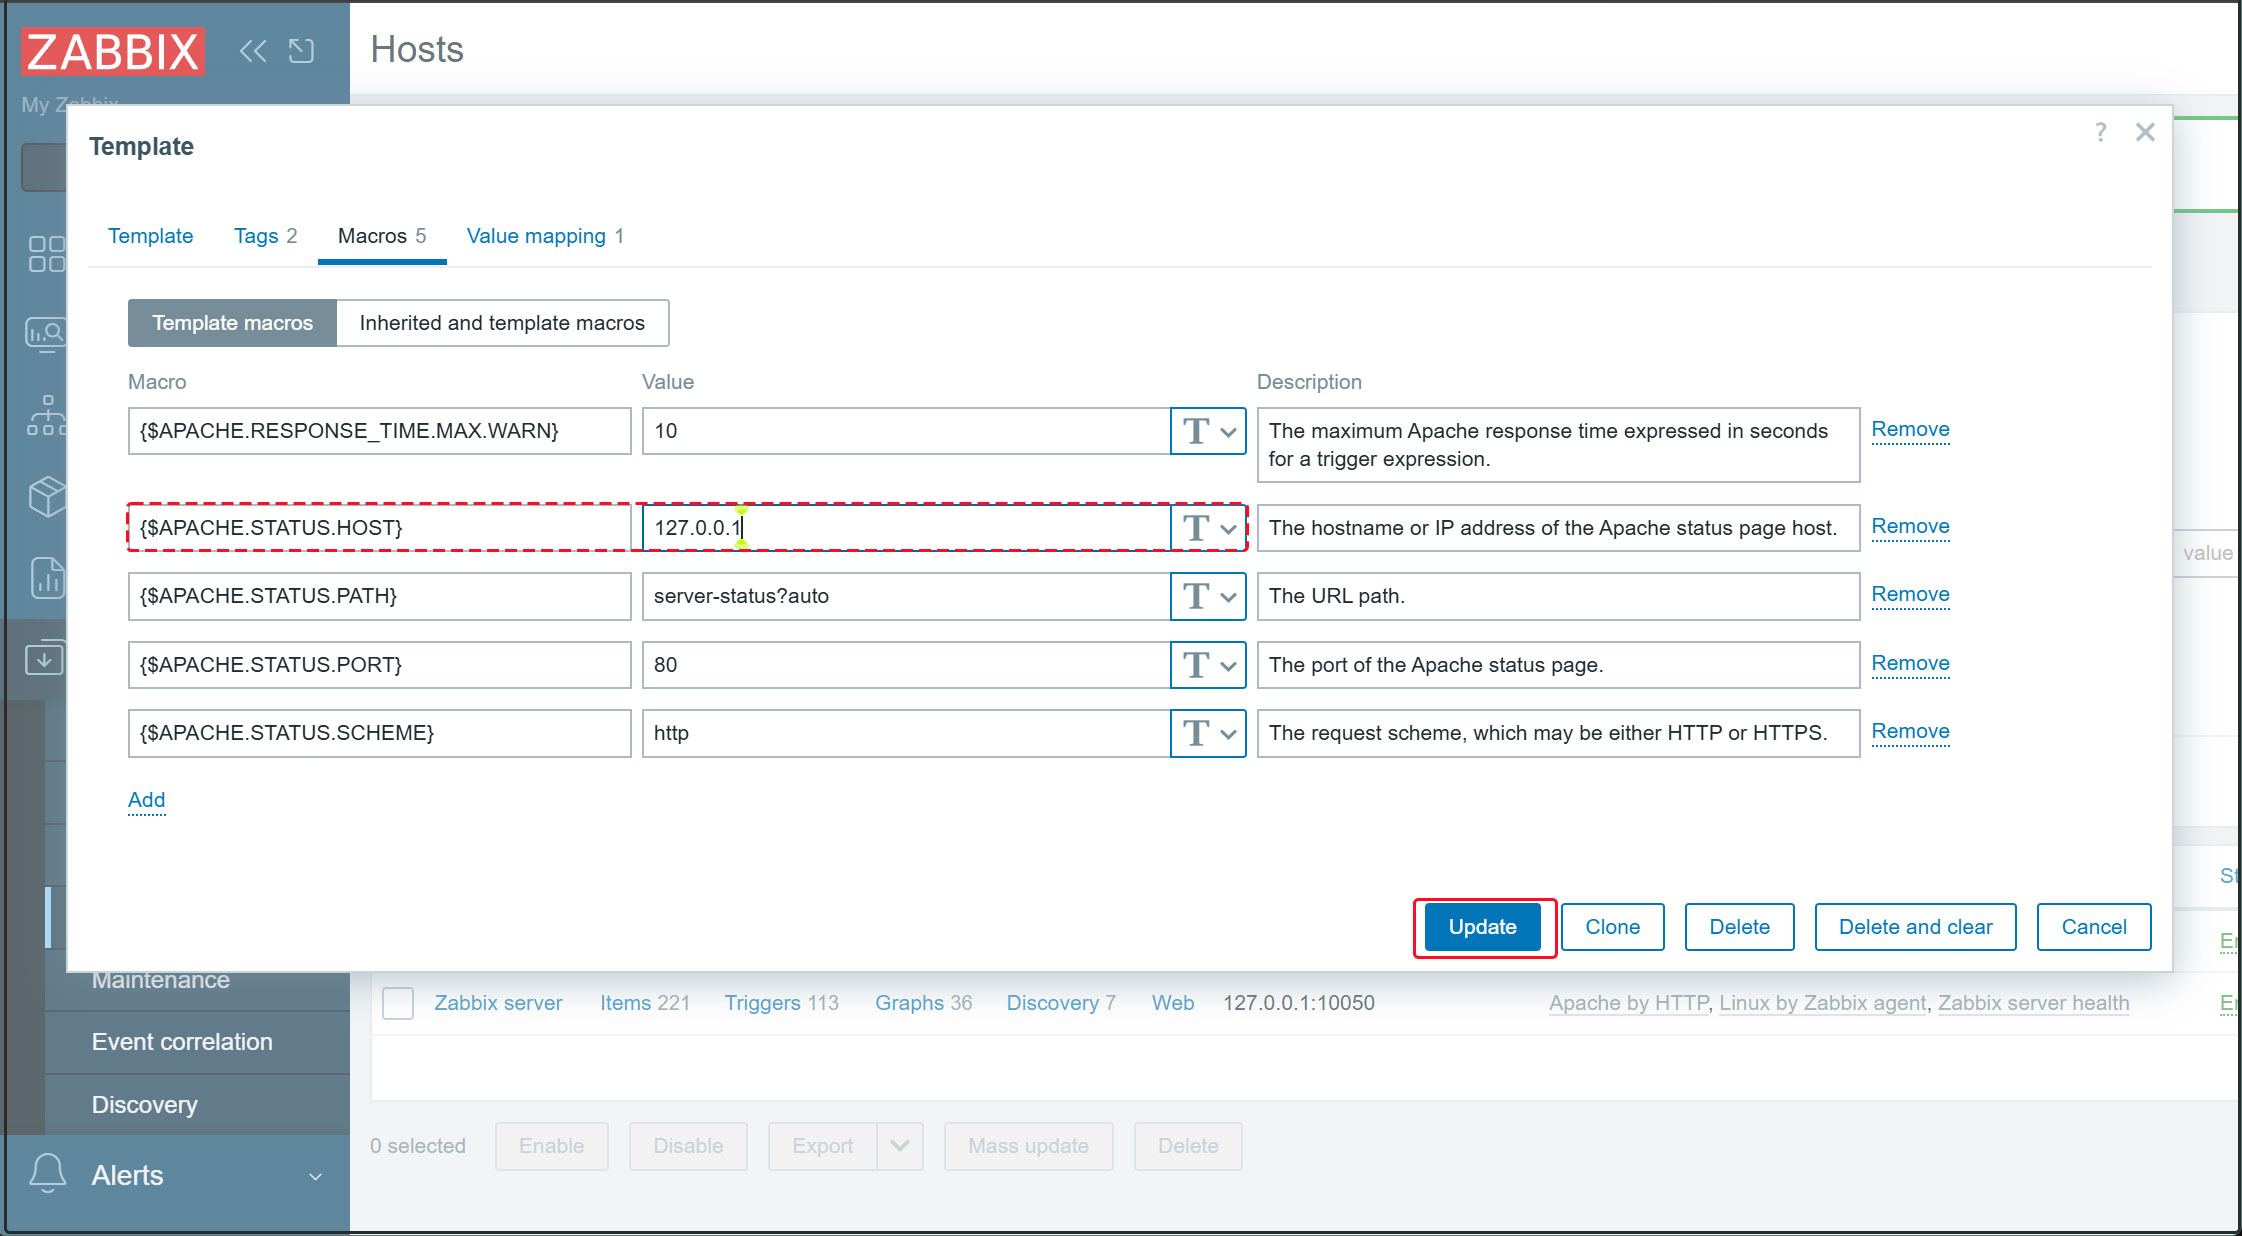
Open the [Macros] tab, enter [127.0.0.1] in {$APACHE.STATUS.HOST}, then click [Update].
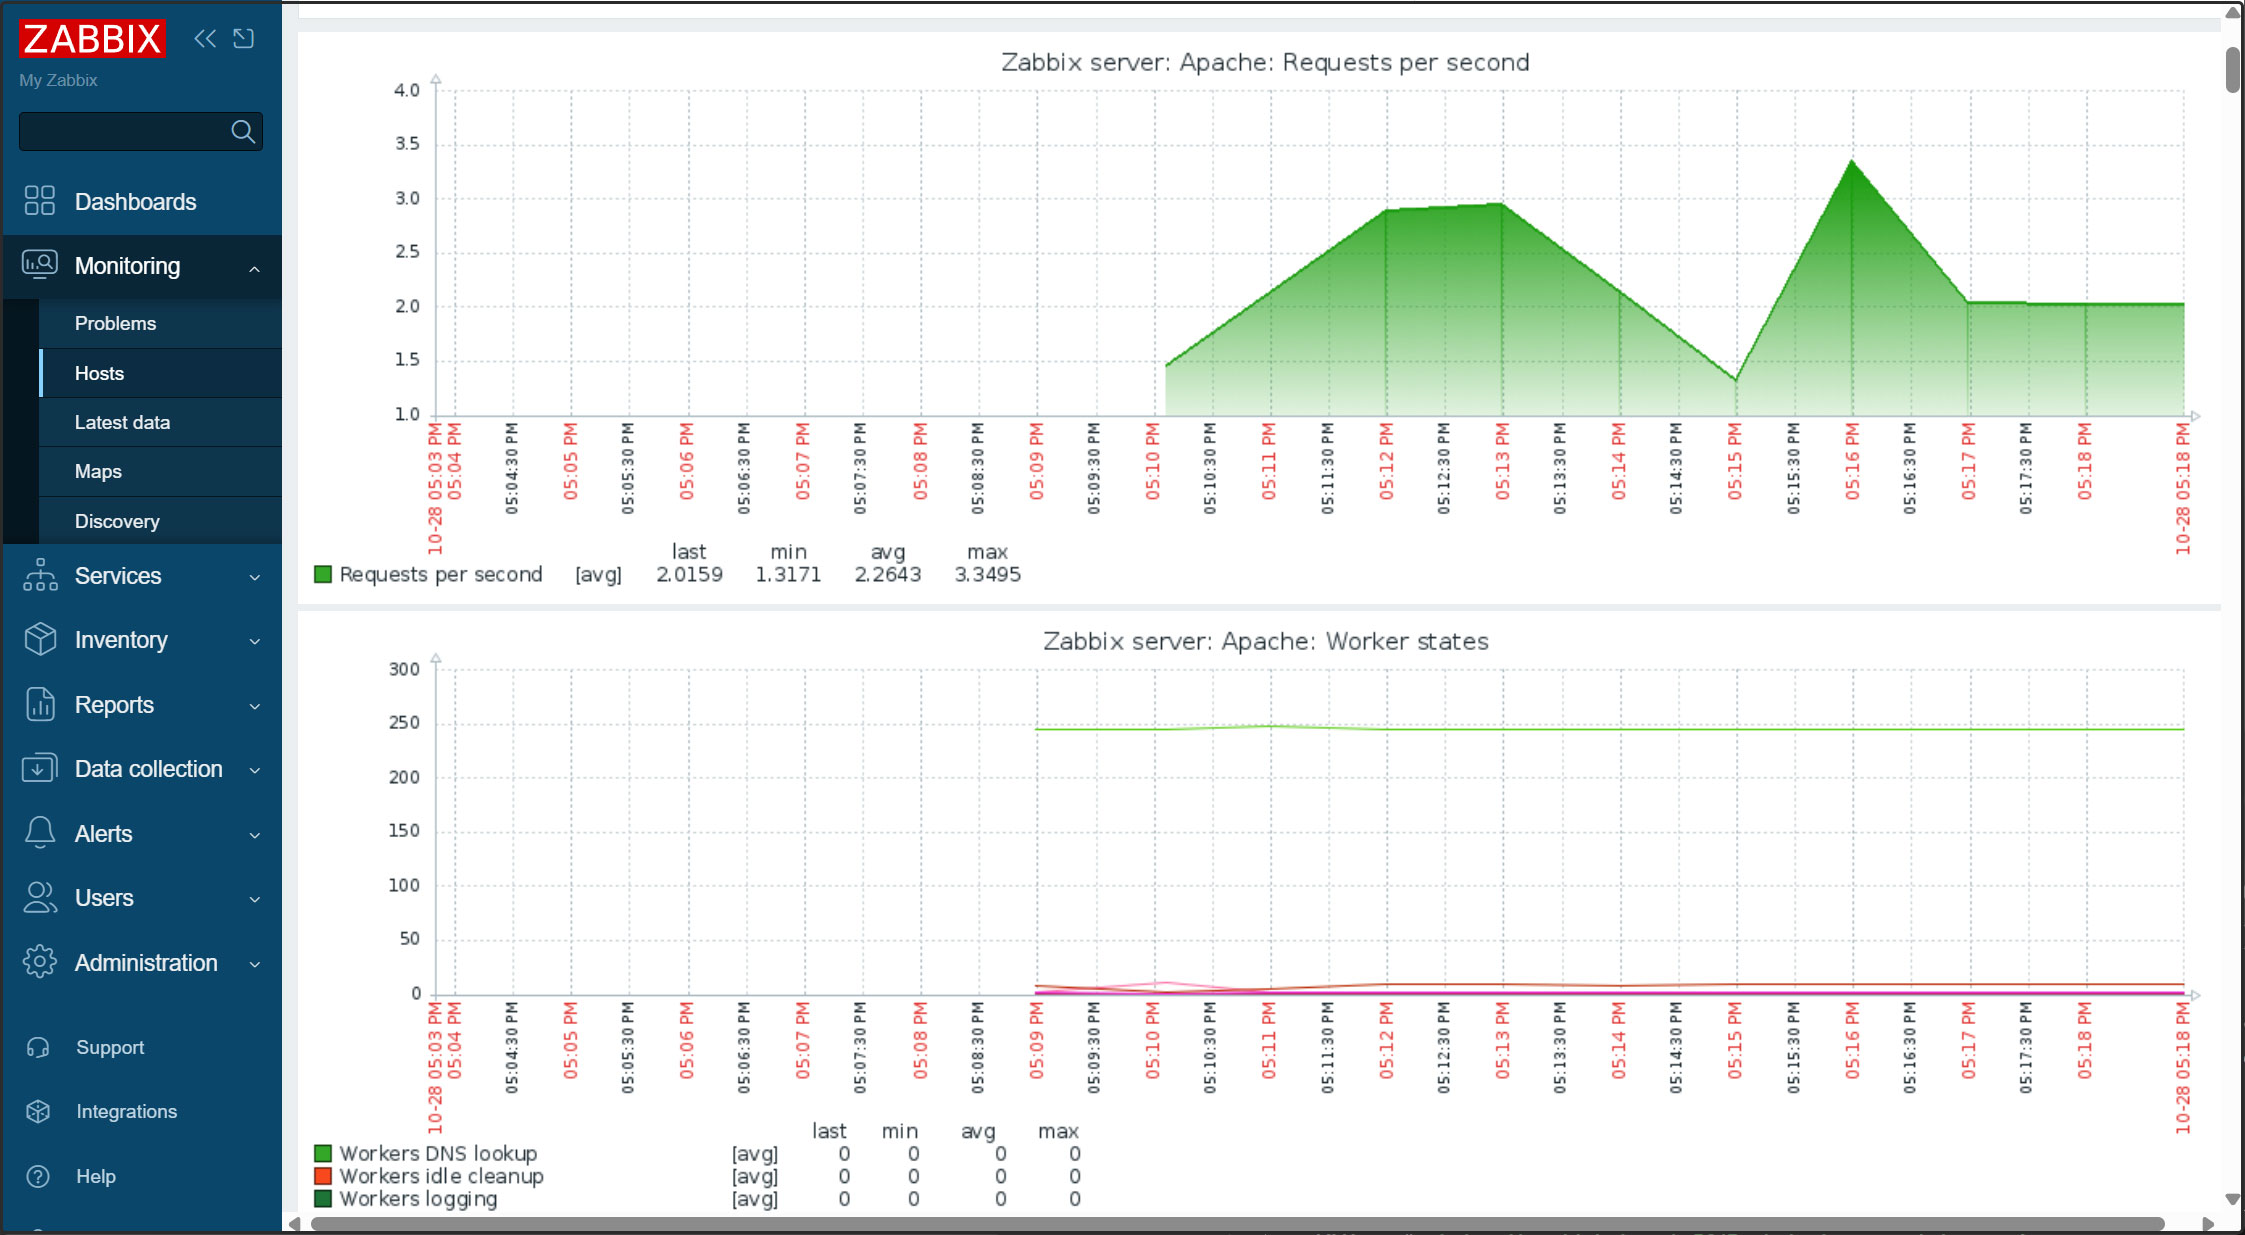
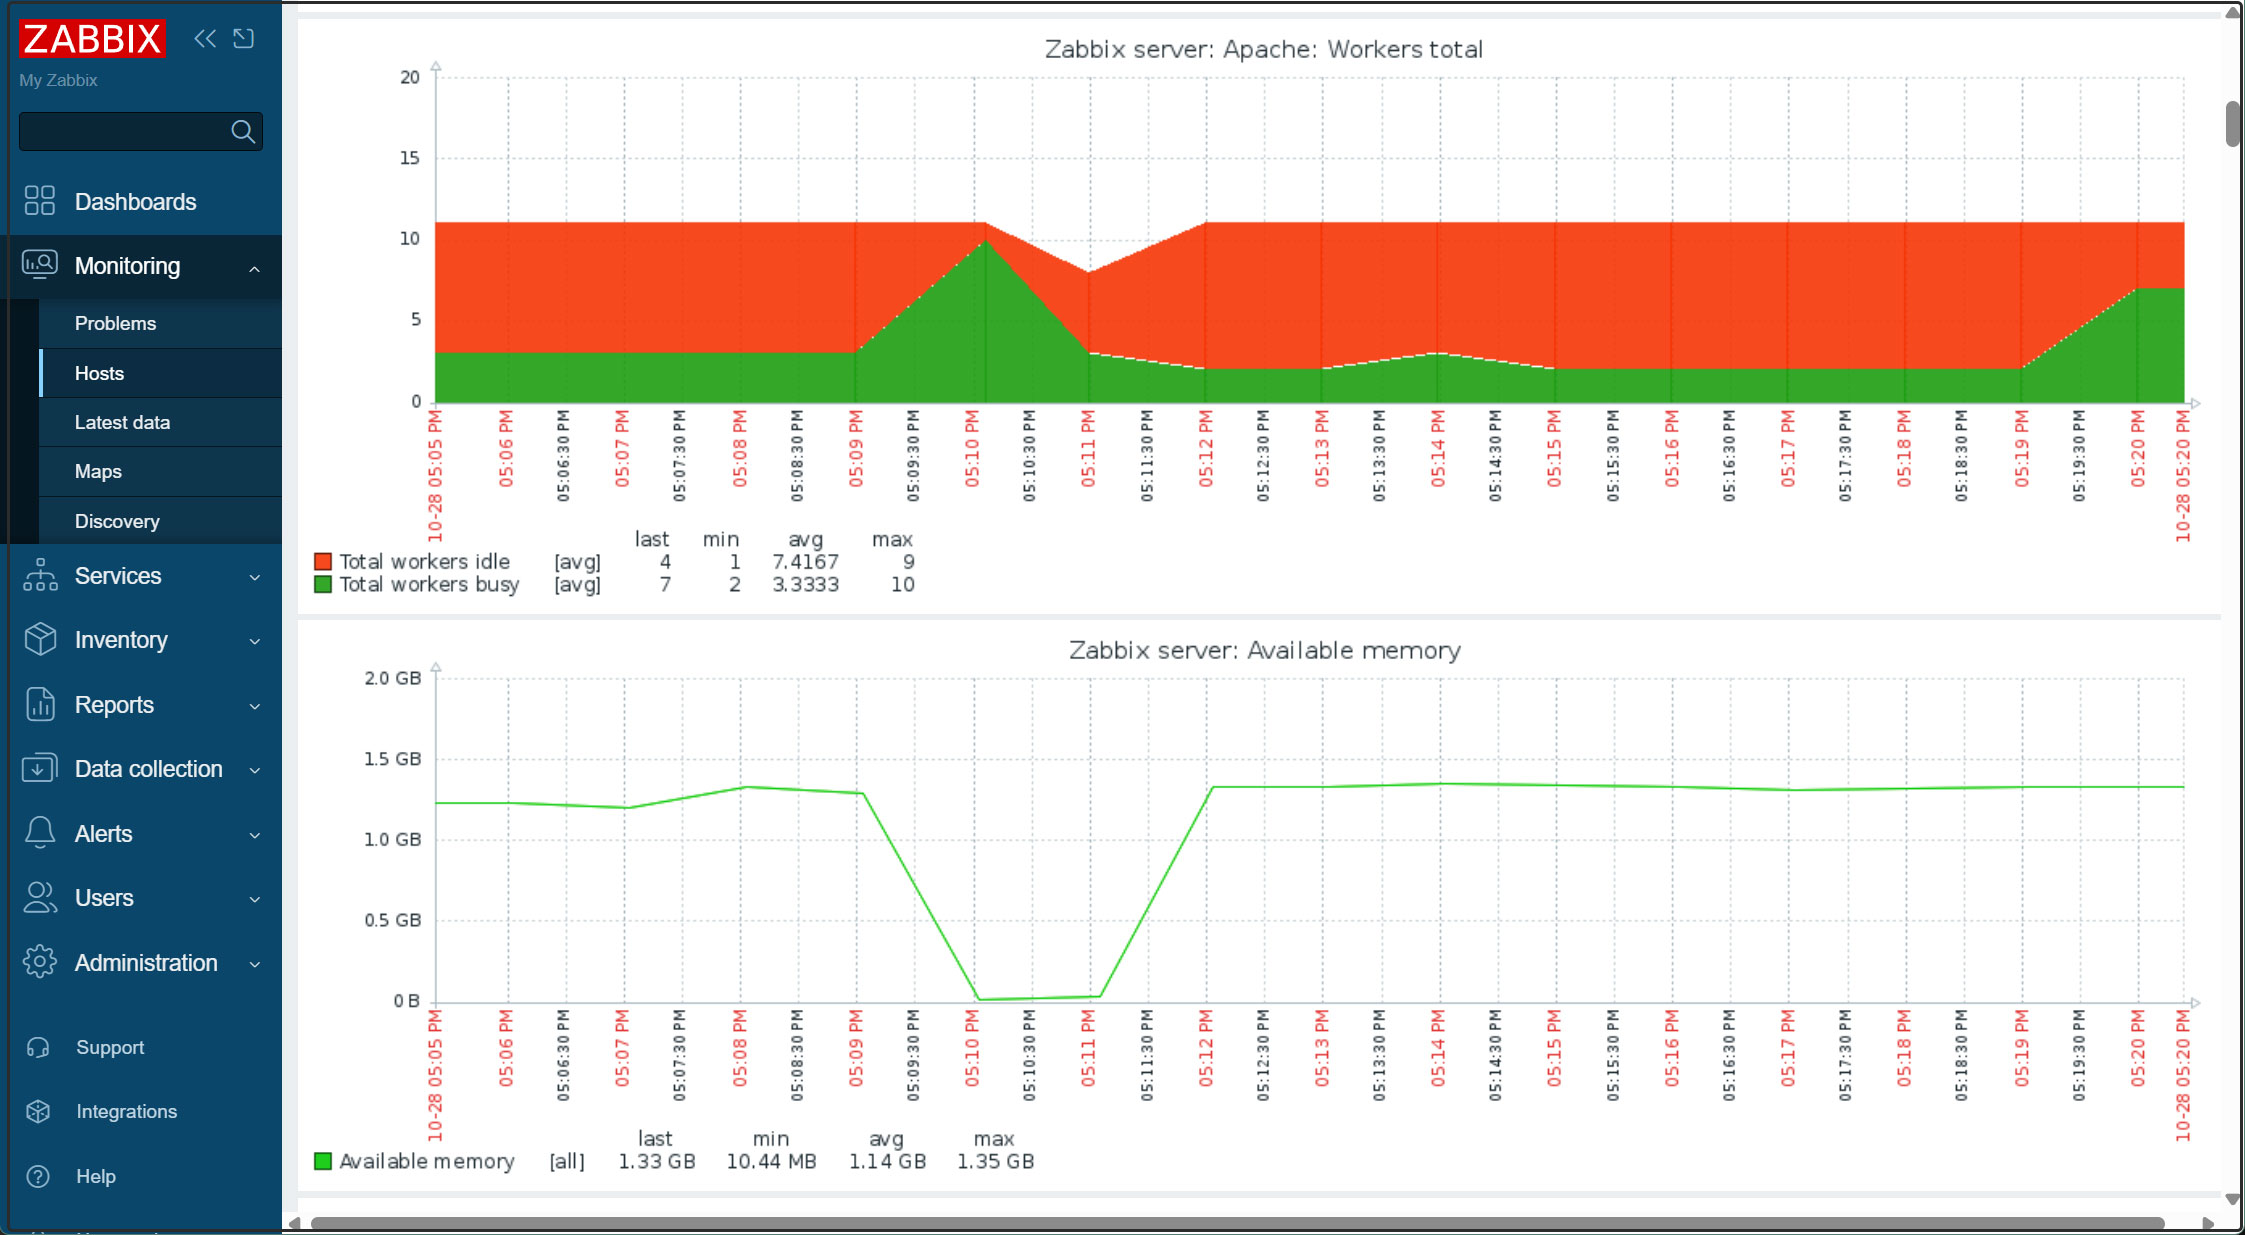
In the left pane, click [Monitoring] > [Hosts]. In the right pane, click [Zabbix server] and select [Graphs].
After a short while, the data will be displayed as shown below.