

Prerequisites
1.Suricata
SURICATA IDS/IPS is an open source IDS that monitors communications on the network and detects suspicious traffic.
The basic mechanism is signature-based, so it can detect predefined unauthorized communications. Suricata is also characterized by its ability to provide protection as well as detection.
2.Elasticsearch,Kibana,Filebeat
Install and configure the Elastic Stack so you can visualize and search SURICATA logs using Kibana and Filebeat
In this session, we will install Suricata IDS and ElasticStack on the following server:
・First Server Suricata IDS & Filebeat : openSUSE 16.1 (IP : 192.168.11.83)
・Second server Elasticsearch & kibana : openSUSE 16.1 (IP : 192.168.11.85)
First Server : Suricata Install
1.Suricata Installation and Configuration
①Suricata Install
Also, since openSUSE16 does not have an official Suricata repository, we will use the experimental openSUSE16.0 repository.
# zypper addrepo https://download.opensuse.org/repositories/server:monitoring/16.0/server:monitoring.repo
# zypper refresh
# zypper -n install suricata

Version Check
# suricata -V
This is Suricata version 8.0.8 RELEASE
②Determine interface and IP address where Suricata will inspect network packets
# ip --brief add
lo               UNKNOWN        127.0.0.1/8
ens33            UP             192.168.11.83/24
③Edit the configuration file
# vi /etc/suricata/suricata.yaml

Line 18 : Comment it out and add it below it(In the vars section, define the network.)
#HOME_NET: "[192.168.0.0/16,10.0.0.0/8,172.16.0.0/12]"
HOME_NET: "[192.168.11.0/24]"

Per Line 158 : Change
community-id: false → community-id: true

Per Line 661 : Set the interface name for the af-packet section
af-packet:
    - interface: ens33
# vi /etc/sysconfig/suricata

Line 9: Specify the interface
 SURICATA_OPTIONS="-c /etc/suricata/suricata.yaml -i ens33"
④Setting Directory Groups and Permissions
/etc/suricata、 /var/lib/suricata、/var/log/suricata
Add the above directory to the suricata group and set read and write permissions.
⑤Suricata rules update
# suricata-update
⑥Activate Suricata
# systemctl start suricata
# systemctl enable --now suricata
Created symlink '/etc/systemd/system/multi-user.target.wants/suricata.service' → '/usr/lib/systemd/system/suricata.service'.
⑦Confirm Suricata startup
# systemctl status suricata

● suricata.service - Suricata Intrusion Detection and Prevention Tool
     Loaded: loaded (/usr/lib/systemd/system/suricata.service; enabled; preset: disabled)
     Active: active (running) since Tue 2026-11-17 10:13:14 JST; 14s ago
 Invocation: 74b02f924f60463d8b030bffbcaac09a
       Docs: man:suricata(1)
   Main PID: 4634 (Suricata-Main)
      Tasks: 7 (limit: 2229)
        CPU: 207ms
     CGroup: /system.slice/suricata.service
             └─4634 /usr/bin/suricata -c /etc/suricata/suricata.yaml -i ens33

Nov 17 10:13:14 Lepard systemd[1]: Started Suricata Intrusion Detection and Prevention Tool.
Nov 17 10:13:14 Lepard suricata[4634]: i: suricata: This is Suricata version 8.0.8 RELEASE running in SYSTEM mode
Nov 17 10:13:14 Lepard suricata[4634]: W: detect: No rule files match the pattern /var/lib/suricata/rules/suricata.rules
Nov 17 10:13:14 Lepard suricata[4634]: W: detect: 1 rule files specified, but no rules were loaded!
Nov 17 10:13:14 Lepard suricata[4634]: W: mpm-hs: Failed to create Hyperscan cache folder, make sure the  parent folder is writeable or>
Nov 17 10:13:14 Lepard suricata[4634]: i: threads: Threads created -> W: 1 FM: 1 FR: 1   Engine started.
Check Log
# tail /var/log/suricata/suricata.log

[4634 - Suricata-Main] 2026-11-17 10:13:14 Info: logopenfile: stats output device (regular) initialized: stats.log
[4634 - Suricata-Main] 2026-11-17 10:13:14 Warning: detect: No rule files match the pattern /var/lib/suricata/rules/suricata.rules
[4634 - Suricata-Main] 2026-11-17 10:13:14 Warning: detect: 1 rule files specified, but no rules were loaded!
[4634 - Suricata-Main] 2026-11-17 10:13:14 Info: threshold-config: Threshold config parsed: 0 rule(s) found
[4634 - Suricata-Main] 2026-11-17 10:13:14 Info: detect: 0 signatures processed. 0 are IP-only rules, 0 are inspecting packet payload, 0 inspect application layer, 0 are decoder event only
[4634 - Suricata-Main] 2026-11-17 10:13:14 Warning: mpm-hs: Failed to create Hyperscan cache folder, make sure the  parent folder is writeable or adjust sgh-mpm-caching-path setting (/var/lib/suricata/cache/sgh)
[4634 - Suricata-Main] 2026-11-17 10:13:14 Info: unix-manager: unix socket '/var/run/suricata/suricata-command.socket'
[4634 - Suricata-Main] 2026-11-17 10:13:14 Info: runmodes: ens33: creating 1 thread
[4639 - W#01-ens33] 2026-11-17 10:13:14 Info: ioctl: ens33: MTU 1500
[4634 - Suricata-Main] 2026-11-17 10:13:14 Notice: threads: Threads created -> W: 1 FM: 1 FR: 1   Engine started.
Check the stats.log file for statistics (updated every 8 seconds by default)
# tail -f /var/log/suricata/stats.log
A more advanced output, EVE JSON, can be generated with the following command
# tail -f /var/log/suricata/eve.json
2.Setting up Suricata Rules
①Display of rule sets packaged in Suricata
# ls -al /var/lib/suricata/rules/
total 45096
drwxr-x--- 1 root     root           70 Nov 17 10:13 .
drwxr-x--- 1 suricata suricata       32 Nov 17 10:03 ..
-rw-r--r-- 1 root     root         3228 Nov 17 10:13 classification.config
-rw-r--r-- 1 root     root     46172194 Nov 17 10:13 suricata.rules
②Index list of sources providing rule sets
# suricata-update list-sources

Name: abuse.ch/feodotracker
  Vendor: Abuse.ch
  Summary: Abuse.ch Feodo Tracker Botnet C2 IP ruleset
  License: CC0-1.0
Name: abuse.ch/sslbl-blacklist
  Vendor: Abuse.ch
  Summary: Abuse.ch SSL Blacklist
  License: CC0-1.0
  Replaces: sslbl/ssl-fp-blacklist
Name: abuse.ch/sslbl-ja3
  Vendor: Abuse.ch
  Summary: Abuse.ch Suricata JA3 Fingerprint Ruleset
  License: CC0-1.0
  Replaces: sslbl/ja3-fingerprints
Name: abuse.ch/urlhaus
  Vendor: abuse.ch
  Summary: Abuse.ch URLhaus Suricata Rules
  License: CC0-1.0
Name: aleksibovellan/nmap
  Vendor: aleksibovellan
  Summary: Suricata IDS/IPS Detection Rules Against NMAP Scans
  License: MIT
Name: et/open
  Vendor: Proofpoint
  Summary: Emerging Threats Open Ruleset
  License: MIT
Name: et/pro
  Vendor: Proofpoint
  Summary: Emerging Threats Pro Ruleset
  License: Commercial
  Replaces: et/open
  Parameters: secret-code
  Subscription: https://www.proofpoint.com/us/threat-insight/et-pro-ruleset
Name: etnetera/aggressive
  Vendor: Etnetera a.s.
  Summary: Etnetera aggressive IP blacklist
  License: MIT
Name: ipfire/dbl
  Vendor: IPFire
  Summary: IPFire DBL
  License: CC-BY-SA-4.0
Name: julioliraup/antiphishing
  Vendor: julioliraup
  Summary: Antiphishing for protection against phishing attacks
  License: GPL-3.0
Name: oisf/trafficid
  Vendor: OISF
  Summary: Suricata Traffic ID ruleset
  License: MIT
Name: pawpatrules
  Vendor: pawpatrules
  Summary: PAW Patrules is a collection of rules for IDPS / NSM Suricata engine
  License: CC-BY-SA-4.0
Name: ptrules/open
  Vendor: Positive Technologies
  Summary: Positive Technologies Open Ruleset
  License: Custom
Name: scwx/enhanced
  Vendor: Secureworks
  Summary: Secureworks suricata-enhanced ruleset
  License: Commercial
  Parameters: secret-code
  Subscription: https://www.secureworks.com/contact/ (Please reference CTU Countermeasures)
Name: scwx/malware
  Vendor: Secureworks
  Summary: Secureworks suricata-malware ruleset
  License: Commercial
  Parameters: secret-code
  Subscription: https://www.secureworks.com/contact/ (Please reference CTU Countermeasures)
Name: scwx/security
  Vendor: Secureworks
  Summary: Secureworks suricata-security ruleset
  License: Commercial
  Parameters: secret-code
  Subscription: https://www.secureworks.com/contact/ (Please reference CTU Countermeasures)
Name: stamus/lateral
  Vendor: Stamus Networks
  Summary: Lateral movement rules
  License: GPL-3.0-only
Name: stamus/nrd-14-open
  Vendor: Stamus Networks
  Summary: Newly Registered Domains Open only - 14 day list, complete
  License: Commercial
  Parameters: secret-code
  Subscription: https://www.stamus-networks.com/stamus-labs/subscribe-to-threat-intel-feed
Name: stamus/nrd-30-open
  Vendor: Stamus Networks
  Summary: Newly Registered Domains Open only - 30 day list, complete
  License: Commercial
  Parameters: secret-code
  Subscription: https://www.stamus-networks.com/stamus-labs/subscribe-to-threat-intel-feed
Name: stamus/nrd-entropy-14-open
  Vendor: Stamus Networks
  Summary: Newly Registered Domains Open only - 14 day list, high entropy
  License: Commercial
  Parameters: secret-code
  Subscription: https://www.stamus-networks.com/stamus-labs/subscribe-to-threat-intel-feed
Name: stamus/nrd-entropy-30-open
  Vendor: Stamus Networks
  Summary: Newly Registered Domains Open only - 30 day list, high entropy
  License: Commercial
  Parameters: secret-code
  Subscription: https://www.stamus-networks.com/stamus-labs/subscribe-to-threat-intel-feed
Name: stamus/nrd-phishing-14-open
  Vendor: Stamus Networks
  Summary: Newly Registered Domains Open only - 14 day list, phishing
  License: Commercial
  Parameters: secret-code
  Subscription: https://www.stamus-networks.com/stamus-labs/subscribe-to-threat-intel-feed
Name: stamus/nrd-phishing-30-open
  Vendor: Stamus Networks
  Summary: Newly Registered Domains Open only - 30 day list, phishing
  License: Commercial
  Parameters: secret-code
  Subscription: https://www.stamus-networks.com/stamus-labs/subscribe-to-threat-intel-feed
Name: tgreen/hunting
  Vendor: tgreen
  Summary: Threat hunting rules
  License: GPLv3
③Enable source (if tgreen/hunting is enabled)
# suricata-update enable-source tgreen/hunting

17/11/2026 -- 10:28:22 - <Info> -- Using data-directory /var/lib/suricata.
17/11/2026 -- 10:28:22 - <Info> -- Using Suricata configuration /etc/suricata/suricata.yaml
17/11/2026 -- 10:28:22 - <Info> -- Using /usr/share/suricata/rules for Suricata provided rules.
17/11/2026 -- 10:28:22 - <Info> -- Found Suricata version 8.0.8 at /usr/bin/suricata.
17/11/2026 -- 10:28:22 - <Warning> -- Source index does not exist, will use bundled one.
17/11/2026 -- 10:28:22 - <Warning> -- Please run suricata-update update-sources.
17/11/2026 -- 10:28:22 - <Info> -- Creating directory /var/lib/suricata/update/sources
17/11/2026 -- 10:28:22 - <Info> -- Enabling default source et/open
17/11/2026 -- 10:28:22 - <Info> -- Source tgreen/hunting enabled
Perform update
# suricata-update update-sources
Restart Suricata service
# systemctl restart suricata
3.Creating Suricata Custom Rules
①Create files containing customer rules
# vi /var/lib/suricata/rules/local.rules
The following content is included:
alert icmp any any -> any any (msg:"ICMP Ping"; sid:100001; rev:1;)
②Edit configuration file (define new rule paths)
# vi /etc/suricata/suricata.yaml

# Add around line 2344
default-rule-path: /var/lib/suricata/rules

rule-files:
  - suricata.rules
  - local.rules
③Testing the configuration file
# suricata -T -c /etc/suricata/suricata.yaml -v

Notice: suricata: This is Suricata version 8.0.8 RELEASE running in SYSTEM mode
Info: cpu: CPUs/cores online: 1
Info: suricata: Running suricata under test mode
Info: suricata: Setting engine mode to IDS mode by default
Info: exception-policy: master exception-policy set to: auto
Info: logopenfile: fast output device (regular) initialized: fast.log
Info: logopenfile: eve-log output device (regular) initialized: eve.json
Info: logopenfile: stats output device (regular) initialized: stats.log
Info: detect: 2 rule files processed. 53496 rules successfully loaded, 0 rules failed, 0 rules skipped
Info: threshold-config: Threshold config parsed: 0 rule(s) found
Info: detect: 53501 signatures processed. 1253 are IP-only rules, 4533 are inspecting packet payload, 47478 inspect application layer, 111 are decoder event only
Notice: suricata: Configuration provided was successfully loaded. Exiting.
Restart Suricat service
# systemctl restart suricata
④Testing the application of Custom Rules
Ping another device on the same local network to see if it was logged
# cat /var/log/suricata/fast.log

11/17/2026-10:38:21.133936  [**] [1:100001:1] ICMP Ping [**] [Classification: (null)] [Priority: 3] {ICMP} 192.168.11.36:8 -> 192.168.11.83:0
11/17/2026-10:38:21.134053  [**] [1:100001:1] ICMP Ping [**] [Classification: (null)] [Priority: 3] {ICMP} 192.168.11.83:0 -> 192.168.11.36:0
To get the JSON log, run the following command and ping another device on the same local network:
# tail -f /var/log/suricata/eve.json | jq 'select(.event_type=="alert")'
When you run `ping`, the following is displayed on the console:
{
  "timestamp": "2026-11-17T10:43:47.547139+0900",
  "flow_id": 942033052752383,
  "in_iface": "ens33",
  "event_type": "alert",
  "src_ip": "192.168.11.83",
  "dest_ip": "192.168.11.36",
  "proto": "ICMP",
  "ip_v": 4,
  "icmp_type": 0,
  "icmp_code": 0,
  "pkt_src": "wire/pcap",
  "community_id": "1:B4WWXkE+Ieq0Qp+hLzDE61rsttA=",
  "alert": {
    "action": "allowed",
    "gid": 1,
    "signature_id": 100001,
    "rev": 1,
    "signature": "ICMP Ping",
    "category": "",
    "severity": 3
  },
5. Configuring Suricata as an IPS
Configure Suricata to start in IPS mode to drop malicious network traffic.
①Edit the SURICATA configuration file located at /etc/sysconfig/suricata
# vi /etc/sysconfig/suricata

Line 9 : Add this as a comment, and add the following below it (to instruct SURICATA to run in IPS mode)
#SURICATA_OPTIONS="-c /etc/suricata/suricata.yaml -i ens33"
SURICATA_OPTIONS="-c /etc/suricata/suricata.yaml -q 0 -vvv "
➁Restart Suricata
# systemctl daemon-reload
# systemctl restart suricata.service
Check Status
# systemctl status suricata.service

● suricata.service - Suricata Intrusion Detection and Prevention Tool
     Loaded: loaded (/usr/lib/systemd/system/suricata.service; enabled; preset: disabled)
     Active: active (running) since Tue 2026-11-17 10:48:18 JST; 21s ago
 Invocation: d4f5b14b6d804281a0cb229b3f51acce
       Docs: man:suricata(1)
   Main PID: 4908 (Suricata-Main)
      Tasks: 9 (limit: 2229)
        CPU: 11.069s
     CGroup: /system.slice/suricata.service
             └─4908 /usr/bin/suricata -c /etc/suricata/suricata.yaml -q 0 -vvv

Nov 17 10:48:29 Lepard suricata[4908]: [4908] Perf: mpm-hs-cache: rule group caching - loaded: 121 newly cached: 0 total cacheable: 121
Nov 17 10:48:29 Lepard suricata[4908]: [4908] Info: unix-manager: unix socket '/var/run/suricata/suricata-command.socket'
Nov 17 10:48:29 Lepard suricata[4908]: [4908] Config: tmqh-flow: AutoFP mode using "Hash" flow load balancer
Nov 17 10:48:29 Lepard suricata[4908]: [4916] Info: nfq: binding this thread 0 to queue '0'
Nov 17 10:48:29 Lepard suricata[4908]: [4916] Info: nfq: setting queue length to 4096
Nov 17 10:48:29 Lepard suricata[4908]: [4916] Info: nfq: setting nfnl bufsize to 6144000
Nov 17 10:48:29 Lepard suricata[4908]: [4908] Config: flow-manager: using 1 flow manager threads
Nov 17 10:48:29 Lepard suricata[4908]: [4908] Config: flow-manager: using 1 flow recycler threads
Nov 17 10:48:29 Lepard suricata[4908]: [4908] Config: log-flush: log flusher thread not used with heartbeat.output-flush-interval of 0
Nov 17 10:48:29 Lepard suricata[4908]: [4908] Notice: threads: Threads created -> RX: 1 W: 1 TX: 1 FM: 1 FR: 1   Engine started.
➂Direct incoming network traffic to Suricata's NFQUEUE
The recommended configuration is to build a native nftables table independent of firewalld, bypass SSH, and send it to queue num 0 bypass, without relying on firewalld --direct, which is expected to be deprecated in the future.
This configuration allows packets to be passed safely to Suricata (IPS mode) without being affected by firewalld configuration changes or reloads.
Creating an nftables configuration file(This time it's /etc/nftables/suricata_ips.nft)(SSH port is 2244)
# vi /etc/nftables/suricata_ips.nft

Fill in the following
#!/usr/sbin/nft -f

# Delete and recreate existing tables if any to prevent duplicates on reload
table inet suricata_ips
delete table inet suricata_ips

table inet suricata_ips {
    # Specifies whether to evaluate before or after firewalld (filter: priority 0)
    # If you want to inspect it first as an inline IPS, specify priority -10 or similar
    chain ips_forward {
        type filter hook forward priority -10; policy accept;

        # In established or related communications, if the process is not already marked, it will be carried as is, or、
        # If you want Suricata to inspect all packets, just stream them down

        # 1. Bypass SSH (TCP 2244) forward communication
        tcp dport 2244 accept
        tcp sport 2244 accept

        # 2. Send other forward communications to Suricata (NFQUEUE 0)
        # The bypass flag allows Suricata to pass without blocking communication when stopped
        queue num 0 bypass
    }

    chain ips_input {
        type filter hook input priority -10; policy accept;

        # Bypass local loopback communication
        iifname "lo" accept

        # 1. Bypass SSH (TCP 2244) to the host (administrative lockout prevention)
        tcp dport 2244 accept

        # 2. Send other input communications to Suricata (NFQUEUE 0)
        queue num 0 bypass
    }
 chain ips_output {
        type filter hook output priority -10; policy accept;

        # Bypass local loopback communication
        oifname "lo" accept

        # 1. Bypass host SSH (TCP 2244) responses and communications
        tcp sport 2244 accept

        # 2. Send other output communications to Suricata (NFQUEUE 0)
        queue num 0 bypass
    }
}
Syntax Check
# nft -f /etc/nftables/suricata_ips.nft
Checking table contents
# nft list table inet suricata_ips

table inet suricata_ips {
        chain ips_forward {
                type filter hook forward priority filter - 10; policy accept;
                tcp dport 2244 accept
                tcp sport 2244 accept
                queue flags bypass to 0
        }

        chain ips_input {
                type filter hook input priority filter - 10; policy accept;
                iifname "lo" accept
                tcp dport 2244 accept
                queue flags bypass to 0
        }

        chain ips_output {
                type filter hook output priority filter - 10; policy accept;
                oifname "lo" accept
                tcp sport 2244 accept
                queue flags bypass to 0
        }
}
Creating a systemd service (suricata-nftables.service)
# vi /etc/systemd/system/suricata-nftables.service

Fill in the following
[Unit]
Description=Load Suricata IPS nftables rules
Before=suricata.service
After=network-pre.target firewalld.service

[Service]
Type=oneshot
RemainAfterExit=yes
ExecStart=/usr/sbin/nft -f /etc/nftables/suricata_ips.nft
ExecReload=/usr/sbin/nft -f /etc/nftables/suricata_ips.nft
ExecStop=/usr/sbin/nft delete table inet suricata_ips

[Install]
WantedBy=multi-user.target
Activating and launching services
# systemctl daemon-reload
# systemctl enable --now suricata-nftables.service
④Verify that SURICATA is dropping traffic correctly
Change/var/lib/suricata/rules/local.rules to drop
# vi /var/lib/suricata/rules/local.rules

drop icmp any any -> any any (msg:"ICMP Ping"; sid:100001; rev:1;)
⑤Restart Suricata service
# systemctl restart suricata
⑥When I ping from another device on my local local network and check eve.json
"action": "blocked"
# jq 'select(.alert .signature_id==100001)' /var/log/suricata/eve.json

{
  "timestamp": "2026-11-17T13:05:09.644279+0900",
  "flow_id": 1641258569531144,
  "event_type": "alert",
  "src_ip": "192.168.11.36",
  "dest_ip": "192.168.11.83",
  "proto": "ICMP",
  "ip_v": 4,
  "icmp_type": 8,
  "icmp_code": 0,
  "pkt_src": "wire/pcap",
  "community_id": "1:B4WWXkE+Ieq0Qp+hLzDE61rsttA=",
  "alert": {
    "action": "blocked",
    "gid": 1,
    "signature_id": 100001,
    "rev": 1,
    "signature": "ICMP Ping",
    "category": "",
    "severity": 3
  },
Integration of the ELK Stack and Suricata
Install and configure the Elastic Stack to visualize and search SURICATA logs more efficiently
This section will generally be performed on a second openSUSE16.1 server.
1. Elasticsearch Install
1.1 Create a repository definition in the /etc/zypp/repos.d/ directory
#  vi /etc/zypp/repos.d/elasticsearch.repo

The following content is recorded
[elasticsearch-9.x]
name=Elasticsearch repository for 9.x packages
baseurl=https://artifacts.elastic.co/packages/9.x/yum
gpgcheck=1
gpgkey=https://artifacts.elastic.co/GPG-KEY-elasticsearch
enabled=1
autorefresh=1
type=rpm-md
1.2 Elasticsearch Install
# zypper refresh
# zypper -n install  elasticsearch
2. Elasticsearch Configuration
Elasticsearch is configured by default to accept only local connections.
Additionally, tools such as Filebeat cannot send logs because authentication is not enabled.
This time, we will configure Elasticsearch's network settings and enable the xpack security module built into Elasticsearch.
2.1 Elasticsearch Network Configuration
Since the Elasticsearch and SURICATA servers are separate, Elasticsearch must be configured to listen for connections on the private network interface.
# vi /etc/elasticsearch/elasticsearch.yml

Line 57 : Add the local address of the Elasticsearch server
#network.host: 192.168.0.1
network.host: 192.168.11.85

Line 62 : Uncomments
http.port: 9200
2.2 Start Elasticsearch
# systemctl daemon-reload
# systemctl enable elasticsearch.service
# systemctl start elasticsearch.service
2.3 Create passwords for elastic and kibana_system
Be sure to copy the passwords for the elastic user and kibana_system user, as they will be needed later.
The kibana_system user is used for configuring Kibana.
The elastic user is used for configuring Filebeat and Auditbeat, and for logging into Kibana.
If you forget your password, you can use the command again to reset it.
[elastic] User password creation
# cd /usr/share/elasticsearch/bin

# ./elasticsearch-reset-password -u elastic
This tool will reset the password of the [elastic] user to an autogenerated value.
The password will be printed in the console.
Please confirm that you would like to continue [y/N]y


Password for the [elastic] user successfully reset.
New value: JRSSm5HMgHrNfbxl92x
※Resetting Elasticsearch Passwords
The automatically generated Elastic user password is too complex, so you can reset it using the /usr/share/elasticsearch/bin/elasticsearch-reset-password command.
To reset your password, execute the command.
# /usr/share/elasticsearch/bin/elasticsearch-reset-password -u elastic -i

This tool will reset the password of the [elastic] user.
You will be prompted to enter the password.
Please confirm that you would like to continue [y/N]y


Enter password for [elastic]:
Re-enter password for [elastic]:
Password for the [elastic] user successfully reset.
[kibana_system] User Password Creation
# cd /usr/share/elasticsearch/bin

# ./elasticsearch-reset-password -u kibana_system
This tool will reset the password of the [kibana_system] user to an autogenerated value.
The password will be printed in the console.
Please confirm that you would like to continue [y/N]y


Password for the [kibana_system] user successfully reset.
New value: weH-u1TXm_pMoLZ*VI-M
3. Installing and Configuring Kibana
This section will also be done on a second openSUSE16.1 server
3.1 Kibana Installation
# zypper -n install kibana
3.2 xpack Security Module Configuration
Enable Kibana's xpack security features to generate several encryption keys that Kibana uses to store data in Elasticsearch.
Encryption keys are created using the kibana-encryption-keys utility located in the /usr/share/kibana/bin directory.
Store the three keys you created in a secure location.
# cd /usr/share/kibana/bin/
# ./kibana-encryption-keys generate -q --force
xpack.encryptedSavedObjects.encryptionKey: b87dad0c5df75ccf027208202074cc5e0d30edcd5543d27283bd627ec8543b1d
xpack.reporting.encryptionKey: 48454e9ff437581f511b09ac1ffcf6c7f3f691edc67c8ae3fdfacb608c0c81e7
xpack.security.encryptionKey: 3bcc36d5c1b020187b7d7399227f5410a5d31e21a9f971e204488e728a507d0b
Add these keys to Kibana's /etc/kibana/kibana.yml configuration file.
# vi /etc/kibana/kibana.yml

Written on the last line
xpack.encryptedSavedObjects.encryptionKey: b87dad0c5df75ccf027208202074cc5e0d30edcd5543d27283bd627ec8543b1d
xpack.reporting.encryptionKey: 48454e9ff437581f511b09ac1ffcf6c7f3f691edc67c8ae3fdfacb608c0c81e7
xpack.security.encryptionKey: 3bcc36d5c1b020187b7d7399227f5410a5d31e21a9f971e204488e728a507d0b
3.3 Kibana Network Configuration
# vi /etc/kibana/kibana.yml

Line 6 : Uncomments
server.port: 5601

Line 12 : Add the server's private IP address (192.168.11.85)
#server.host: "localhost"
server.host: "192.168.11.85"
3.4 Generating a Kibana-Elasticsearch Enrollment Token
To configure a Kibana instance to communicate with an existing Elasticsearch cluster with security enabled, an enrollment token is required. An enrollment token for Kibana can be generated using the following command:
# /usr/share/elasticsearch/bin/elasticsearch-create-enrollment-token -s kibana
eyJ2ZXIiOiI4LjE0LjAiLCJhZHIiOlsiMTkyLjE2OC4xMS44NTo5MjAwIl0sImZnciI6IjY1NTAyY2Y4ZGIwMWVkOWFjZThjNTE0MWY1ZTA4ZDM3MmYxZmY0YWM4Y2Q4NWU1NzNjNTA5ODgyMDFlZWE0NTgiLCJrZXkiOiI2VzhjNktFQjBIMDZMVllkUXRCWTpQemdfekExcW16OGpMZlFxUmhpTnl3In0=
3.5 Starting Kibana
Launch Kibana 9 and configure it to run at system startup.
# systemctl enable --now kibana
# systemctl start kibana
Check Status
# systemctl status kibana

● kibana.service - Kibana
     Loaded: loaded (/usr/lib/systemd/system/kibana.service; enabled; preset: disabled)
     Active: active (running) since Tue 2026-11-17 15:05:52 JST; 1min 8s ago
 Invocation: b7b71e4b29c04adc80cdd240a82254a5
       Docs: https://www.elastic.co
   Main PID: 10817 (MainThread)
      Tasks: 11 (limit: 4567)
        CPU: 10.726s
     CGroup: /system.slice/kibana.service
             └─10817 /usr/share/kibana/bin/../node/default/bin/node /usr/share/kibana/bin/../node_modules/@kbn/cli/kibana/dist

Nov 17 15:05:54 Lion kibana[10817]: Native global console methods have been overridden in production environment.
Nov 17 15:05:56 Lion kibana[10817]: [2026-11-17T15:05:56.310+09:00][INFO ][root] Kibana is starting
Nov 17 15:05:56 Lion kibana[10817]: [2026-11-17T15:05:56.382+09:00][INFO ][node] Kibana process configured with roles: [background_tasks, ui]
Nov 17 15:06:03 Lion kibana[10817]: [2026-11-17T15:06:03.806+09:00][INFO ][plugins-service] The following plugins are disabled: "cloudChat,cloudExperiments,cloudFullStory,dataFederation,dataUsage,developerToolbar,evals,inbox,notific>
Nov 17 15:06:03 Lion kibana[10817]: [2026-11-17T15:06:03.901+09:00][INFO ][http.server.Preboot] http server running at http://192.168.11.85:5601
Nov 17 15:06:04 Lion kibana[10817]: [2026-11-17T15:06:04.065+09:00][INFO ][plugins-system.preboot] Setting up [1] plugins: [interactiveSetup]
Nov 17 15:06:04 Lion kibana[10817]: [2026-11-17T15:06:04.078+09:00][INFO ][preboot] "interactiveSetup" plugin is holding setup: Validating Elasticsearch connection configuration…
Nov 17 15:06:04 Lion kibana[10817]: [2026-11-17T15:06:04.106+09:00][INFO ][root] Holding setup until preboot stage is completed.
Nov 17 15:06:11 Lion kibana[10817]: i Kibana has not been configured.
Nov 17 15:06:11 Lion kibana[10817]: Go to http://192.168.11.85:5601/?code=452078 to get started.
The following appears toward the end of the output:
Go to http://192.168.11.85:5601/?code=452078 to get started.
Copy the provided Kibana URL (including the code) and use it in your browser to access Kibana and complete the setup.
4. Accessing the Kibana 9 Dashboard
If the firewall is running, open the Kibana port.
# firewall-cmd --add-port=5601/tcp --permanent
# firewall-cmd --reload
Accsess http://192.168.11.85:5601/?code=452078
(Copy each person's appropriate address)
When you access Kibana 9, the welcome page prompts you to configure Elastic.
First, enter the generated registration token.
Copy the Kibana token generated using the command /usr/share/elasticsearch/bin/elasticsearch-create-enrollment-token -s kibana and paste it into the box
※If you see the message "Copy the code from the Kibana server or run bin\kibana-verification-code.bat to get it," run the following and enter the 6-digit verification code that will be displayed
# /usr/share/kibana/bin/kibana-verification-code
Your verification code is:  xxx xxx
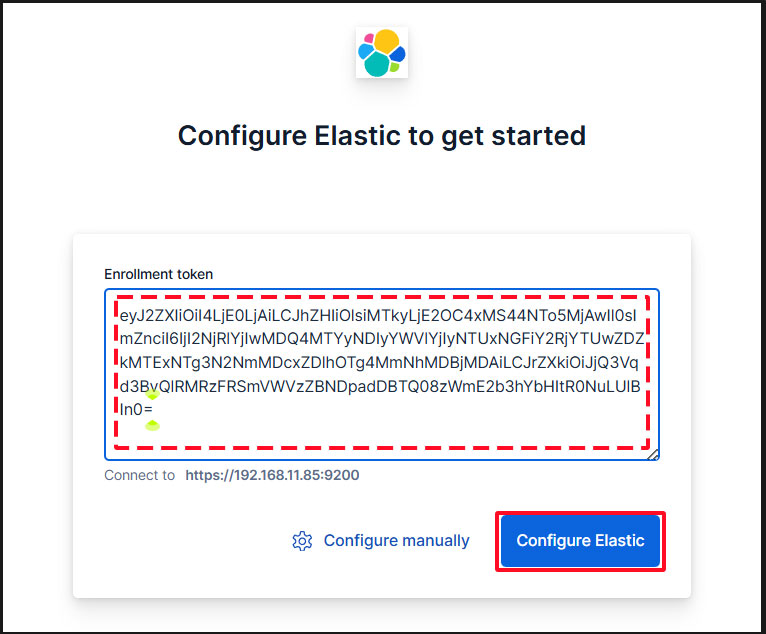
Paste the token, and Kibana will automatically connect to Elasticsearch.
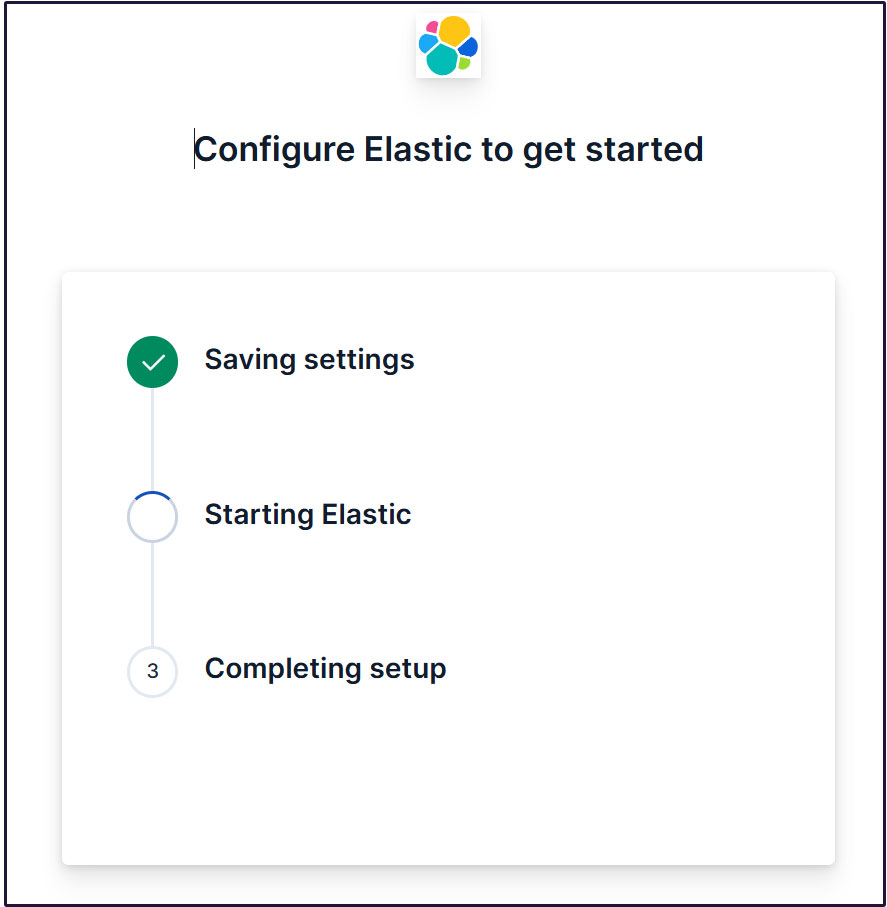
Click Configure Elastic. The settings will be saved, and Elasticsearch will be configured and restarted.
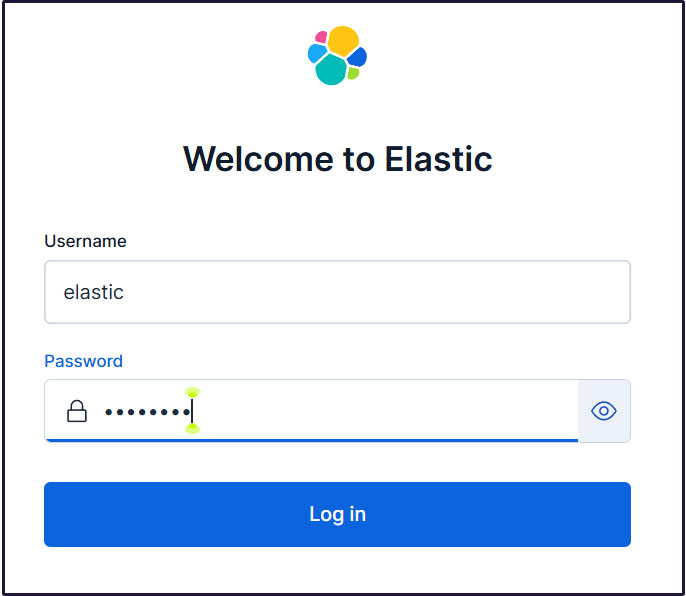
Proceed to the login page. Log in using the generated Elastic user credentials.
Username : elastic
Password : Password regenerated for clarity
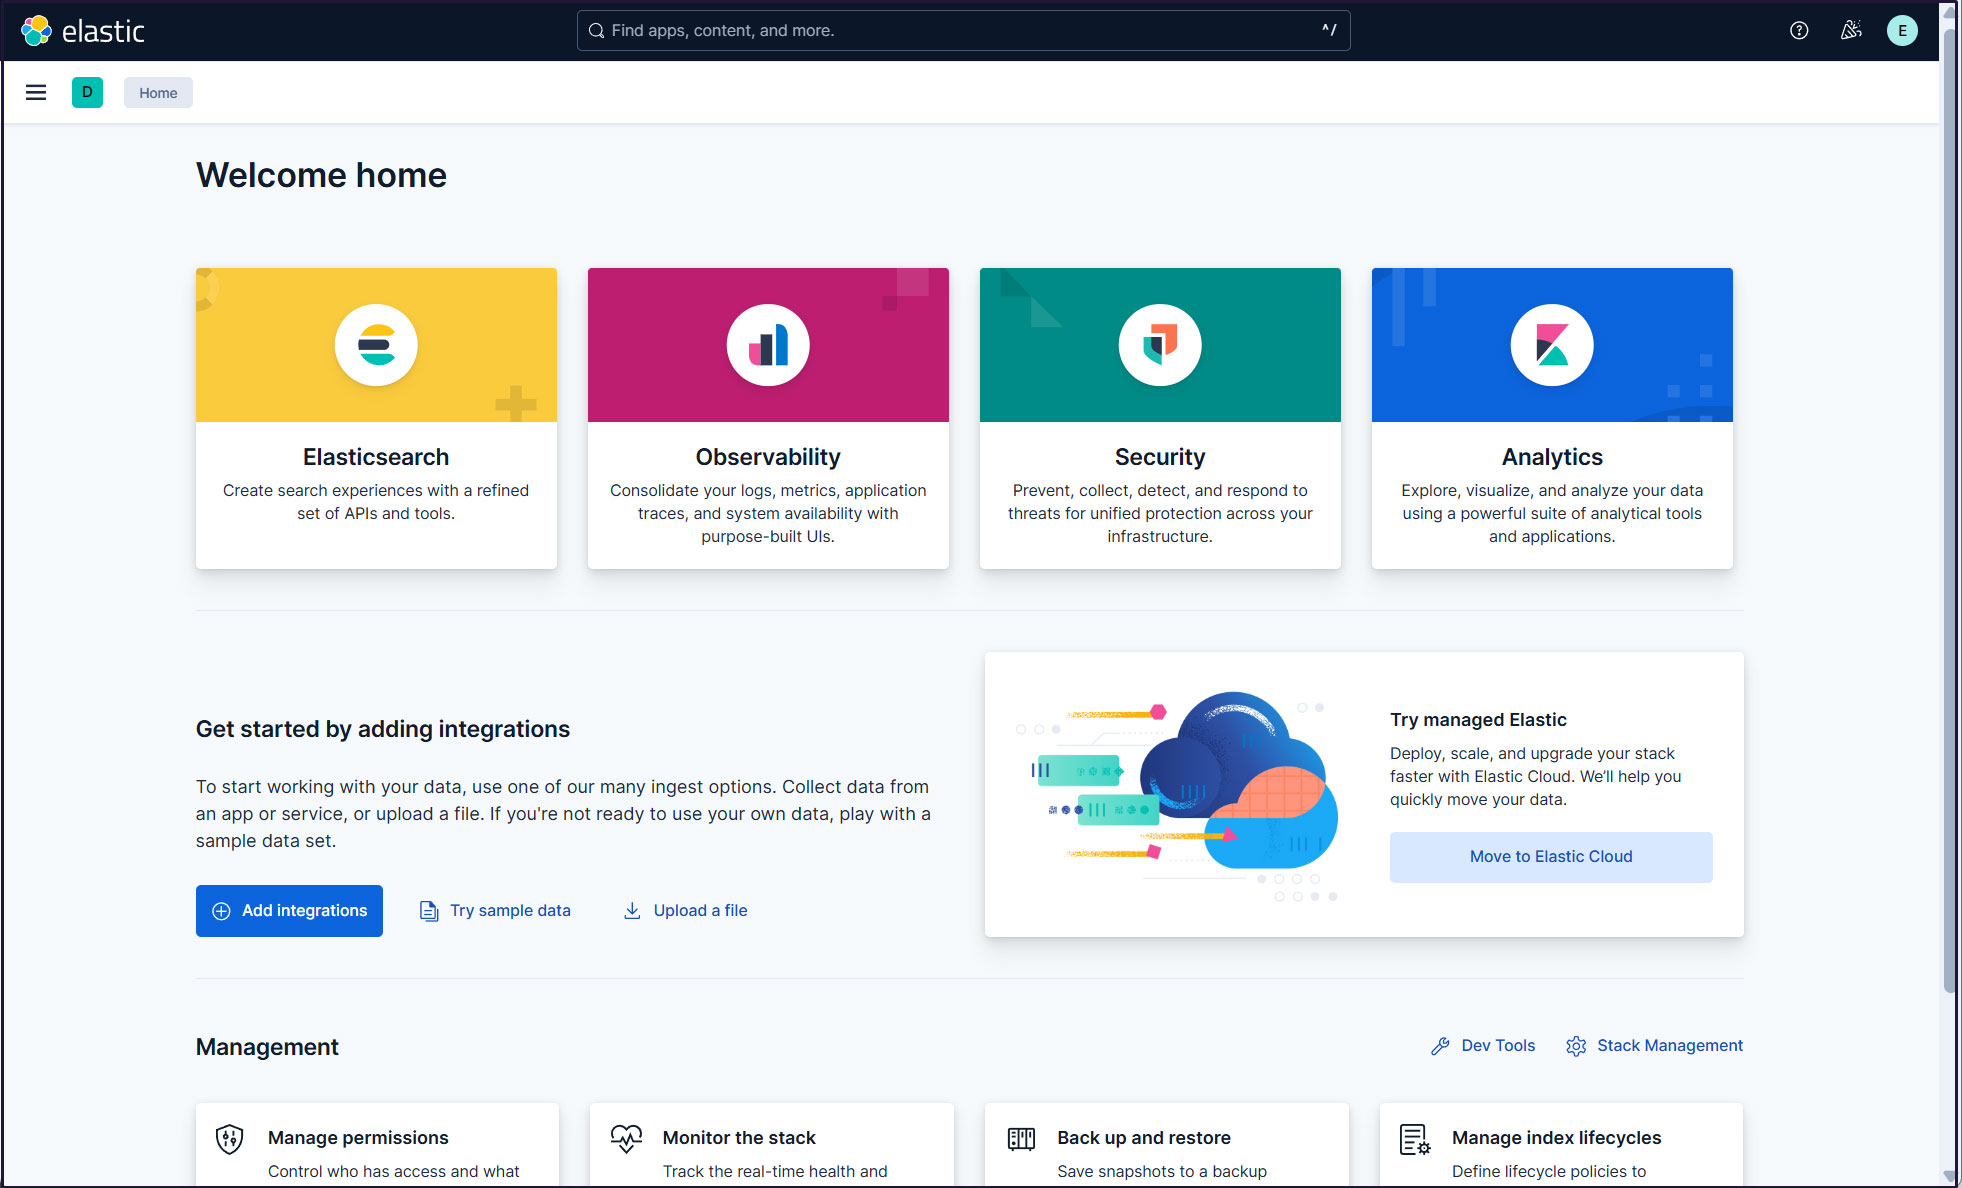
On the welcome page, click "Explore on my own" to proceed to the Kibana 9.x dashboard.

Create a new user account so that you do not need to use the elastic superuser account.
Open the main menu, then navigate to Stack Management > Security > Users
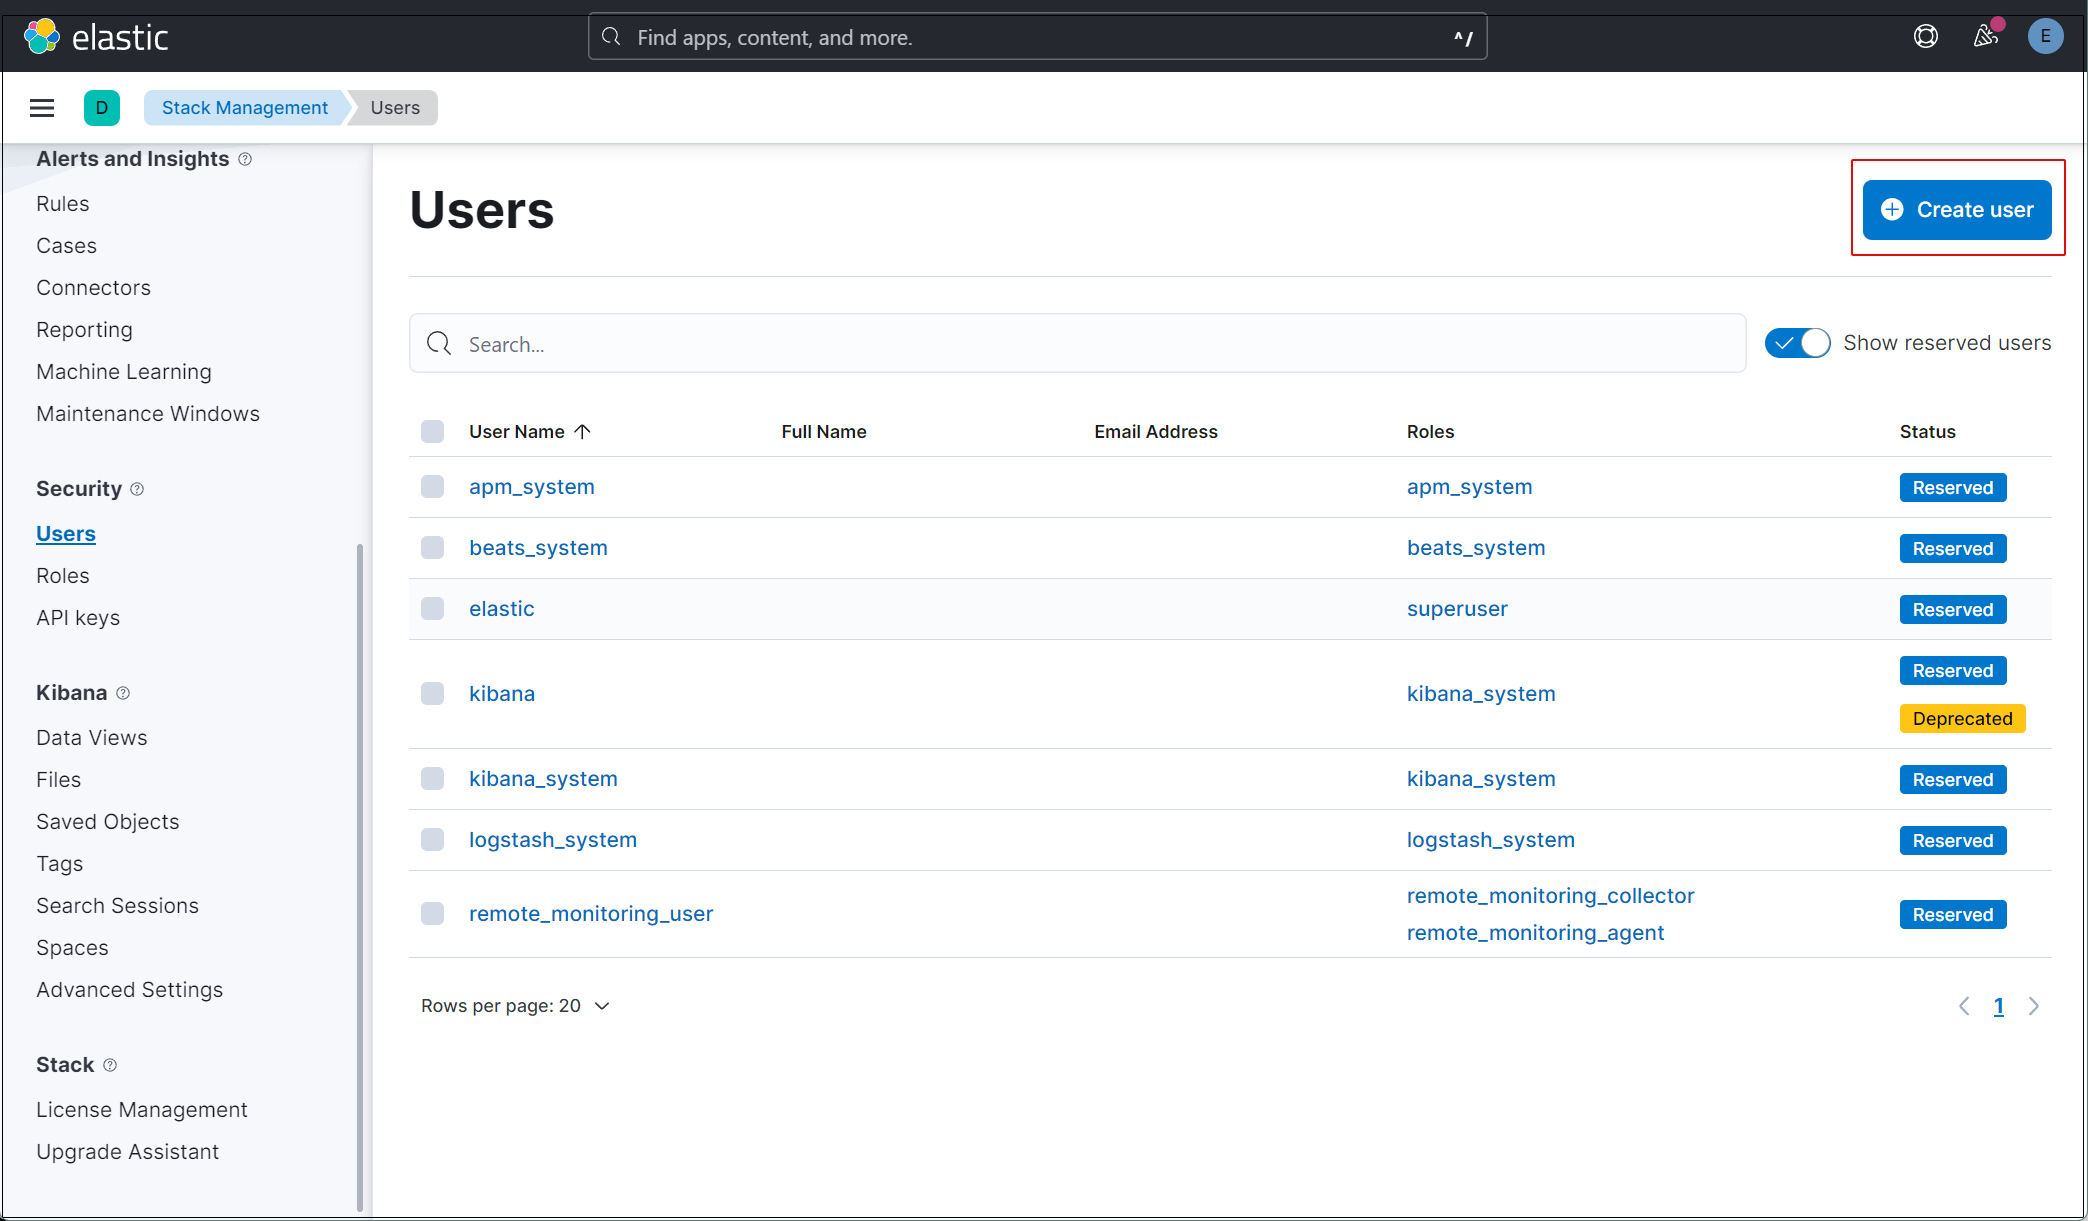
Click the "Create user" button in the upper right corner.
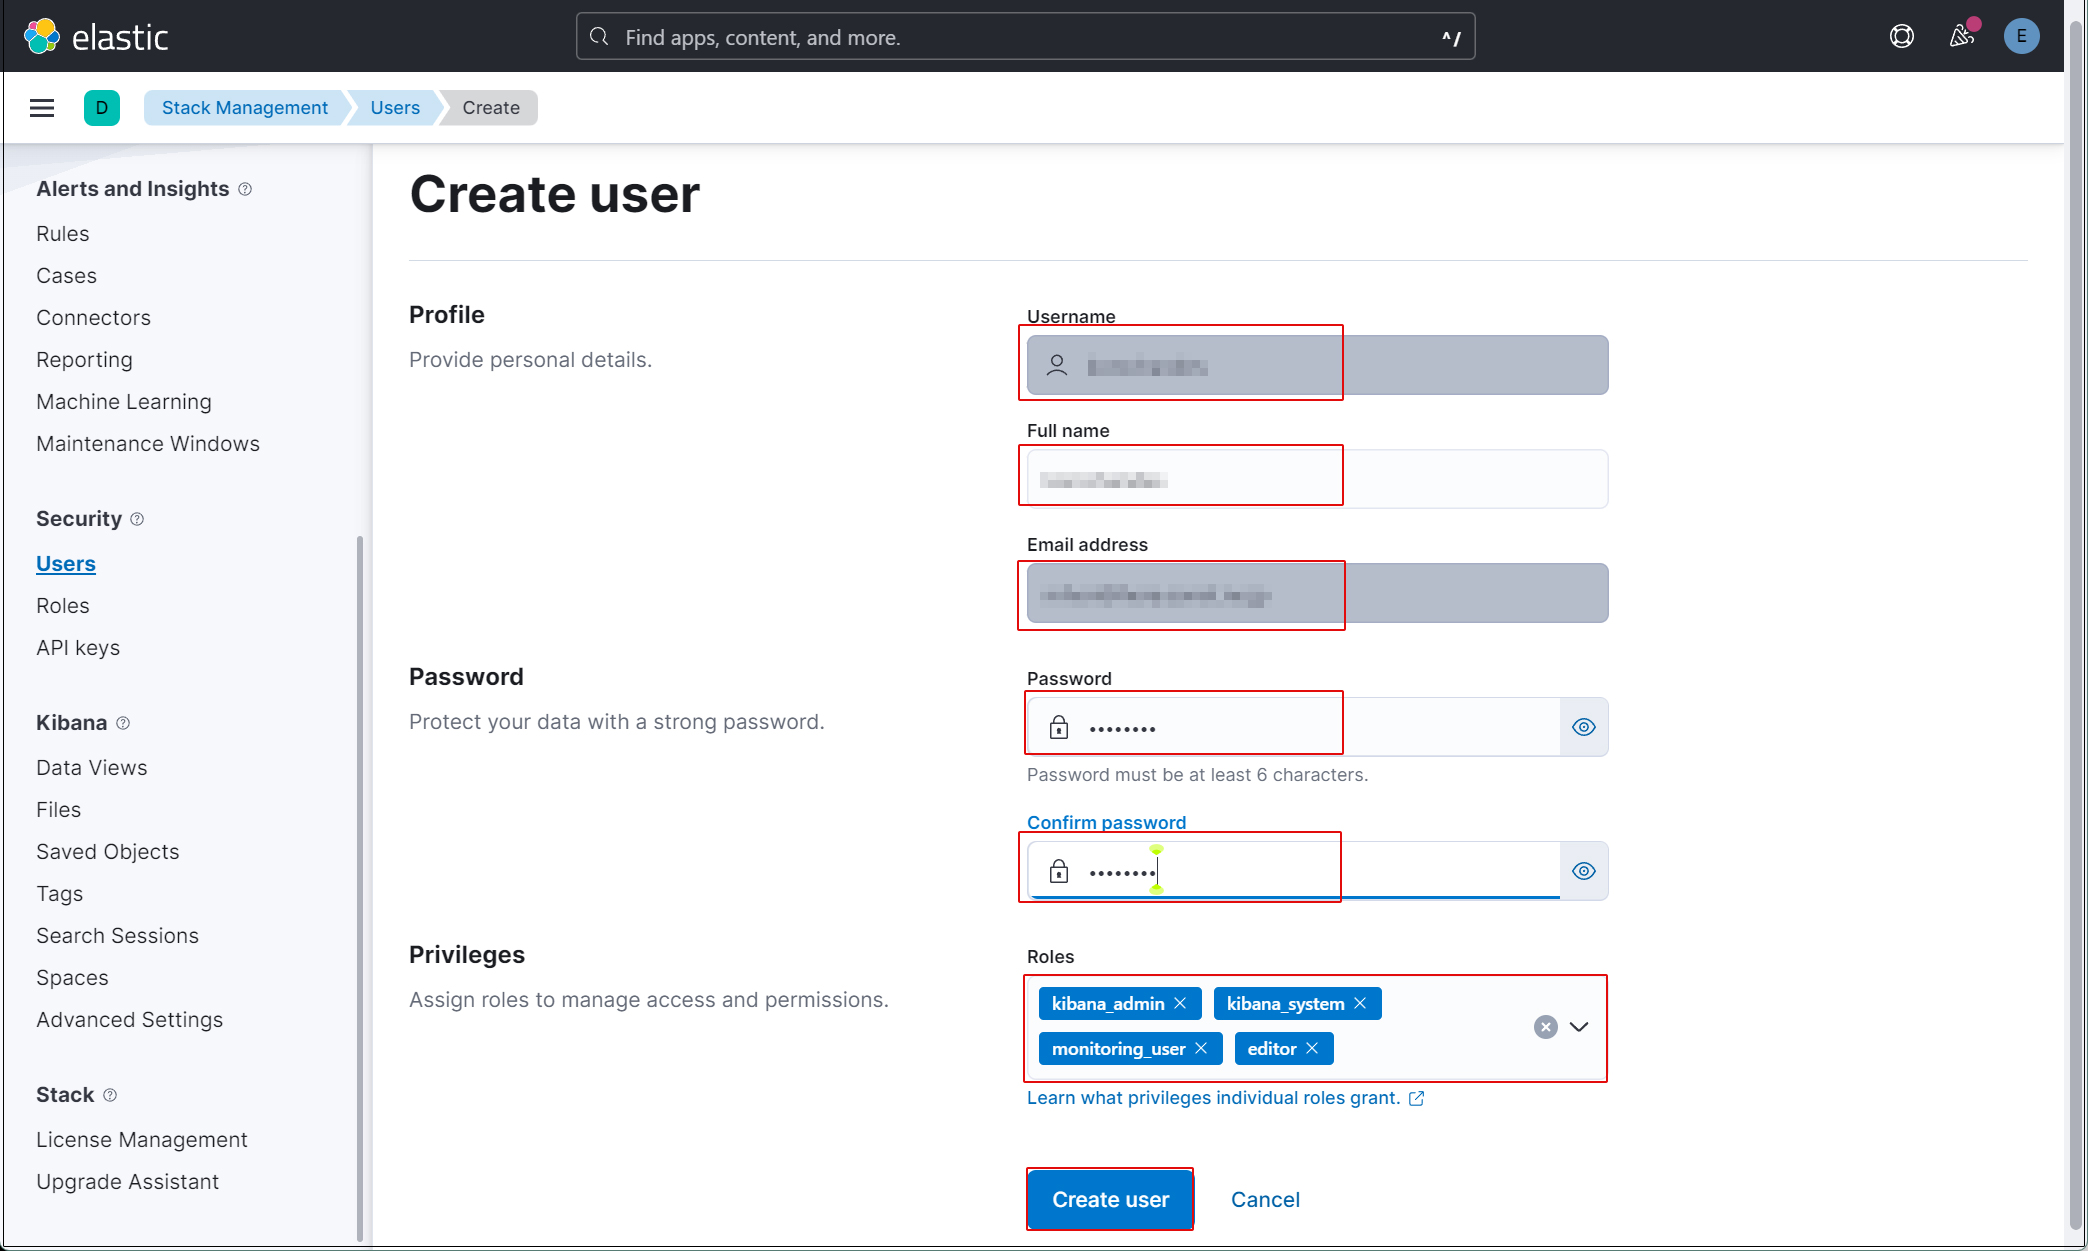
Enter new user information and assign the kibana_admin, kibana_system, monitoring_user, and editor roles under Privileges.
Finally, click [Create user].
Log out of the current profile and verify that you can log in with the newly created user account.
Currently, there is no data available to display in Kibana because Filebeat and Auditbeat are not configured on the SURICATA host.
Install Filebeat on the SURICATA server
This task will be performed on the first openSUSE16.1 Server(IP:192.168.11.83) where Suricata has been installed.
1. Filebeat Install
1.1 Create a repository definition in the /etc/zypp/repos.d/ directory
#  vi /etc/zypp/repos.d/elasticsearch.repo

The following content is recorded
[elasticsearch-9.x]
name=Elasticsearch repository for 9.x packages
baseurl=https://artifacts.elastic.co/packages/9.x/yum
gpgcheck=1
gpgkey=https://artifacts.elastic.co/GPG-KEY-elasticsearch
enabled=1
autorefresh=1
type=rpm-md
1.2 Install Filebeat
# zypper refresh
# zypper -n install  filebeat
1.3 Creating an Elasticsearch CA Certificate
Download the Elasticsearch CA certificate and save it to any directory (in this case, save it as /etc/filebeat/elastic-ca.crt).
(Assuming OpenSSL is already installed)
※Open port 9200 on Server 2 (the server running Elasticsearch)
# openssl s_client -connect 192.168.11.85:9200 \
-showcerts </dev/null 2>/dev/null | \
openssl x509 -outform PEM > /etc/filebeat/elastic-ca.crt
1.4 Configure Filebeat to connect to Elasticsearch and Kibana
# vi /etc/filebeat/filebeat.yml

Line 137 : Add a line specifying the private IP address and port of the Kibana instance
#host: "localhost:5601"
host: "192.168.11.85:5601"

Line 164 : comment out
#hosts: ["localhost:9200"]

Line 165 : Enter the Elastic Stack IP address and Elasticsearch port number.
hosts: ["https://192.168.11.85:9200"]

Line 171 : Uncomments
protocol: "https"

Line 172 : Elasticsearch CA Certificate Specification
ssl.certificate_authorities: ["/etc/filebeat/elastic-ca.crt"]

Line 175,176 : Uncomment the line, leave [username] as the default, and enter the password for the [elastic] user in [password].
username: "elastic"
password: “xxxxxxxxx"
1.5 Configuration File Test
# filebeat test config
Config OK
1.6 Enable the built-in Suricata module in Filebeats
# filebeat modules enable suricata
The above command will change /etc/filebeat/modules.d/suricata.yml.disabled to /etc/filebeat/modules.d/suricata.yml, but the contents remain unchanged. Therefore, edit it as follows:
# vi /etc/filebeat/modules.d/suricata.yml

Line 6-7 : Changes as follows
  eve:
    enabled: true
    var.paths: ["/var/log/suricata/eve.json"]
1.7 Set up the initial environment
Load the pipeline into the Suricata service
Load the SIEM dashboard into Elasticsearch
# filebeat setup -e

-----------------------------------------------------------------------------------------------------------------------------------------
{"log.level":"info","@timestamp":"2026-11-17T16:00:27.416+0900","log.logger":"modules","log.origin":{"function":"github.com/elastic/beats/v7/filebeat/fileset.LoadPipeline","file.name":"fileset/pipelines.go","file.line":134},"message":"Elasticsearch pipeline loaded.","service.name":"filebeat","pipeline":"filebeat-9.5.6-suricata-eve-pipeline","ecs.version":"1.6.0"}
{"log.level":"info","@timestamp":"2026-11-17T16:00:27.488+0900","log.logger":"modules","log.origin":{"function":"github.com/elastic/beats/v7/filebeat/fileset.LoadPipeline","file.name":"fileset/pipelines.go","file.line":134},"message":"Elasticsearch pipeline loaded.","service.name":"filebeat","pipeline":"filebeat-9.5.6-suricata-eve-dns","ecs.version":"1.6.0"}
{"log.level":"info","@timestamp":"2026-11-17T16:00:27.572+0900","log.logger":"modules","log.origin":{"function":"github.com/elastic/beats/v7/filebeat/fileset.LoadPipeline","file.name":"fileset/pipelines.go","file.line":134},"message":"Elasticsearch pipeline loaded.","service.name":"filebeat","pipeline":"filebeat-9.5.6-suricata-eve-dns-answer-v1","ecs.version":"1.6.0"}
{"log.level":"info","@timestamp":"2026-11-17T16:00:27.635+0900","log.logger":"modules","log.origin":{"function":"github.com/elastic/beats/v7/filebeat/fileset.LoadPipeline","file.name":"fileset/pipelines.go","file.line":134},"message":"Elasticsearch pipeline loaded.","service.name":"filebeat","pipeline":"filebeat-9.5.6-suricata-eve-dns-answer-v2","ecs.version":"1.6.0"}
{"log.level":"info","@timestamp":"2026-11-17T16:00:27.709+0900","log.logger":"modules","log.origin":{"function":"github.com/elastic/beats/v7/filebeat/fileset.LoadPipeline","file.name":"fileset/pipelines.go","file.line":134},"message":"Elasticsearch pipeline loaded.","service.name":"filebeat","pipeline":"filebeat-9.5.6-suricata-eve-tls","ecs.version":"1.6.0"}
{"log.level":"info","@timestamp":"2026-11-17T16:00:27.781+0900","log.logger":"modules","log.origin":{"function":"github.com/elastic/beats/v7/filebeat/fileset.LoadPipeline","file.name":"fileset/pipelines.go","file.line":134},"message":"Elasticsearch pipeline loaded.","service.name":"filebeat","pipeline":"filebeat-9.5.6-suricata-eve-http","ecs.version":"1.6.0"}
-----------------------------------------------------------------------------------------------------------------------------------------
Loaded Ingest pipelines
1.8 Start the Filebeat service
# systemctl start filebeat.service
2. Check in Kibana
Log back into Kibana using the user you created. Accsses http://192.168.11.85:5601
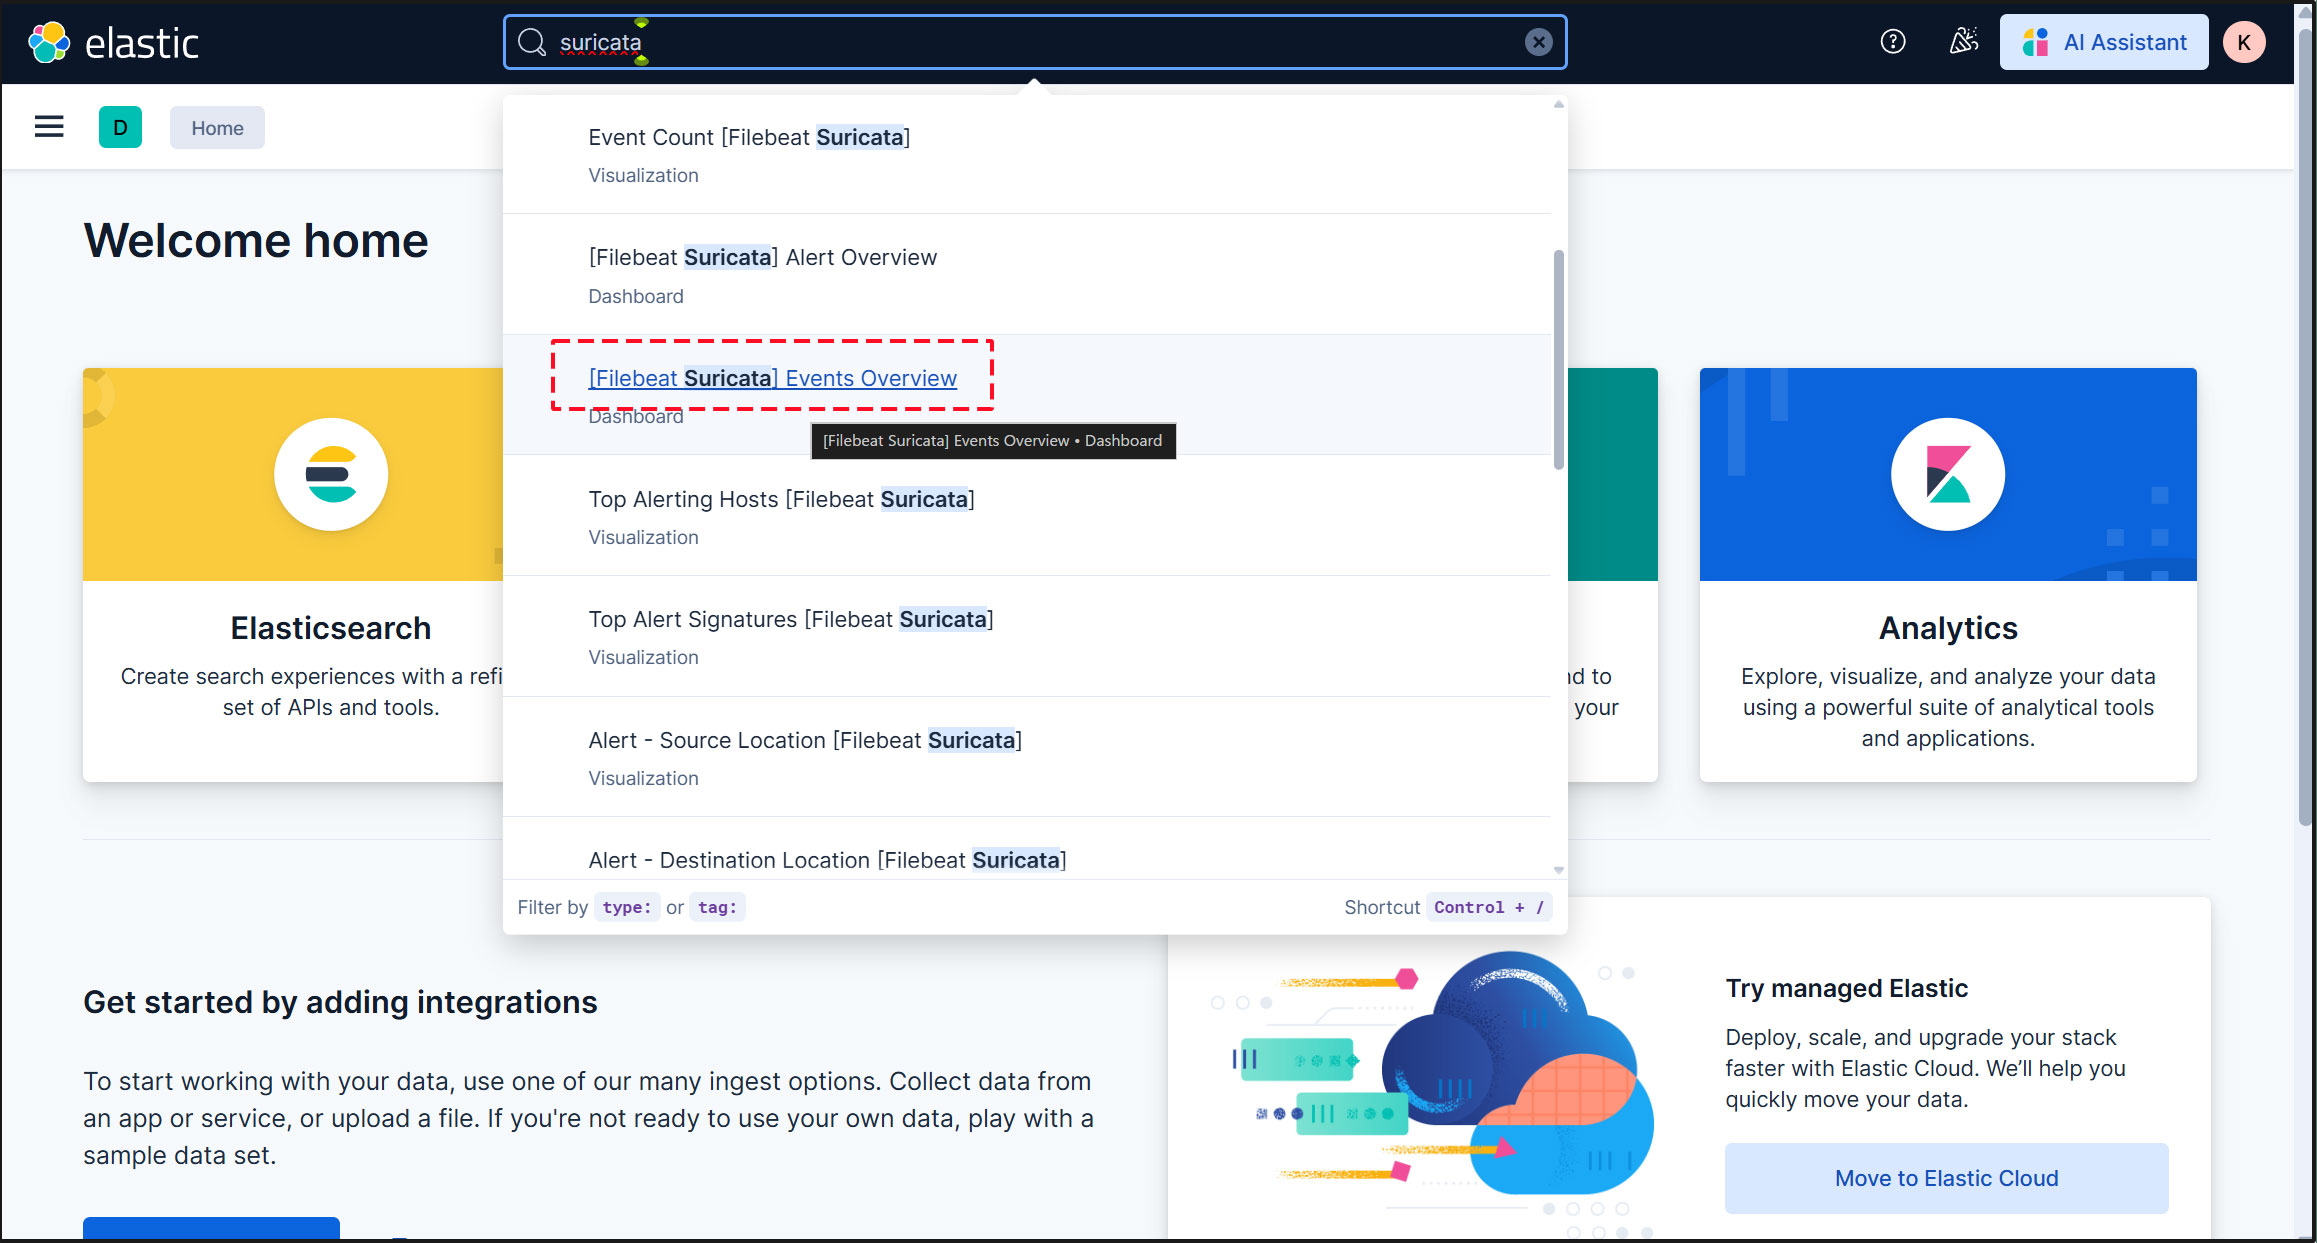
Type "Suricata Events Overview" into the top search field, then click [Filebeat Suricata] Events Overview
All Suricata events from the past 15 minutes are displayed.
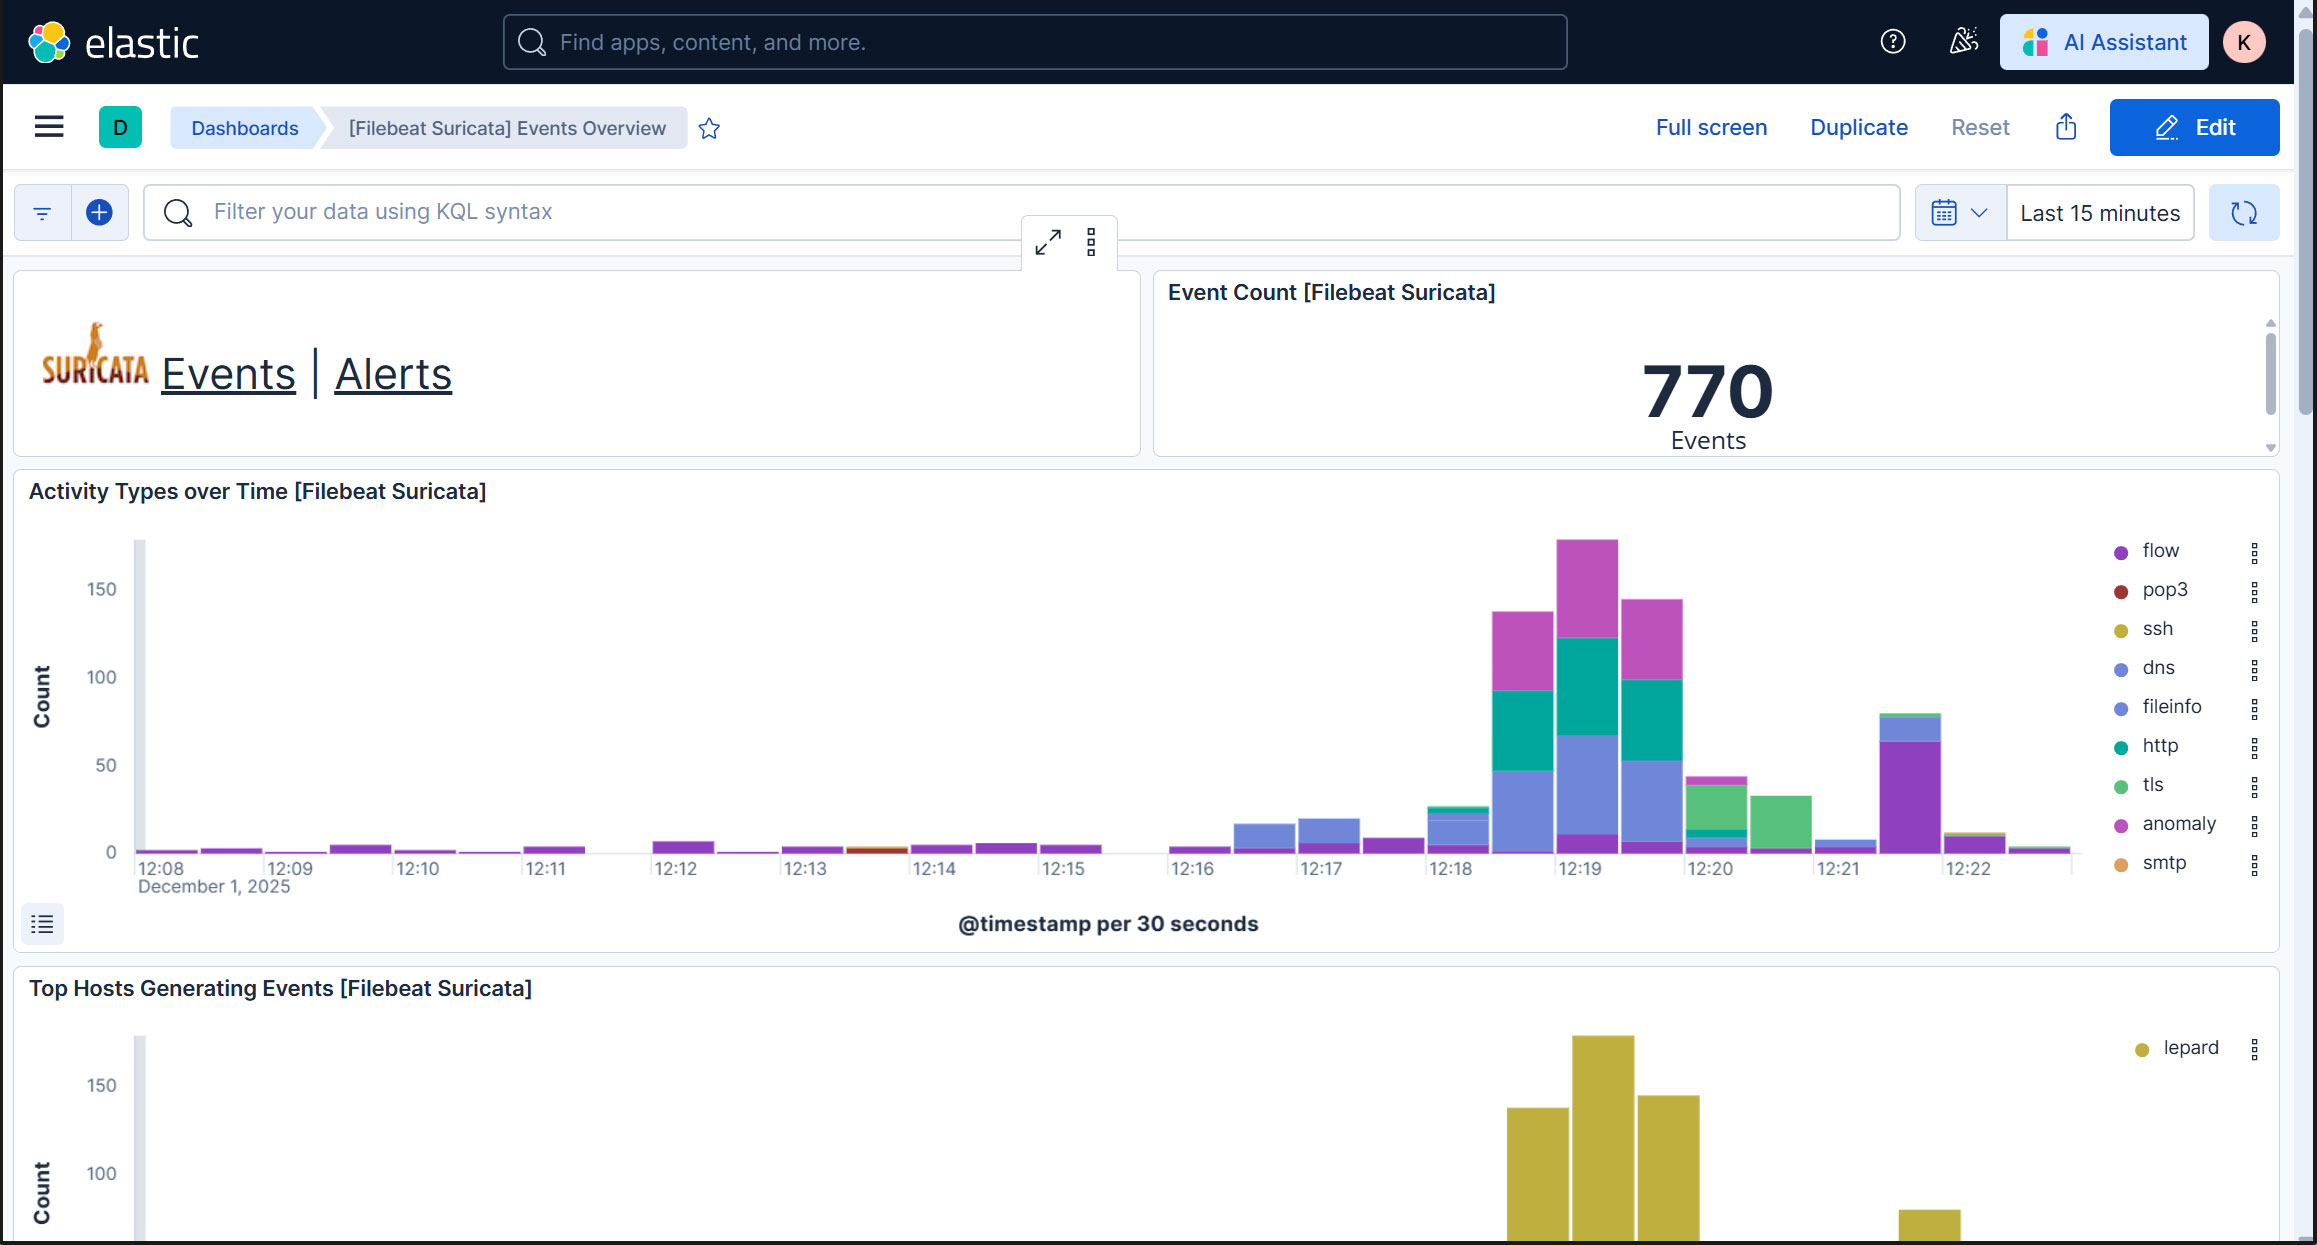
To display alerts for malicious traffic, click the "Alerts" text next to the Suricata logo.
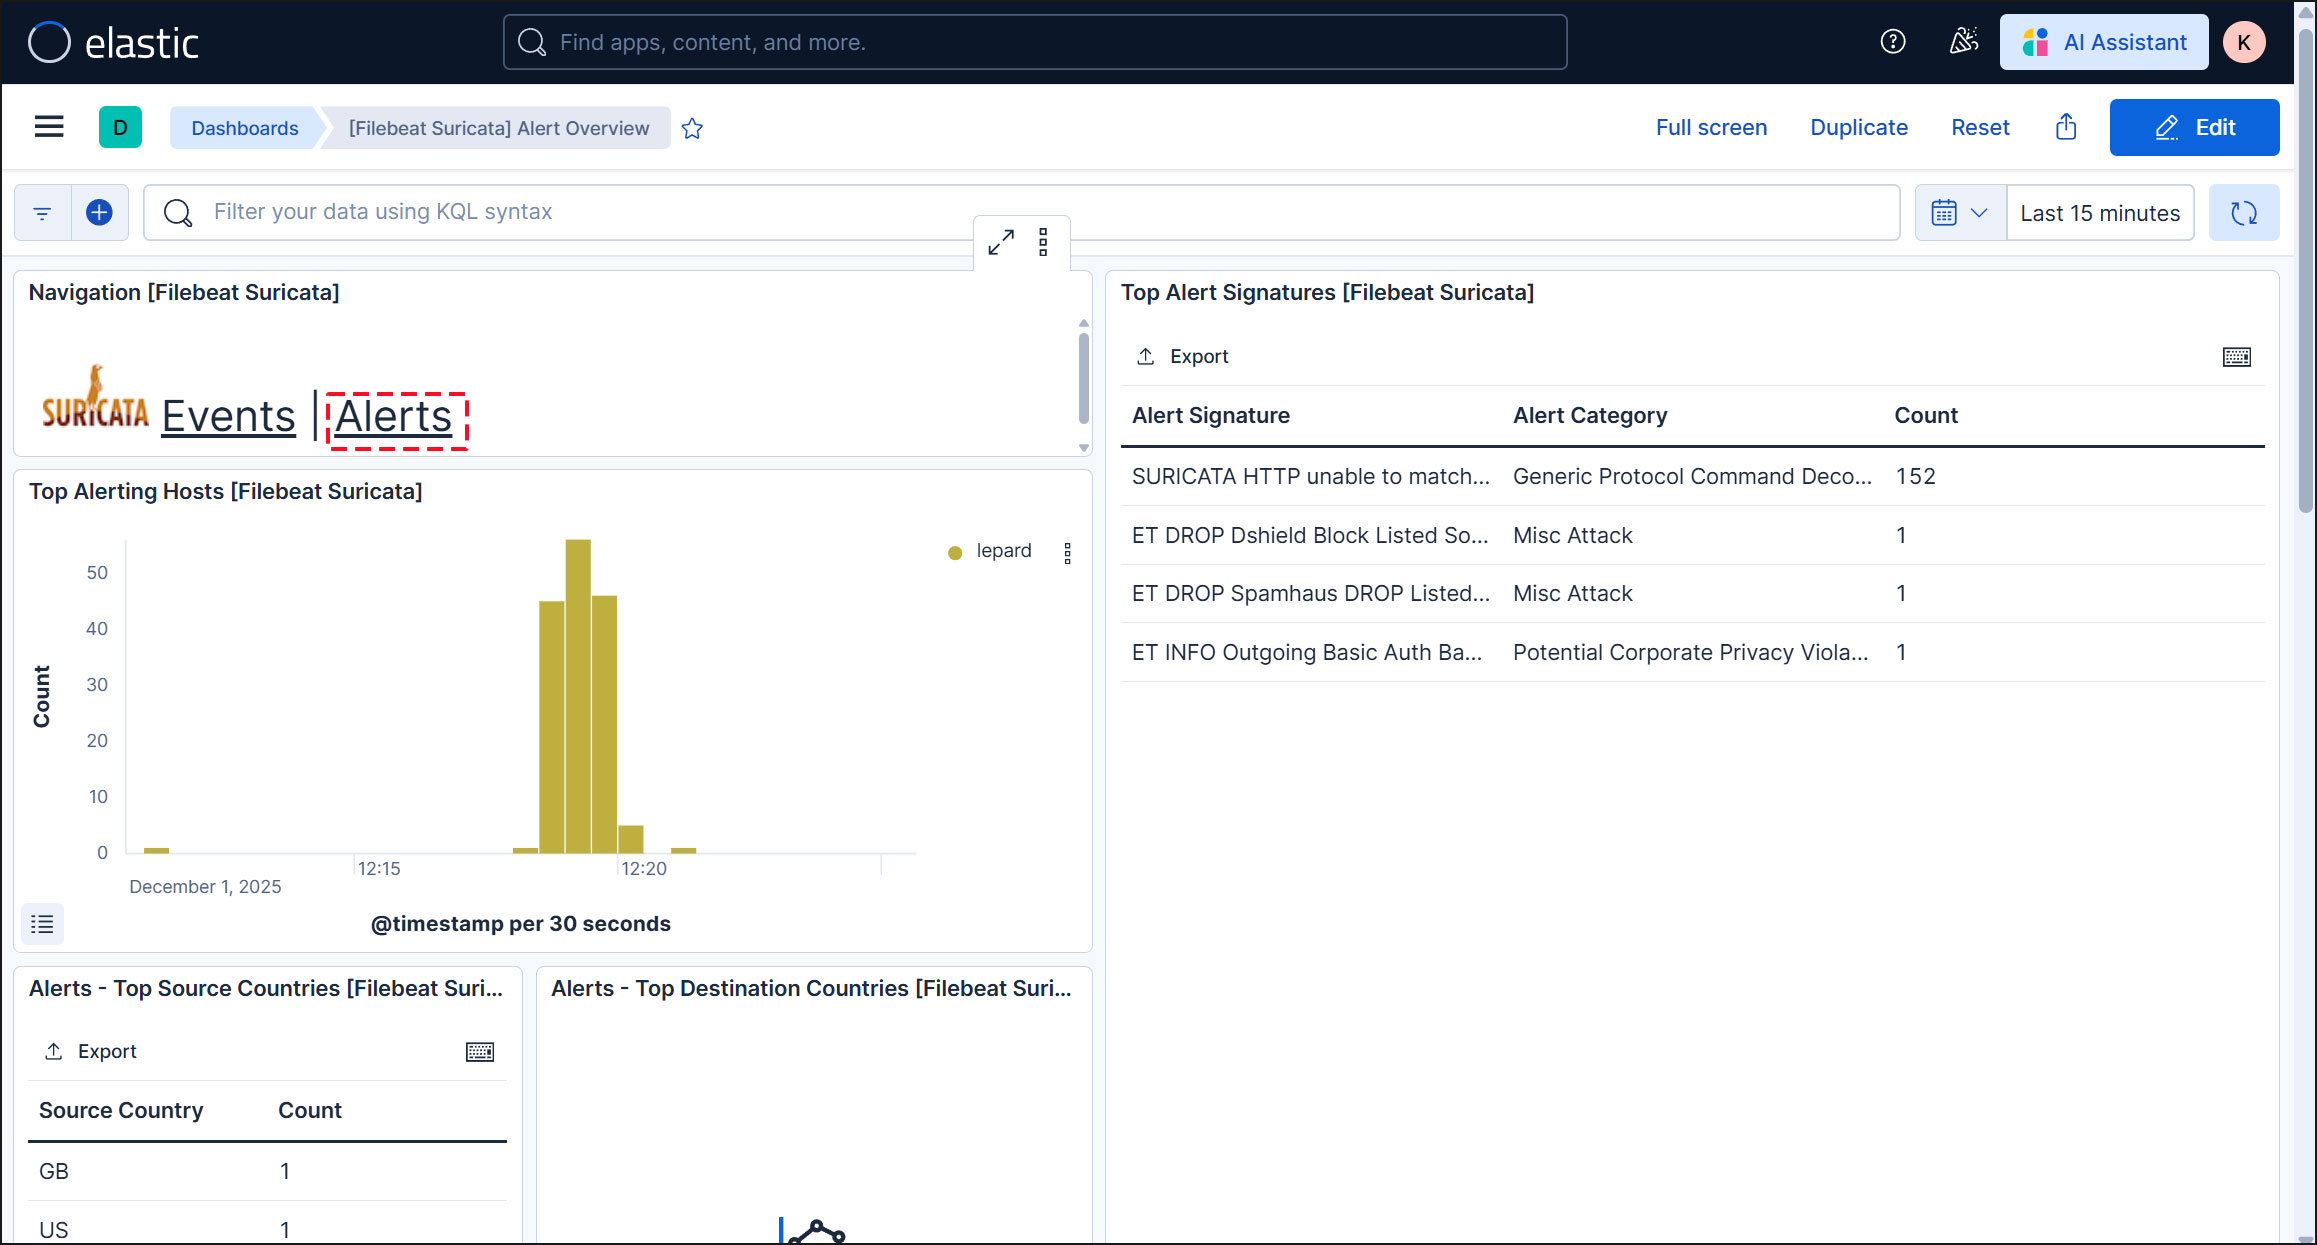
Kibana offers a variety of features and tools for visualizing logs, so feel free to experiment with them.