"Nagios Server," an open-source integrated monitoring software
Nagios is an open source monitoring solution running on Linux.
Nagios is designed to periodically check critical network, application, or server parameters.
These parameters include microprocessor load, number of running processes, log files, disk and memory usage, as well as many other services such as SMTP (Simple Mail Transfer Protocol), HTTP (Hypertext Transfer Protocol), POP3 (Post Office Protocol 3), etc. can be checked.
These parameters require a microprocessor load, a database such as PHP or MySQL to run Nagois, and a web server such as Apache or Nginx. We will proceed under the assumption that all of these have already been configured。
1. Install necessary packages
# apt -y install autoconf gcc libc6 make wget unzip libgd-dev libssl-dev
2. Installing Nagios Core
①Download and Extract and Install
# wget https://go.nagios.org/get-core/4-5-12
# tar zxvf 4-5-12
# cd nagios-4.5.12
# ./configure
# make all
➁Create Nagios Users and Groups
# make install-groups-users
groupadd -r nagios
useradd -g nagios nagios
➂Add Apache User to Nagios Group
# usermod -aG nagios www-data
④Install Nagios Core
# make install
⑤Install Nagios init script
# make install-init
/usr/bin/install -c -m 755 -d -o root -g root /lib/systemd/system
/usr/bin/install -c -m 755 -o root -g root startup/default-service /lib/systemd/system/nagios.service
⑥Install external command files and permissions
# make install-commandmode

/usr/bin/install -c -m 775 -o nagios -g nagios -d /usr/local/nagios/var/rw
chmod g+s /usr/local/nagios/var/rw

*** External command directory configured ***
⑦Install Nagios Configuration Files
# make install-config

*** Config files installed ***

Remember, these are *SAMPLE* config files.  You'll need to read
the documentation for more information on how to actually define
services, hosts, etc. to fit your particular needs.
⑧Install Apache configuration files for Nagios
# make install-webconf

/usr/bin/install -c -m 644 sample-config/httpd.conf /etc/apache2/sites-available/nagios.conf
if [ 1 -eq 1 ]; then \
        ln -s /etc/apache2/sites-available/nagios.conf /etc/apache2/sites-enabled/nagios.conf; \
fi

*** Nagios/Apache conf file installed ***
# a2enmod cgi
# systemctl restart apache2
3. Install Nagios Plugin
①Download the latest code from the Nagios Plugins page
# wget https://nagios-plugins.org/download/nagios-plugins-2.5.tar.gz
②Install
# tar -xvf nagios-plugins-2.5.tar.gz
# cd nagios-plugins-2.5
# ./configure --with-nagios-user=nagios --with-nagios-group=nagios
# make
# make install
The following nagios-plugins are available:
# ls /usr/local/nagios/libexec

check_apt       check_file_age      check_load      check_ntp_time  check_smtp          check_users
check_breeze    check_flexlm        check_log       check_nwstat    check_spop          check_wave
check_by_ssh    check_ftp           check_mailq     check_oracle    check_ssh           negate
check_clamd     check_http          check_mrtg      check_overcr    check_ssl_validity  remove_perfdata
check_cluster   check_icmp          check_mrtgtraf  check_ping      check_ssmtp         urlize
check_dhcp      check_ide_smart     check_nagios    check_pop       check_swap          utils.pm
check_dig       check_ifoperstatus  check_nntp      check_procs     check_tcp           utils.sh
check_disk      check_ifstatus      check_nntps     check_real      check_time
check_disk_smb  check_imap          check_nt        check_rpc       check_udp
check_dns       check_ircd          check_ntp       check_sensors   check_ups
check_dummy     check_jabber        check_ntp_peer  check_simap     check_uptime
③Create necessary directories
# mkdir -p /usr/local/nagios/var/spool/checkresults
# chown -R nagios:nagios /usr/local/nagios/var/spool/checkresults
4. Creating a Nagios Web User
Create a user account to access the Nagios Web Dashboard. This user account is used for authentication.
The default name of the user is nagiosadmin, which is defined as the preferred user name in the /usr/local/nagios/etc/cgi.cfg file.
# htpasswd -c /usr/local/nagios/etc/htpasswd.users nagiosadmin
New password:  [password]
Re-type new password:  [again password]
Adding password for user nagiosadmin
Set ownership and permissions
# chown www-data:www-data /usr/local/nagios/etc/htpasswd.users
# chmod 640 /usr/local/nagios/etc/htpasswd.users
5. Starting Nagios
Restart Apache
# systemctl restart apache2
Allow HTTP service port in firewall
# ufw allow http
# ufw reload
Enable Nagios Services
# systemctl enable nagios --now
Reboot system
# shutdown -r now
Confirmation of service execution
# systemctl status nagios

● nagios.service - Nagios Core 4.5.12
     Loaded: loaded (/usr/lib/systemd/system/nagios.service; enabled; preset: enabled)
     Active: active (running) since Thu 2026-07-23 17:19:09 JST; 29s ago
 Invocation: b742ec8485754c87a673f3ae243fd10f
       Docs: https://www.nagios.org/documentation
   Main PID: 1188 (nagios)
      Tasks: 6 (limit: 4553)
     Memory: 6.3M (peak: 6.5M)
        CPU: 61ms
     CGroup: /system.slice/nagios.service
             ├─1188 /usr/local/nagios/bin/nagios -d /usr/local/nagios/etc/nagios.cfg
             ├─1230 /usr/local/nagios/bin/nagios --worker /usr/local/nagios/var/rw/nagios.qh
             ├─1231 /usr/local/nagios/bin/nagios --worker /usr/local/nagios/var/rw/nagios.qh
             ├─1232 /usr/local/nagios/bin/nagios --worker /usr/local/nagios/var/rw/nagios.qh
             ├─1233 /usr/local/nagios/bin/nagios --worker /usr/local/nagios/var/rw/nagios.qh
             └─1250 /usr/local/nagios/bin/nagios -d /usr/local/nagios/etc/nagios.cfg

Jul 23 17:19:09 Lepard nagios[1188]: qh: Socket '/usr/local/nagios/var/rw/nagios.qh' successfully initialized
Jul 23 17:19:09 Lepard nagios[1188]: qh: core query handler registered
Jul 23 17:19:09 Lepard nagios[1188]: qh: echo service query handler registered
Jul 23 17:19:09 Lepard nagios[1188]: qh: help for the query handler registered
Jul 23 17:19:09 Lepard nagios[1188]: wproc: Successfully registered manager as @wproc with query handler
Jul 23 17:19:09 Lepard nagios[1188]: wproc: Registry request: name=Core Worker 1233;pid=1233
Jul 23 17:19:09 Lepard nagios[1188]: wproc: Registry request: name=Core Worker 1230;pid=1230
Jul 23 17:19:09 Lepard nagios[1188]: wproc: Registry request: name=Core Worker 1231;pid=1231
Jul 23 17:19:09 Lepard nagios[1188]: wproc: Registry request: name=Core Worker 1232;pid=1232
Jul 23 17:19:09 Lepard nagios[1188]: Successfully launched command file worker with pid 1250
6. Access the Nagios Web Interface
Access http://[IP_Address]/nagios/ with any browser
Username : nagoisadmin
Password : Password specified when the user was created above
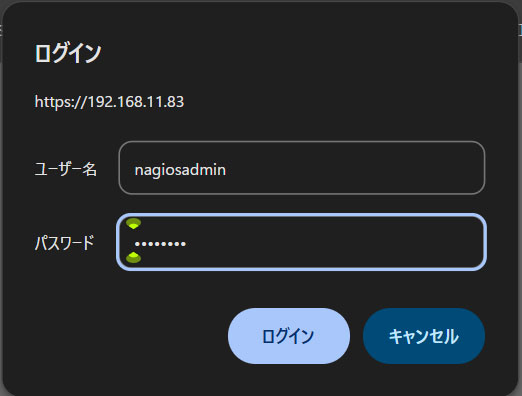
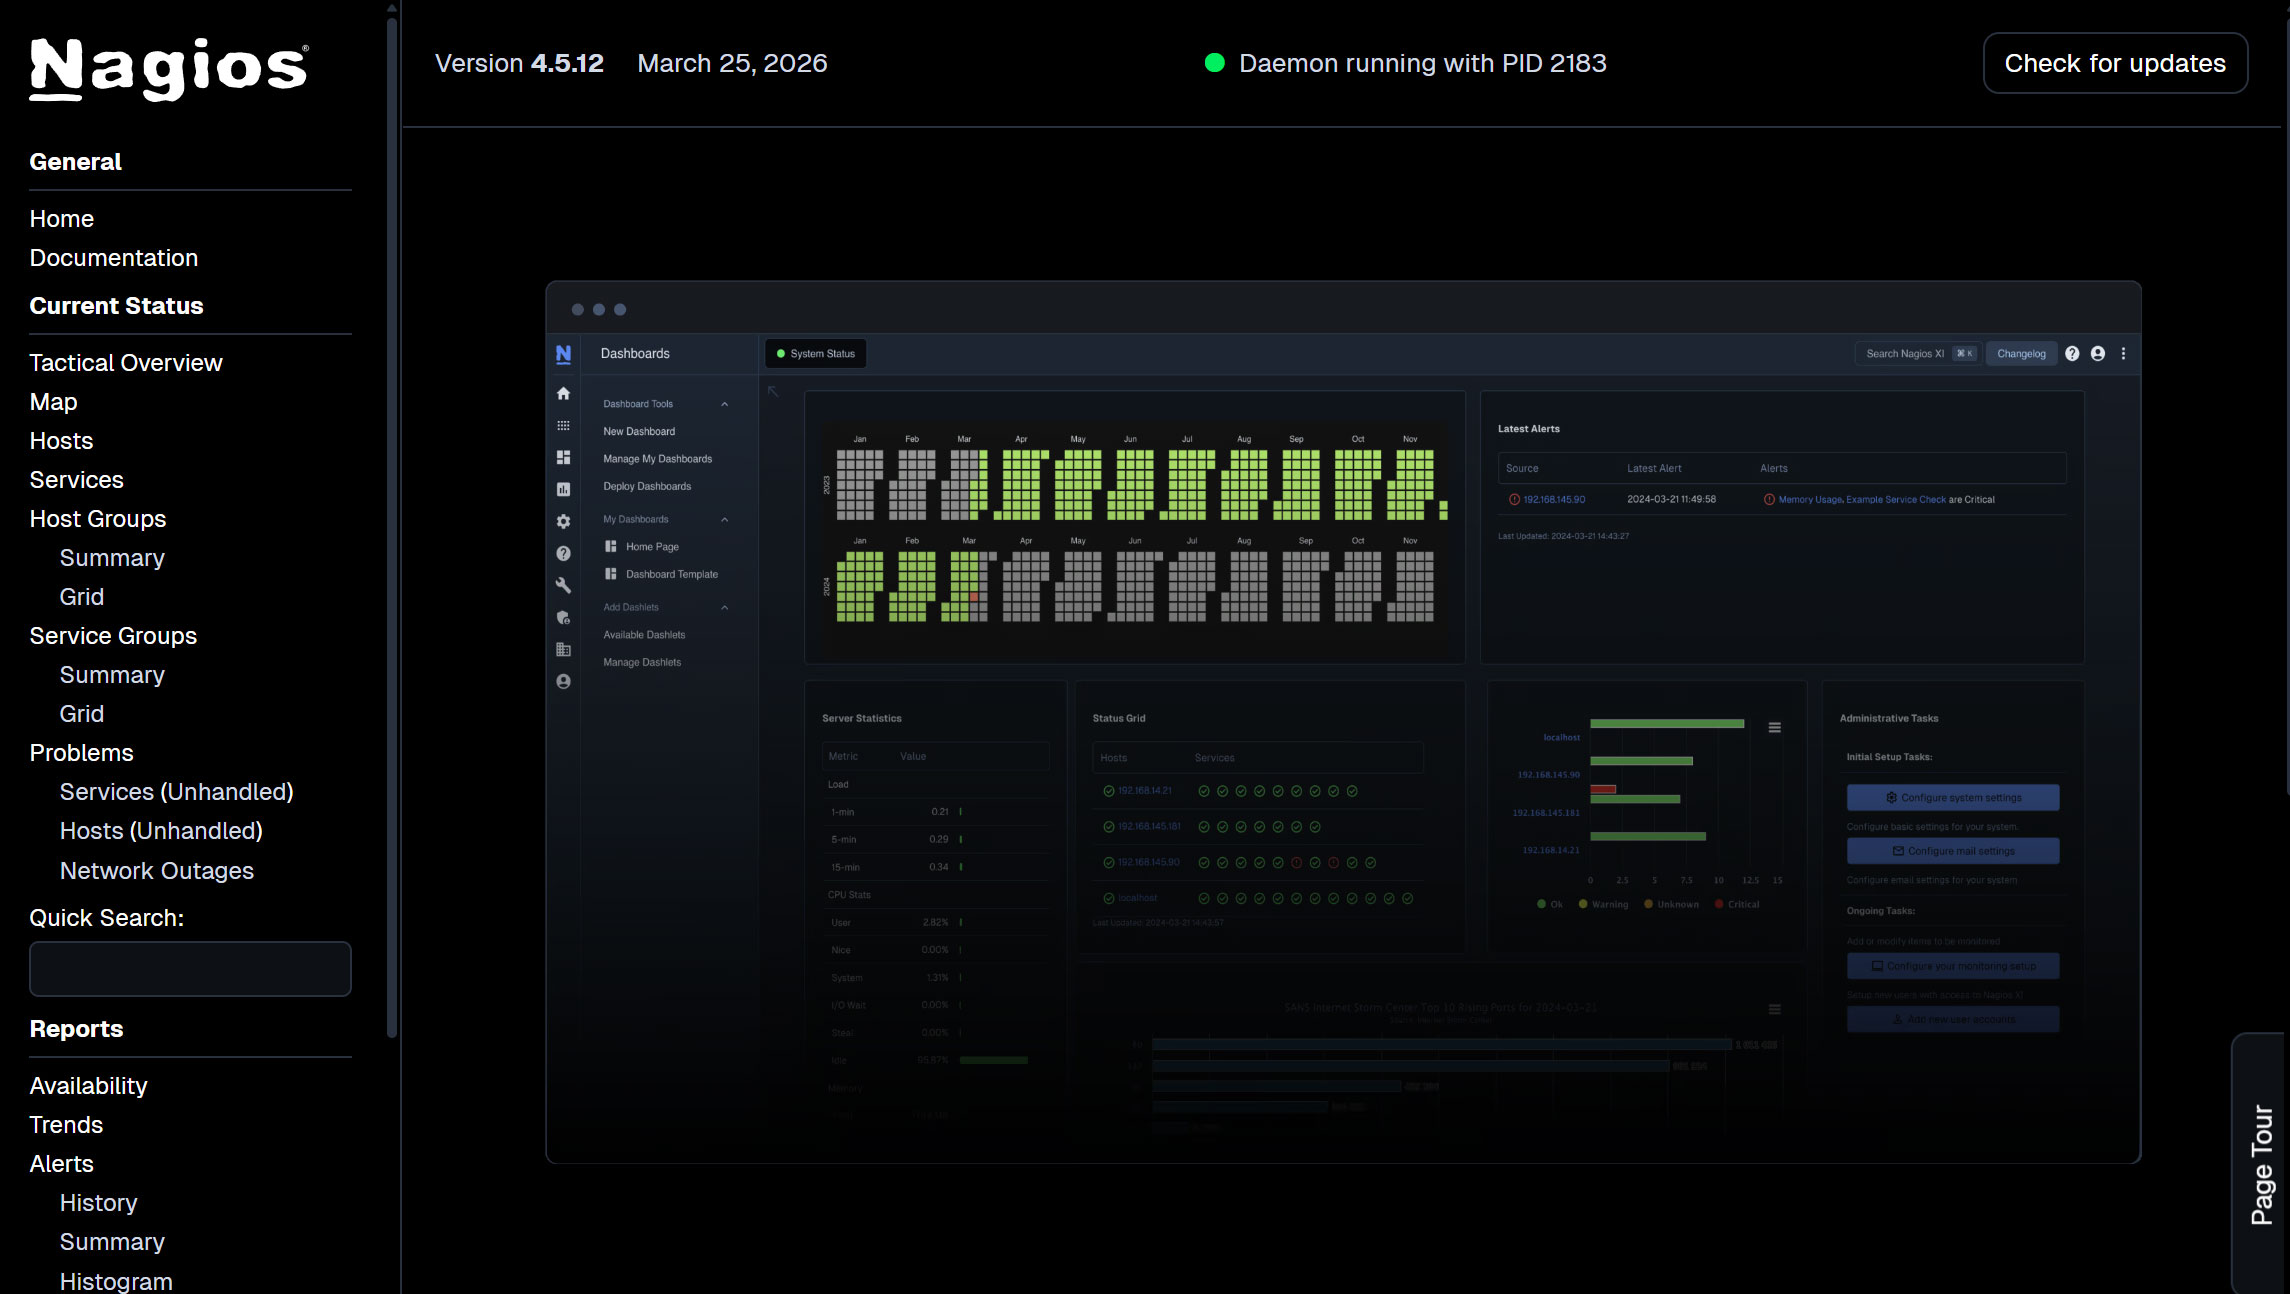
After successful login, the following dashboard will appear
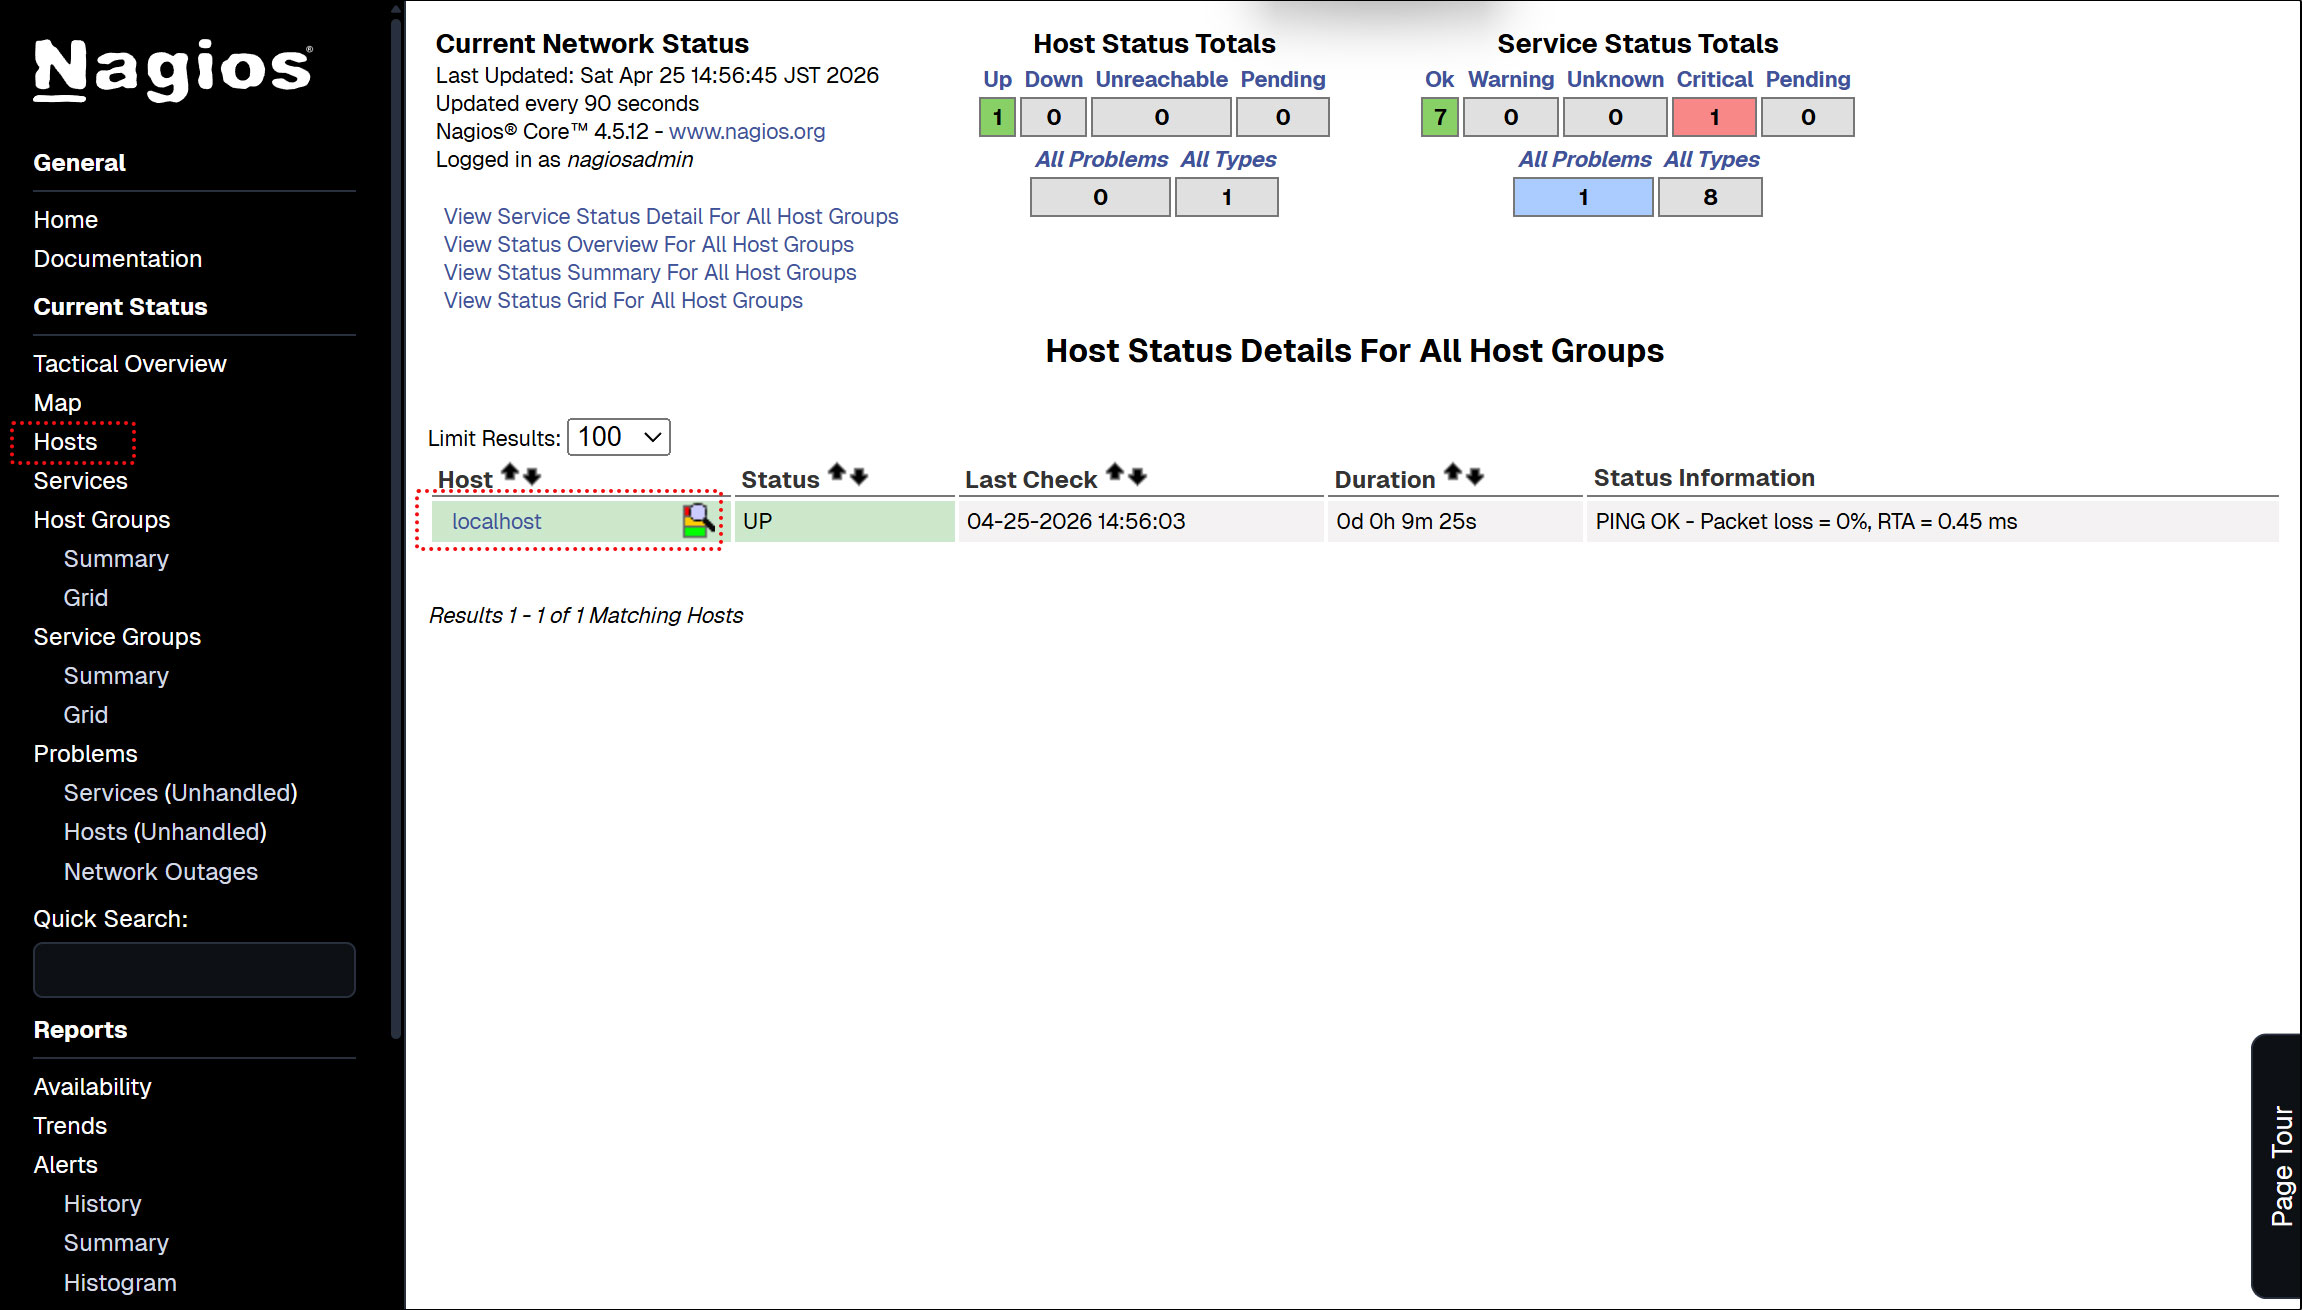
Show host availability
Click on [Hosts] in the left menu
Currently, only the Nagios Server is displayed.
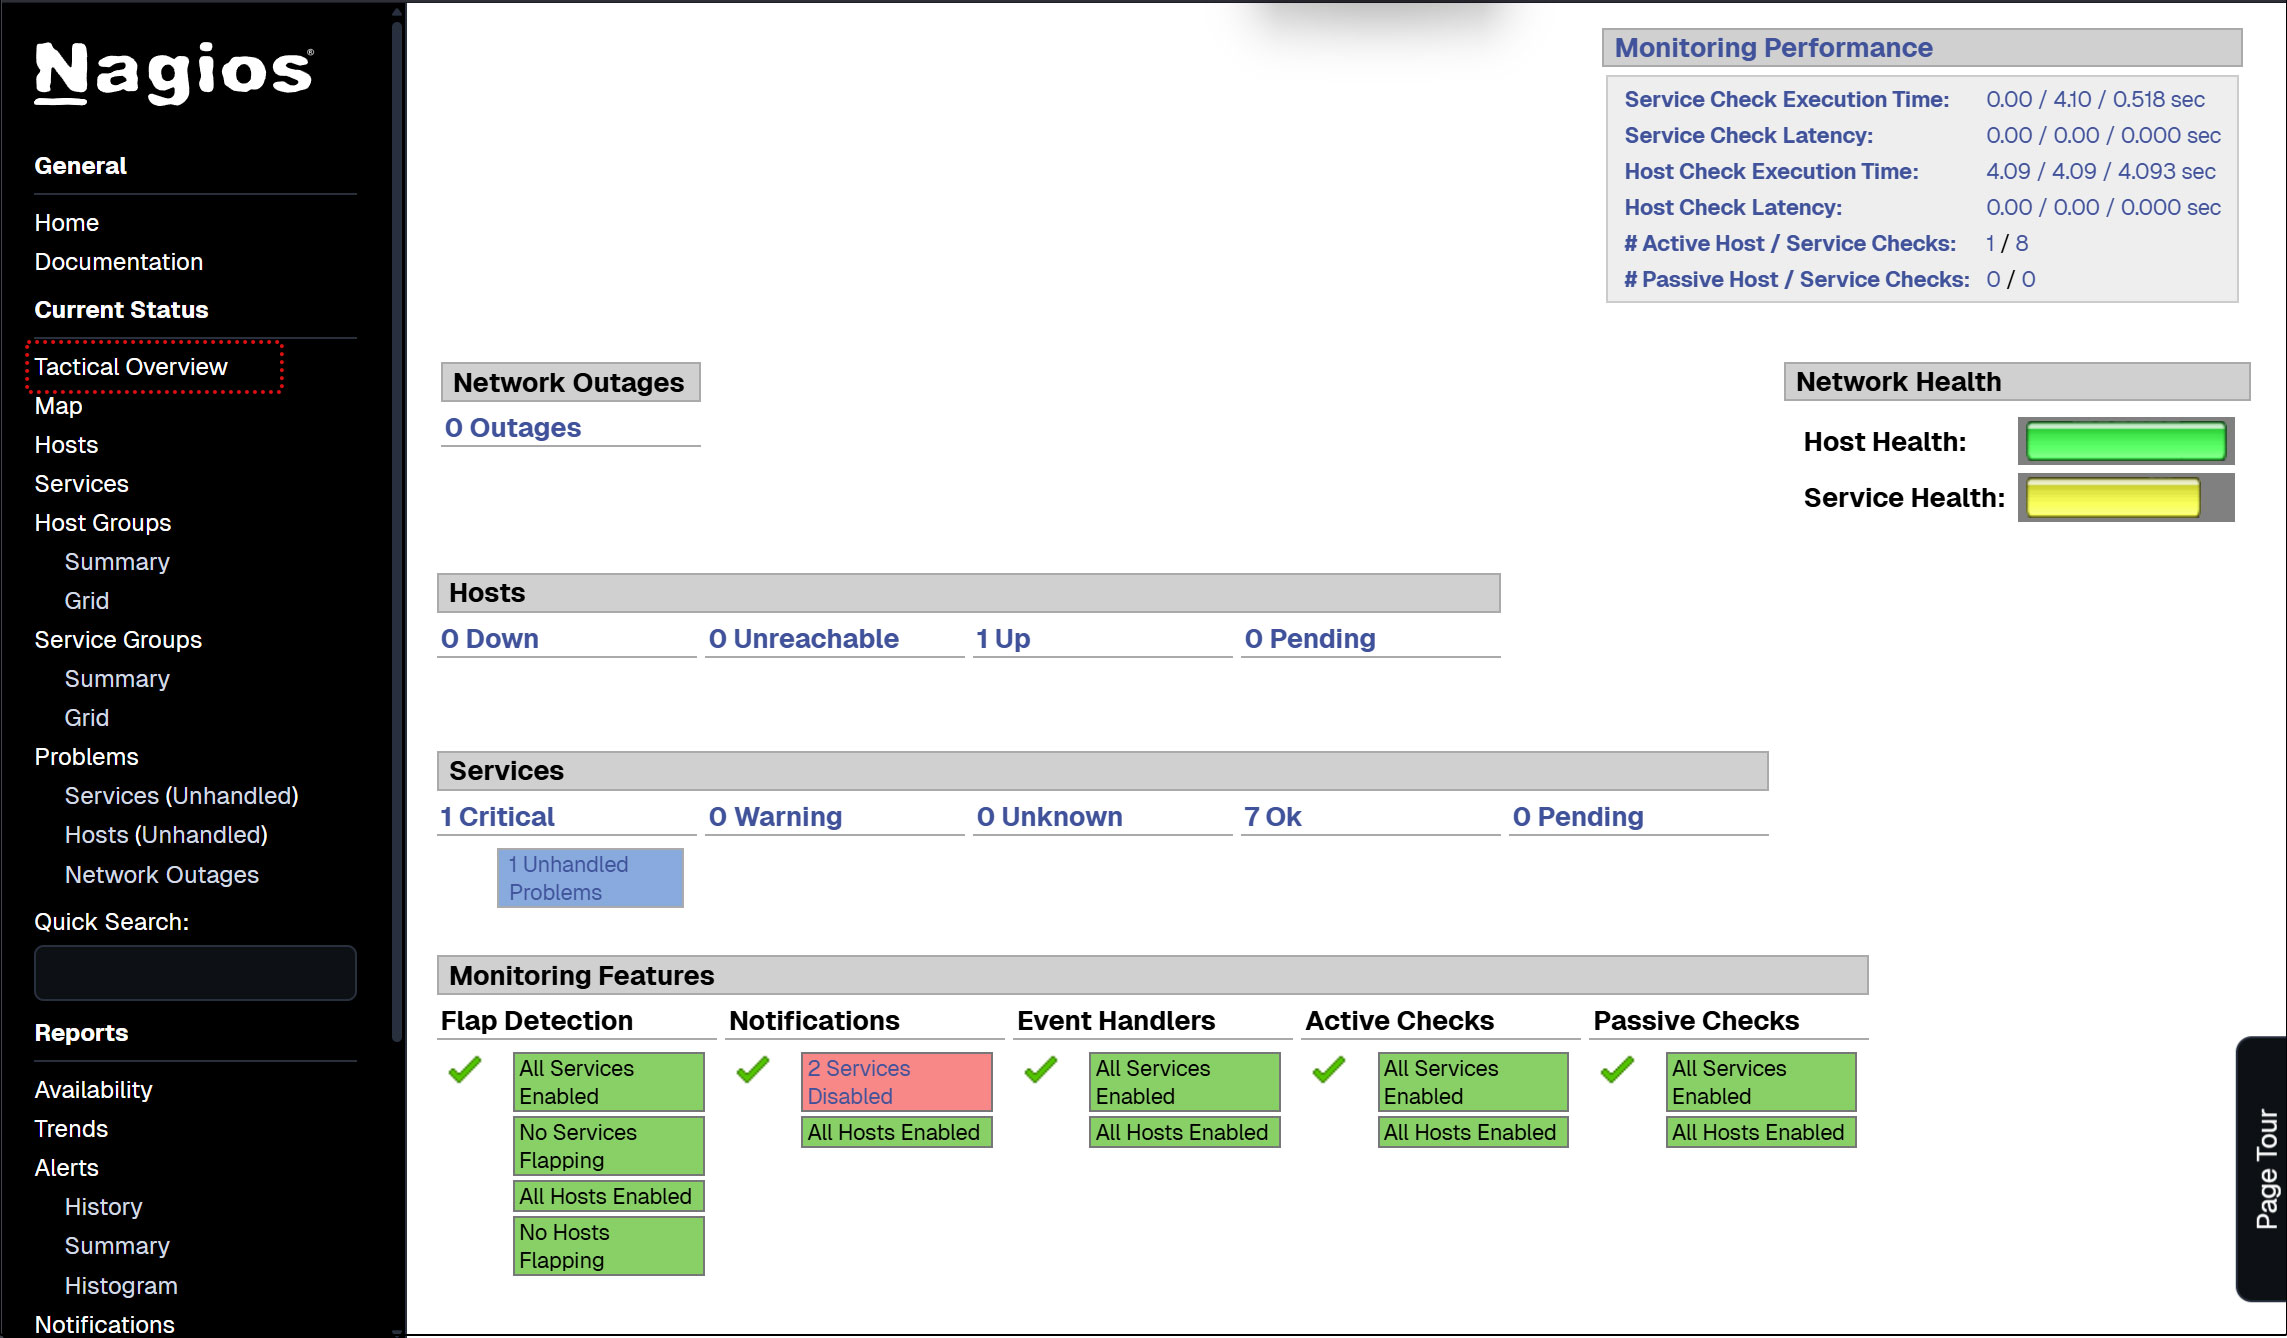
Click [Tactical Overview] on the left menu to view the monitoring data
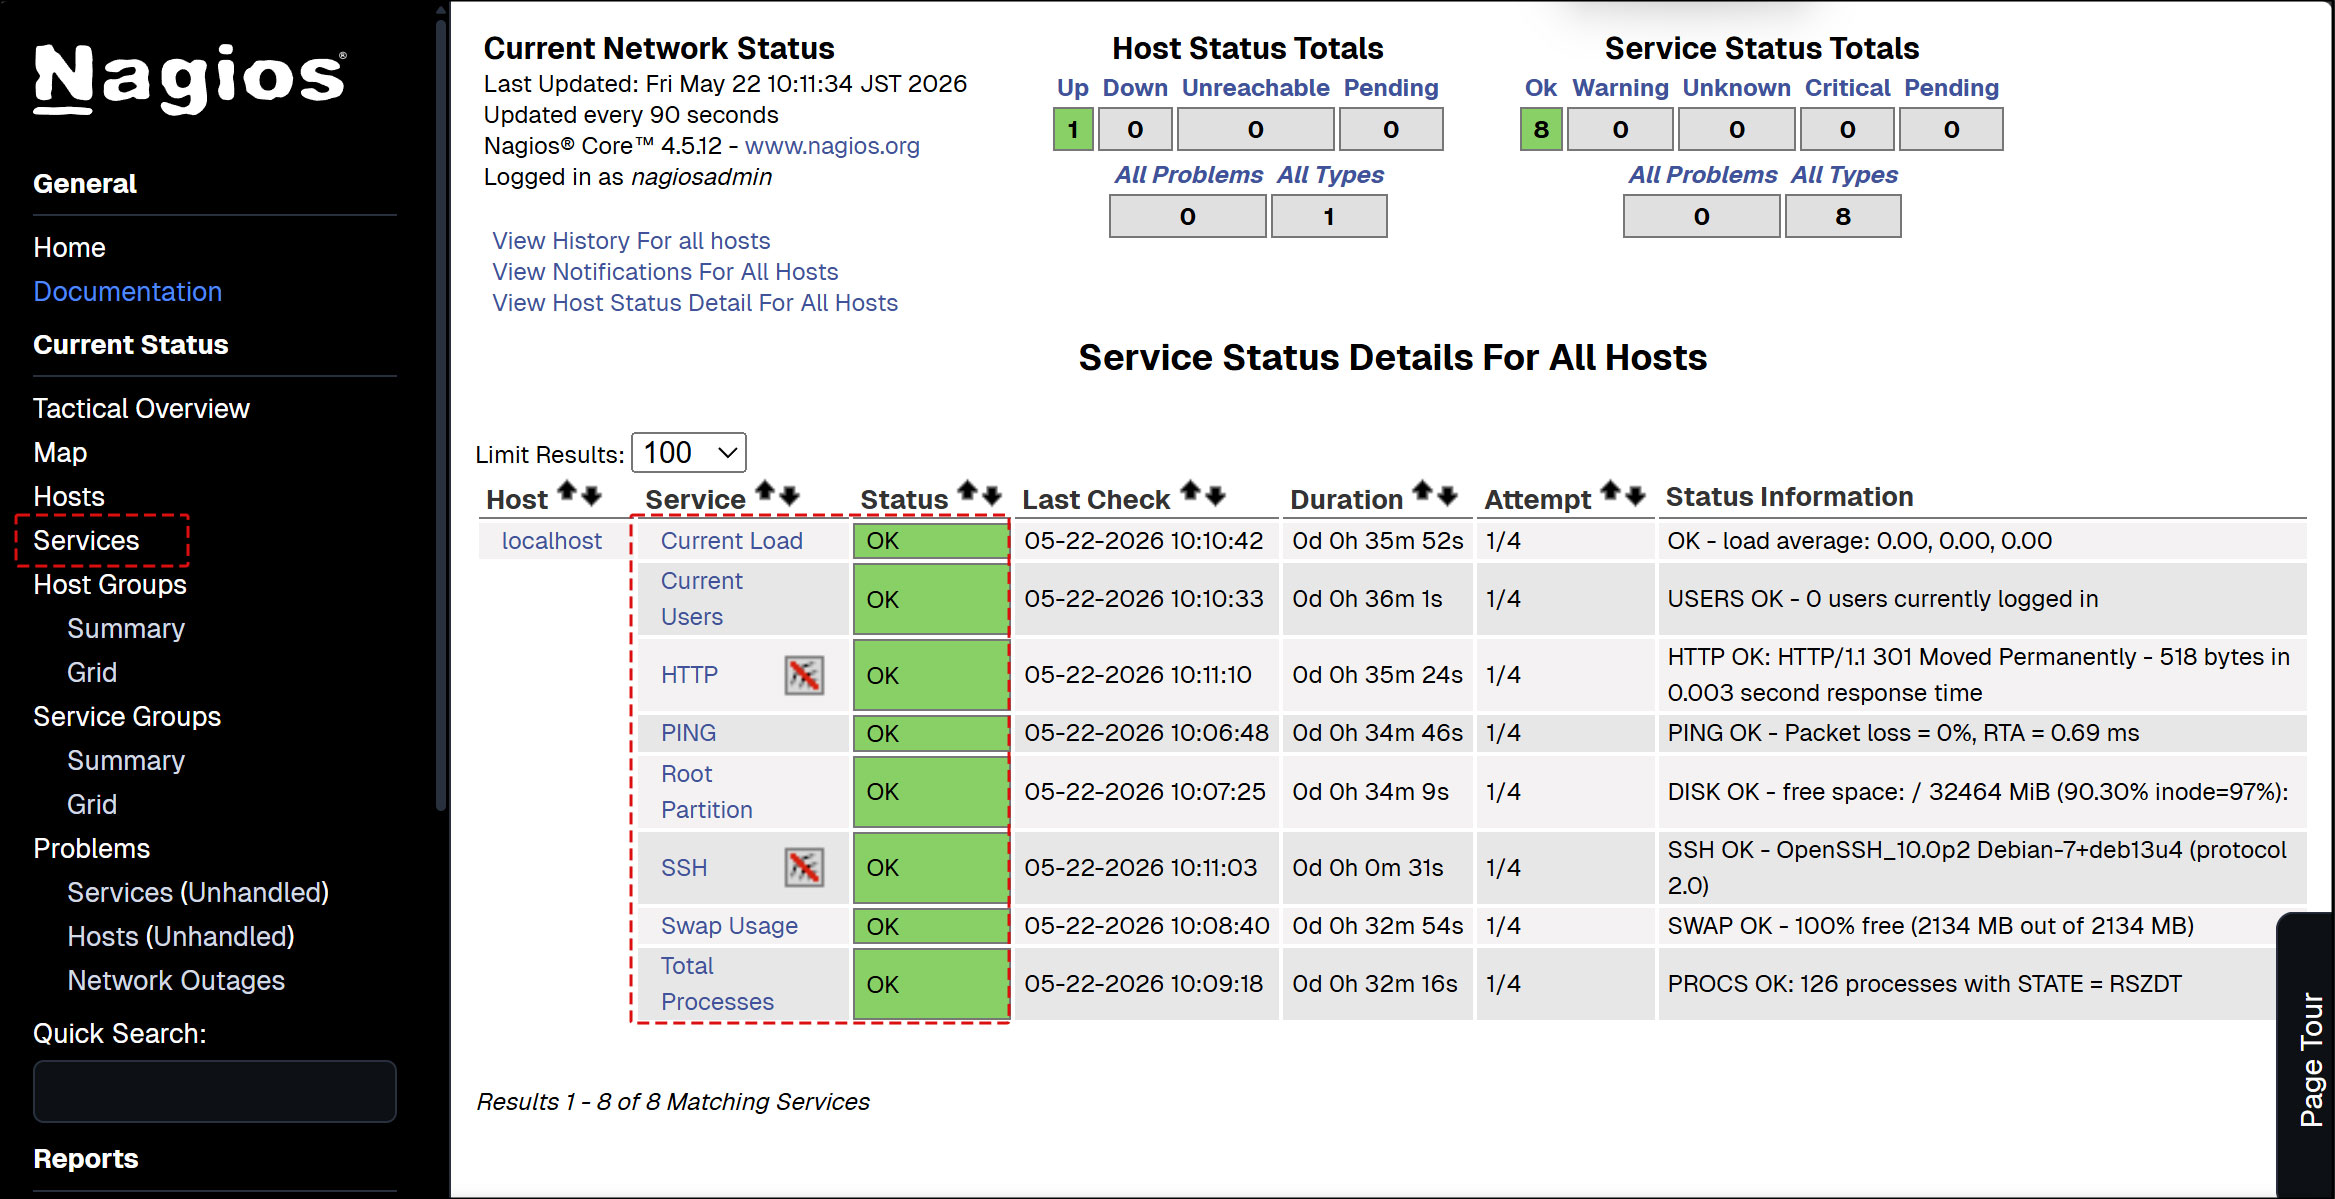
Click [Current Status] [Services] on the left menu : The current monitoring service details are displayed.
※ If you have assigned port 2244 via custom SSH settings, make the following changes to localhost.cfg:
# vi /usr/local/nagios/etc/objects/localhost.cfg
Around line 143
check_command           check_ssh
↓
check_command           check_ssh!-p 2244
7. Nagios Agent Configuration
To monitor the agent. Install the following
• NRPE Agent to run plugins
① Installing Nagios NRPE Agent
NRPE agent available in default Debian repository
# apt-cache policy nagios-nrpe-server
nagios-nrpe-server:
  Installed: (none)
  Candidate: 4.1.3-1
  Version table:
     4.1.3-1 500
        500 http://ftp.jp.debian.org/debian trixie/main amd64 Packages
# apt -y install nagios-nrpe-server
➁Version Check
# nrpe -V
NRPE - Nagios Remote Plugin Executor
Version: 4.1.3
➂Start and activate the service
# systemctl enable --now nagios-nrpe-server
④Check the NRPE agent status
# systemctl status nagios-nrpe-server

● nagios-nrpe-server.service - Nagios Remote Plugin Executor
     Loaded: loaded (/usr/lib/systemd/system/nagios-nrpe-server.service; enabled; preset: enabled)
     Active: active (running) since Thu 2026-07-23 17:32:34 JST; 4min 28s ago
 Invocation: abfbdfc606d44db19fccea53485ab8d4
       Docs: http://www.nagios.org/documentation
   Main PID: 2090 (nrpe)
      Tasks: 1 (limit: 4553)
     Memory: 1.4M (peak: 1.9M)
        CPU: 12ms
     CGroup: /system.slice/nagios-nrpe-server.service
             └─2090 /usr/sbin/nrpe -c /etc/nagios/nrpe.cfg -f

Jul 23 17:32:34 Lepard systemd[1]: Started nagios-nrpe-server.service - Nagios Remote Plugin Executor.
Jul 23 17:32:34 Lepard (nrpe)[2090]: nagios-nrpe-server.service: Referenced but unset environment variable evaluates to an empty string: NRPE_OPTS
Jul 23 17:32:34 Lepard nrpe[2090]: Starting up daemon
Jul 23 17:32:34 Lepard nrpe[2090]: Server listening on 0.0.0.0 port 5666.
Jul 23 17:32:34 Lepard nrpe[2090]: Server listening on :: port 5666.
Jul 23 17:32:34 Lepard nrpe[2090]: Listening for connections on port 5666
Jul 23 17:32:34 Lepard nrpe[2090]: Allowing connections from: 127.0.0.1,::1
nagios-nrpe-server.service: Referenced but unset environment variable evaluates to an empty string: NRPE_OPTS
The message above appears, which is fine, but since it's a bit off-putting, I overrode nagios-nrpe-server.service as follows:
# vi /etc/default/nagios-nrpe-server

Add the following:
NRPE_OPTS=""
# systemctl restart nagios-nrpe-server
Now it's no longer showing up.
⑤Open the NRPE port in the firewall
By default, NRPE uses TCP port 5666.
If a firewall is in use, open this port to allow external checks from the Nagios monitoring server.
# ufw allow 5666/tcp
# ufw reload
Check if port 5666/tcp is listening
#  ss -altnp | grep 5666

LISTEN 0      5            0.0.0.0:5666       0.0.0.0:*    users:(("nrpe",pid=4638,fd=4))


LISTEN 0      5               [::]:5666          [::]:*    users:(("nrpe",pid=4638,fd=5))
8. Adding a monitored host
Add the following server to the host and configure it as a target for simple ping death/activity monitoring
OS : Debian13.5
IP address : 192.168.11.85
①Configuration File Editing
# vi /usr/local/nagios/etc/nagios.cfg

Line 51 : Uncomment
cfg_dir=/usr/local/nagios/etc/servers
➁ Directory Create
# mkdir /usr/local/nagios/etc/servers
# chgrp nagios /usr/local/nagios/etc/servers
# chmod 750 /usr/local/nagios/etc/servers
➂ Create new definition file
The name "korodes.cfg" can be arbitrary.
# vi /usr/local/nagios/etc/servers/korodes.cfg

define host {
    use                     linux-server
    host_name               korodes
    alias                   korodes
    address                 192.168.11.85
}
define service {
    use                     generic-service
    host_name               korodes
    service_description     PING
    check_command           check_ping!100.0,20%!500.0,60%
}
④ Restart Nagios server
# systemctl restart nagios.service
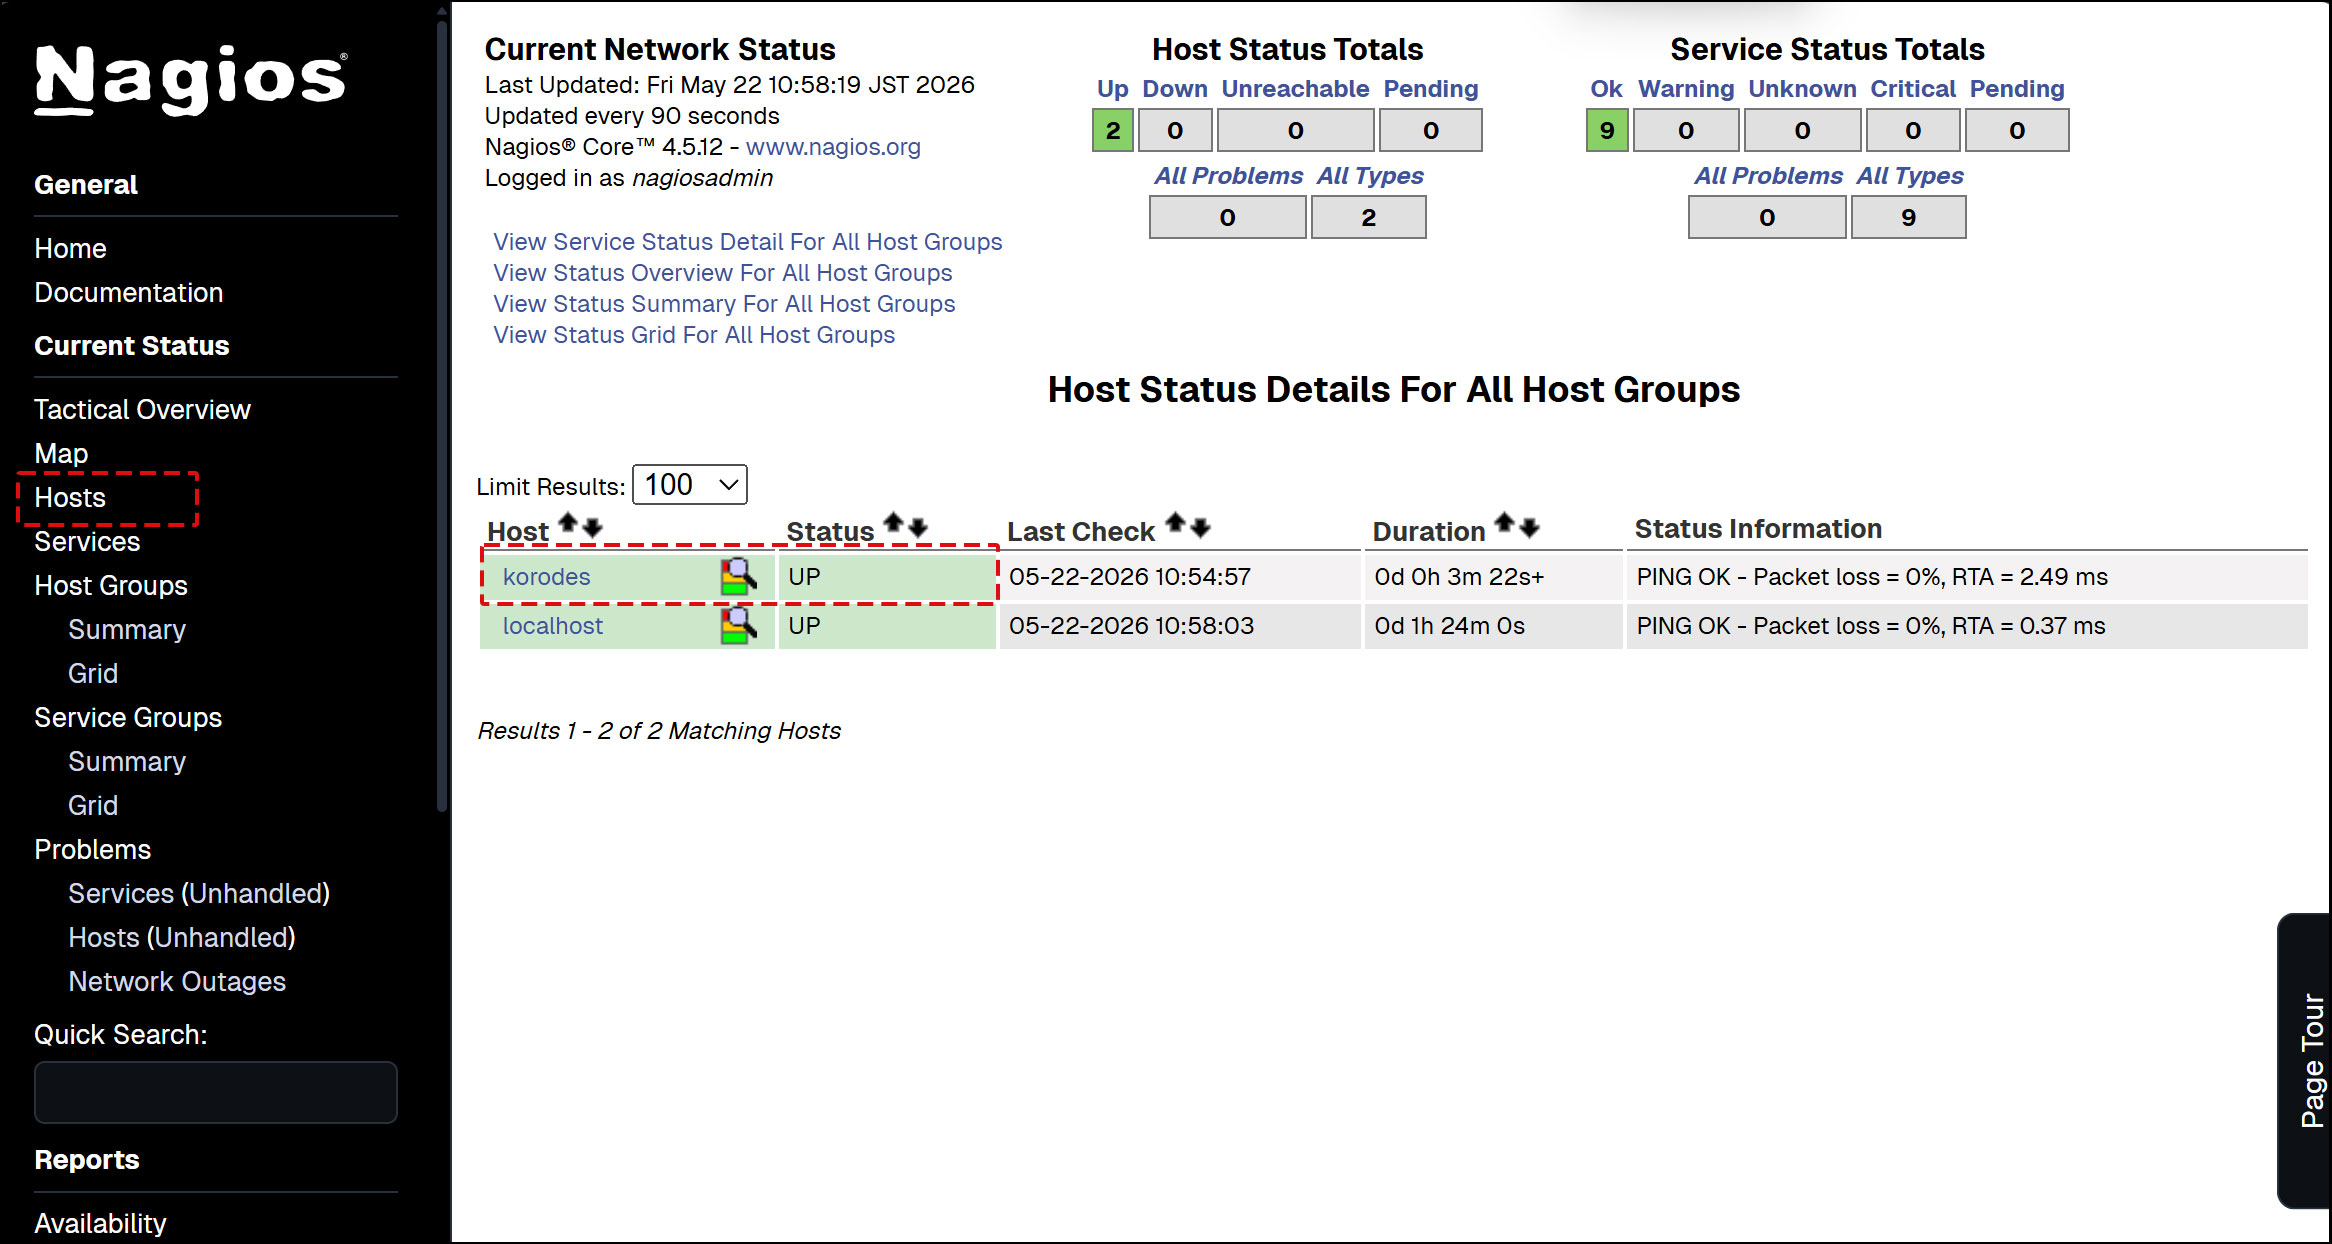
Log in to the Nagios server (http://[server IP address]/nagios) and look at Hosts, and the host is added.
9. Adding Monitoring Services
Add monitoring services to the hosts added above.
OS : Debian13.5
IP address : 192.168.11.85
9.1 Configuration on the server to be monitored
① Agent installed on monitored hosts
# apt -y install nagios-nrpe-server
➁ Configuration File Editing
# vi /etc/nagios/nrpe.cfg
Line 106 : Add a host to allow connections (specify Nagios server)
allowed_hosts=127.0.0.1,::1,192.168.11.83
Line 122 : Allow command arguments
dont_blame_nrpe=1
Line 300-304 : Comment and add
# command[check_users]=/usr/lib/nagios/plugins/check_users -w 5 -c 10
# command[check_load]=/usr/lib/nagios/plugins/check_load -r -w .15,.10,.05 -c .30,.25,.20
# command[check_hda1]=/usr/lib/nagios/plugins/check_disk -w 20% -c 10% -p /dev/hda1
# command[check_zombie_procs]=/usr/lib/nagios/plugins/check_procs -w 5 -c 10 -s Z
# command[check_total_procs]=/usr/lib/nagios/plugins/check_procs -w 150 -c 200
Add part of the plugin
command[check_by_ssh]=/usr/lib/nagios/plugins/check_by_ssh $ARG1$
command[check_dhcp]=/usr/lib/nagios/plugins/check_dhcp $ARG1$
command[check_disk]=/usr/lib/nagios/plugins/check_disk $ARG1$
command[check_file_age]=/usr/lib/nagios/plugins/check_file_age $ARG1$
command[check_ftp]=/usr/lib/nagios/plugins/check_ftp $ARG1$
command[check_http]=/usr/lib/nagios/plugins/check_http $ARG1$
command[check_imap]=/usr/lib/nagios/plugins/check_imap $ARG1$
command[check_load]=/usr/lib/nagios/plugins/check_load $ARG1$
command[check_log]=/usr/lib/nagios/plugins/check_log $ARG1$
command[check_mysql]=/usr/lib/nagios/plugins/check_mysql $ARG1$
command[check_ntp]=/usr/lib/nagios/plugins/check_ntp $ARG1$
command[check_ntp_peer]=/usr/lib/nagios/plugins/check_ntp_peer $ARG1$
command[check_ntp_time]=/usr/lib/nagios/plugins/check_ntp_time $ARG1$
command[check_ping]=/usr/lib/nagios/plugins/check_ping $ARG1$
command[check_pop]=/usr/lib/nagios/plugins/check_pop $ARG1$
command[check_spop]=/usr/lib/nagios/plugins/check_spop $ARG1$
command[check_procs]=/usr/lib/nagios/plugins/check_procs $ARG1$
command[check_smtp]=/usr/lib/nagios/plugins/check_smtp $ARG1$
command[check_ssmtp]=/usr/lib/nagios/plugins/check_ssmtp $ARG1$
command[check_ssh]=/usr/lib/nagios/plugins/check_ssh $ARG1$
command[check_swap]=/usr/lib/nagios/plugins/check_swap $ARG1$
command[check_tcp]=/usr/lib/nagios/plugins/check_tcp $ARG1$
command[check_udp]=/usr/lib/nagios/plugins/check_udp $ARG1$
command[check_ups]=/usr/lib/nagios/plugins/check_ups $ARG1$
command[check_users]=/usr/lib/nagios/plugins/check_users $ARG1$
➂ nrpe server activation and startup
# systemctl enable nagios-nrpe-server
Synchronizing state of nagios-nrpe-server.service with SysV service script with /usr/lib/systemd/systemd-sysv-install.
Executing: /usr/lib/systemd/systemd-sysv-install enable nagios-nrpe-server

# systemctl start nagios-nrpe-server

# systemctl status nagios-nrpe-server
● nagios-nrpe-server.service - Nagios Remote Plugin Executor
     Loaded: loaded (/usr/lib/systemd/system/nagios-nrpe-server.service; enabled; preset: enabled)
     Active: active (running) since Thu 2026-07-23 18:43:49 JST; 8min ago
 Invocation: 2d50ffcb71304e929af88419f1fed34d
       Docs: http://www.nagios.org/documentation
   Main PID: 4638 (nrpe)
      Tasks: 1 (limit: 4553)
     Memory: 1.4M (peak: 1.9M)
        CPU: 12ms
     CGroup: /system.slice/nagios-nrpe-server.service
             └─4638 /usr/sbin/nrpe -c /etc/nagios/nrpe.cfg -f

Jul 23 18:43:49 Lepard systemd[1]: Started nagios-nrpe-server.service - Nagios Remote Plugin Executor.
Jul 23 18:43:49 Lepard nrpe[4638]: Starting up daemon
Jul 23 18:43:49 Lepard nrpe[4638]: Server listening on 0.0.0.0 port 5666.
Jul 23 18:43:49 Lepard nrpe[4638]: Server listening on :: port 5666.
Jul 23 18:43:49 Lepard nrpe[4638]: Listening for connections on port 5666
Jul 23 18:43:49 Lepard nrpe[4638]: Allowing connections from: 127.0.0.1,::1
④ Open NRPE ports 5666/tcp and 5666/udp on firewall
# ufw allow 5666/tcp
# ufw allow 5666/udp
# ufw reload
9.2 Nagios Server Side Configuration
① nrpe plugin installation
# apt -y install nagios-nrpe-plugin
➁ Copy to nagios plugin directory
# cp /usr/lib/nagios/plugins/check_nrpe /usr/local/nagios/libexec/
➂ commands.cfg edit
# vi /usr/local/nagios/etc/objects/commands.cfg

Add to the last line
define command {
    command_name    check_nrpe
    command_line    $USER1$/check_nrpe -H $HOSTADDRESS$ -c $ARG1$
}
④ Edit and add korodes.cfg created when you added the host earlier
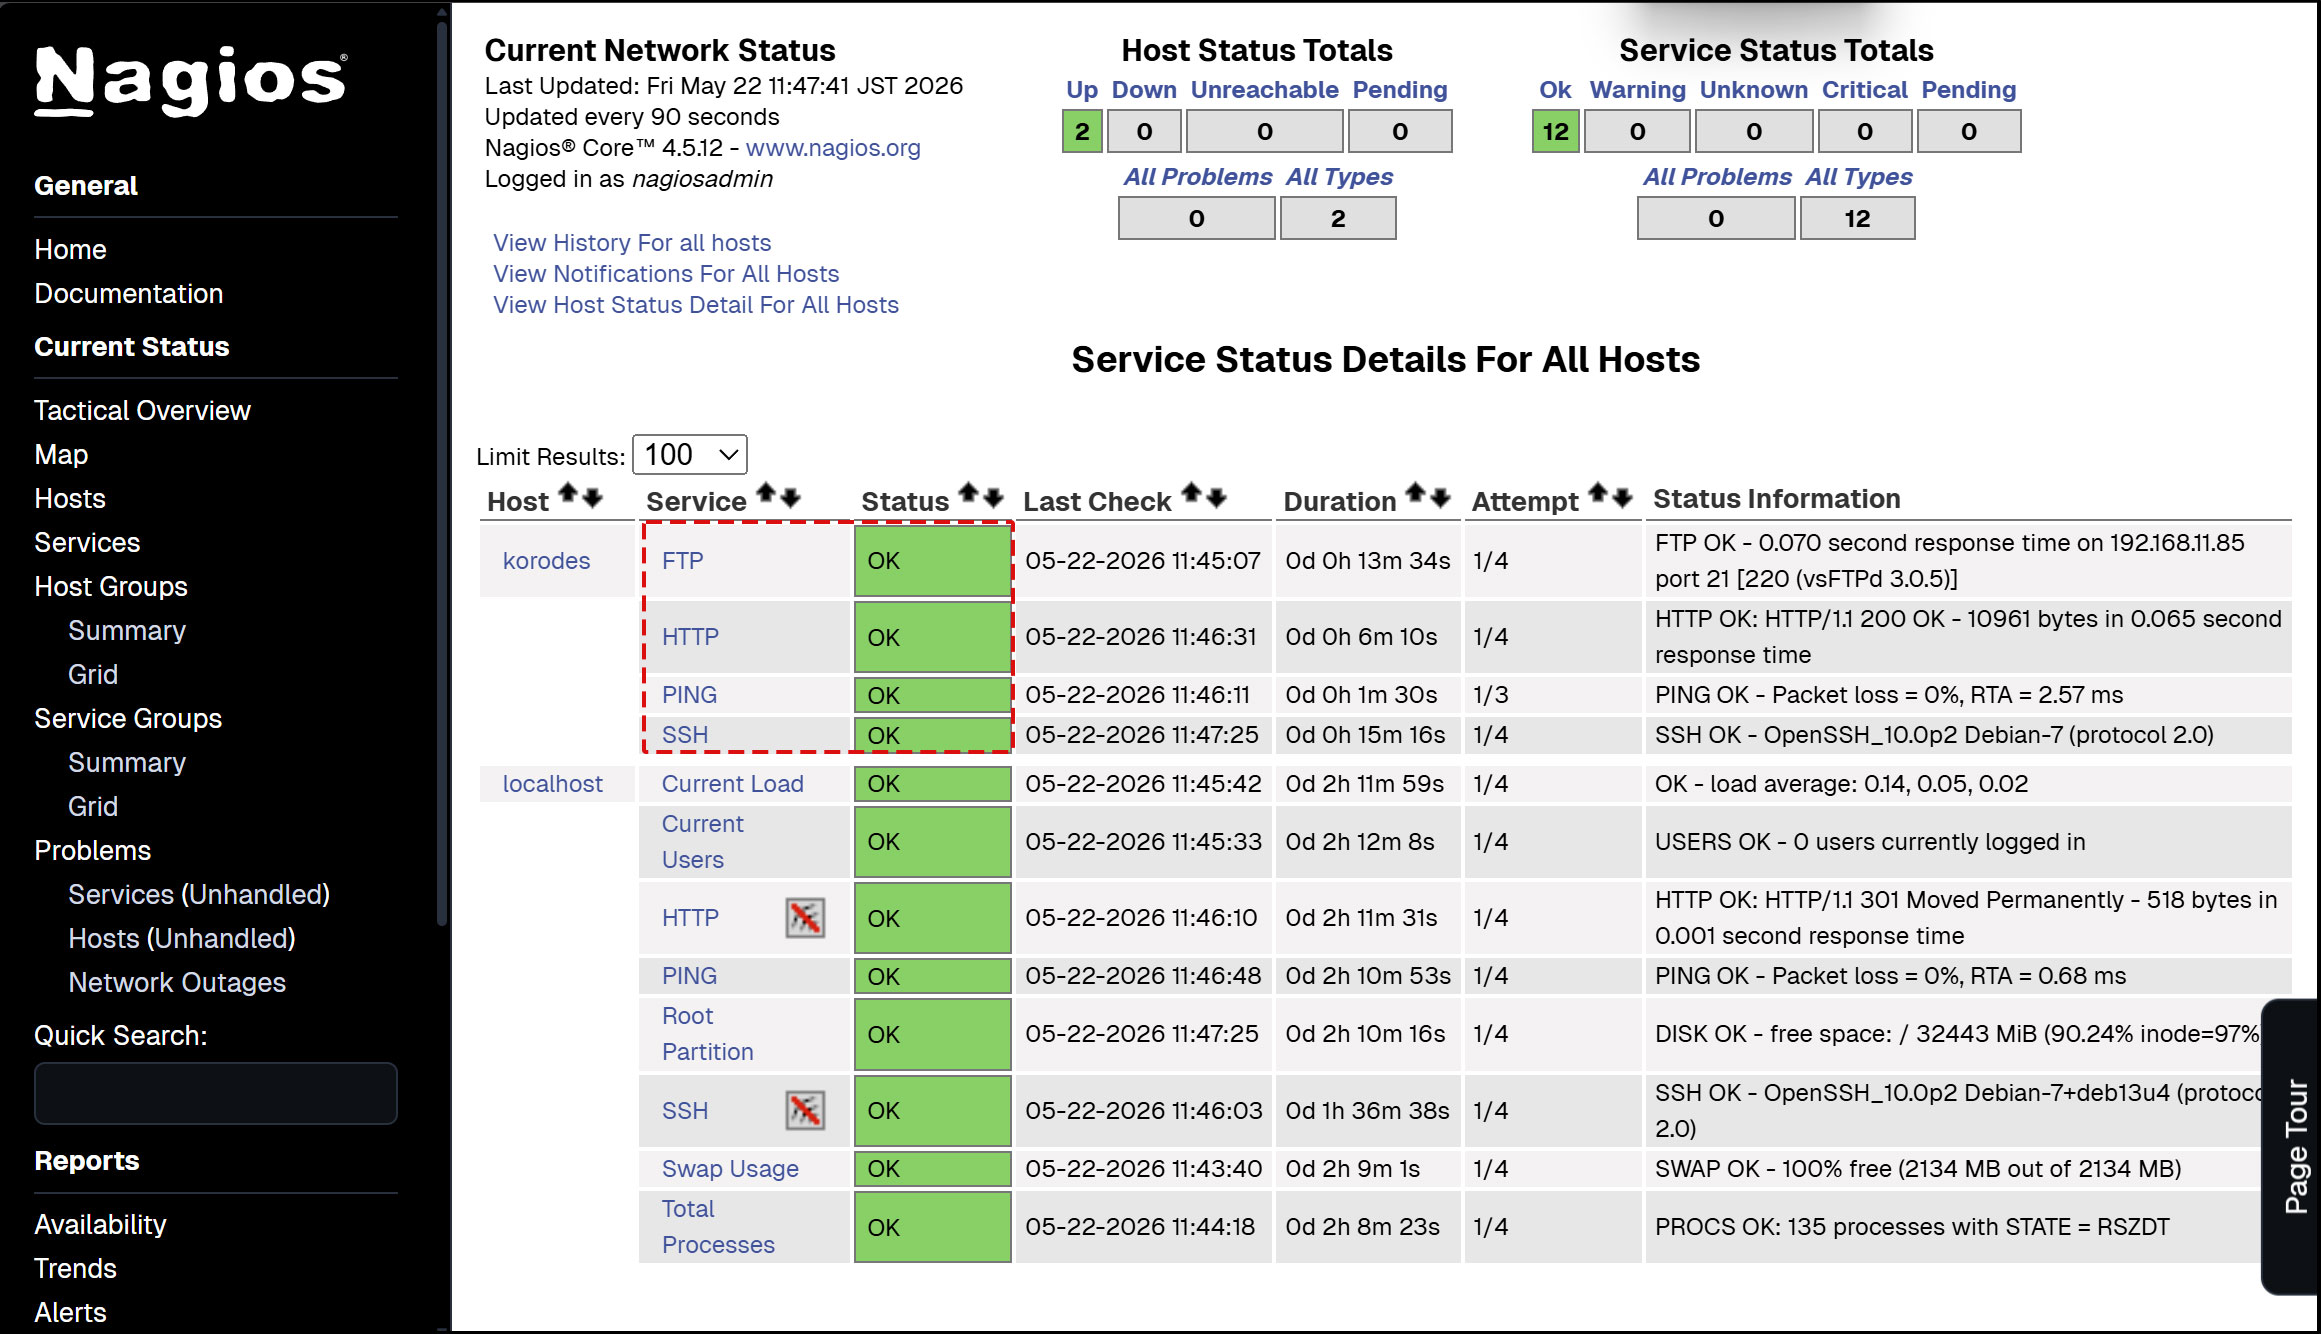
I'll add HTTP,SSH,FTP this time.
# vi /usr/local/nagios/etc/servers/korodes.cfg

# Add the following:

# 'HTTP' command definition
define service{
        use                              local-service
        host_name                        korodes
        service_description              HTTP
        check_command                    check_http
        }
# 'SSH' command definition
define service{
        use                              local-service
        host_name                        korodes
        service_description              SSH
        check_command                    check_ssh
       }
# 'FTP' command definition
define service{
        use                              local-service
        host_name                        korodes
        service_description              FTP
        check_command                    check_ftp
        }
⑤ Restart Nagios
# systemctl restart nagios.service
⑥ Access http://[Nagios Server IP Address]/nagios
Newly added monitoring services are added as shown in the figure below.