オープンソースの統合監視ソフトウェア「Zabbix7」インストール
Zabbix とは、サーバー、ネットワーク、アプリケーションを集中監視するためのオープンソースの統合監視ソフトウェアです。統合監視に必要な監視、障害検知、通知機能を備えています。多数のプラットフォームに対応した Zabbix エージェントと SNMP に対応しているため、システム全体を Zabbix ひとつで監視することが可能です。
Zabbixを実行するにはPHPプログラミング言語、データベースサーバーとしてはMySQL/MariaDB、ApacheやNginxなどのWebサーバーが必要です。
今回は次の条件がすべてが構成済みで自動起動設定も完了していることが前提で進めます。
FreeBSD15.1 IP(192.168.11.83)
Apache/2.4.68 (FreeBSD)
mysql Ver 8.4.10 for FreeBSD15.0 on amd64 (Source distribution)
PHP 8.3.31 (cli)
PHP 8.3.31 (fpm-fcgi)
Zabbix 7 サーバ、フロントエンド、エージェントをインストール
# pkg search zabbix

py312-pyzabbix-1.3.1_1         Zabbix API Python Library
zabbix6-agent-6.0.47           Enterprise-class open source distributed monitoring (agent)
zabbix6-frontend-php82-6.0.47  Enterprise-class open source distributed monitoring (frontend-php82)
zabbix6-frontend-php83-6.0.47  Enterprise-class open source distributed monitoring (frontend-php83)
zabbix6-frontend-php84-6.0.47  Enterprise-class open source distributed monitoring (frontend-php84)
zabbix6-frontend-php85-6.0.47  Enterprise-class open source distributed monitoring (frontend-php85)
zabbix6-frontend-php86-6.0.47  Enterprise-class open source distributed monitoring (frontend-php86)
zabbix6-java-6.0.47            Enterprise-class open source distributed monitoring (java)
zabbix6-proxy-6.0.47           Enterprise-class open source distributed monitoring (proxy)
zabbix6-server-6.0.47          Enterprise-class open source distributed monitoring (server)
zabbix7-agent-7.0.28           Enterprise-class open source distributed monitoring (agent)
zabbix7-frontend-php82-7.0.28  Enterprise-class open source distributed monitoring (frontend-php82)
zabbix7-frontend-php83-7.0.28  Enterprise-class open source distributed monitoring (frontend-php83)
zabbix7-frontend-php84-7.0.28  Enterprise-class open source distributed monitoring (frontend-php84)
zabbix7-frontend-php85-7.0.28  Enterprise-class open source distributed monitoring (frontend-php85)
zabbix7-frontend-php86-7.0.28  Enterprise-class open source distributed monitoring (frontend-php86)
zabbix7-java-7.0.28            Enterprise-class open source distributed monitoring (java)
zabbix7-proxy-7.0.28           Enterprise-class open source distributed monitoring (proxy)
zabbix7-server-7.0.28          Enterprise-class open source distributed monitoring (server)
zabbix74-agent-7.4.11          Enterprise-class open source distributed monitoring (agent)
zabbix74-frontend-php82-7.4.11 Enterprise-class open source distributed monitoring (frontend-php82)
zabbix74-frontend-php83-7.4.11 Enterprise-class open source distributed monitoring (frontend-php83)
zabbix74-frontend-php84-7.4.11 Enterprise-class open source distributed monitoring (frontend-php84)
zabbix74-frontend-php85-7.4.11 Enterprise-class open source distributed monitoring (frontend-php85)
zabbix74-frontend-php86-7.4.11 Enterprise-class open source distributed monitoring (frontend-php86)
zabbix74-java-7.4.11           Enterprise-class open source distributed monitoring (java)
zabbix74-proxy-7.4.11          Enterprise-class open source distributed monitoring (proxy)
zabbix74-server-7.4.11         Enterprise-class open source distributed monitoring (server)
今回はZabbix7.4.11と関連拡張機能をインストールします
# pkg install -y zabbix74-server zabbix74-frontend-php83 zabbix74-agent php83-mysqli php83-mbstring php83-gd php83-bcmath php83-curl
Zabbix用のデータベースとユーザーを作成する
1.zabbix用データベース作成と初期化
database my_zabbix_db
user zabbix_user
password ?WWabcd123
# mysql -u root -p
Password:
>CREATE DATABASE my_zabbix_db;
>CREATE USER 'zabbix_user'@'localhost' IDENTIFIED BY '?WWabcd123';
>GRANT ALL PRIVILEGES ON my_zabbix_db.* TO 'zabbix_user'@'localhost';
>set global log_bin_trust_function_creators = 1;
>exit;
初期化
# cd /usr/local/share/zabbix74/server/database/mysql
# mysql -uzabbix_user -p?WWabcd123 my_zabbix_db < schema.sql
# mysql -uzabbix_user -p?WWabcd123 my_zabbix_db < images.sql
# mysql -uzabbix_user -p?WWabcd123 my_zabbix_db < data.sql
データベーススキーマのインポート後、log_bin_trust_function_creators オプションを無効にしてください。
# mysql -uroot -p
password
mysql> set global log_bin_trust_function_creators = 0;
mysql> exit;
Zabbix構成を更新
Zabbixサーバーがデータベースに接続するためにZabbixサーバー設定ファイル/etc/zabbix/zabbix_server.confを編集し、データベース設定を更新する
# vi /usr/local/etc/zabbix74/zabbix_server.conf

94行目変更
DBName=my_zabbix_db
110行目変更
DBUser=zabbix_user
118行目コメント解除して追記
DBPassword=?WWabcd123
自動起動設定
# vi /etc/rc.conf

下記を追加する
zabbix_server_enable="yes"
起動
# /usr/local/etc/rc.d/zabbix_server start
Zabbix サーバー自身も監視する Zabbix Agentd の設定
# vi /usr/local/etc/zabbix74/zabbix_agentd.conf

# 113行目 : Zabbix サーバーを指定
Server=127.0.0.1
# 169行目 : Zabbix サーバーを指定
ServerActive=127.0.0.1
# 178行目 : 自身のホスト名に変更
Hostname=Lepard
自動起動設定
# vi /etc/rc.conf

下記を追加する
zabbix_agentd_enable="YES"
起動
# /usr/local/etc/rc.d/zabbix_agentd start
Zabbix Frontend の設定
Zabbix Frontend のためのウェブサーバ Apache httpdの設定
# vi /usr/local/etc/apache24/httpd.conf

末尾に下記を追加する
<FilesMatch "\.php$">
    SetHandler application/x-httpd-php
</FilesMatch>
<FilesMatch "\.phps$">
    SetHandler application/x-httpd-php-source
</FilesMatch>
<Directory "/usr/local/www/zabbix74">
    Options Indexes FollowSymLinks
    AllowOverride None
    Require all granted
</Directory>

DocumentRoot "/usr/local/www/zabbix74"
DirectoryIndex index.html index.php
PHP の設定
# vi /usr/local/etc/php-fpm.d/www.conf

最終行に追記
php_value[max_execution_time] = 300
php_value[memory_limit] = 128M
php_value[post_max_size] = 16M
php_value[upload_max_filesize] = 2M
php_value[max_input_time] = 300
php_value[max_input_vars] = 10000
php_value[always_populate_raw_post_data] = -1
php_value[date.timezone] = Asia/Tokyo
Apache再起動
# /usr/local/etc/rc.d/apache24 restart
Zabbix Webインストーラーの実行
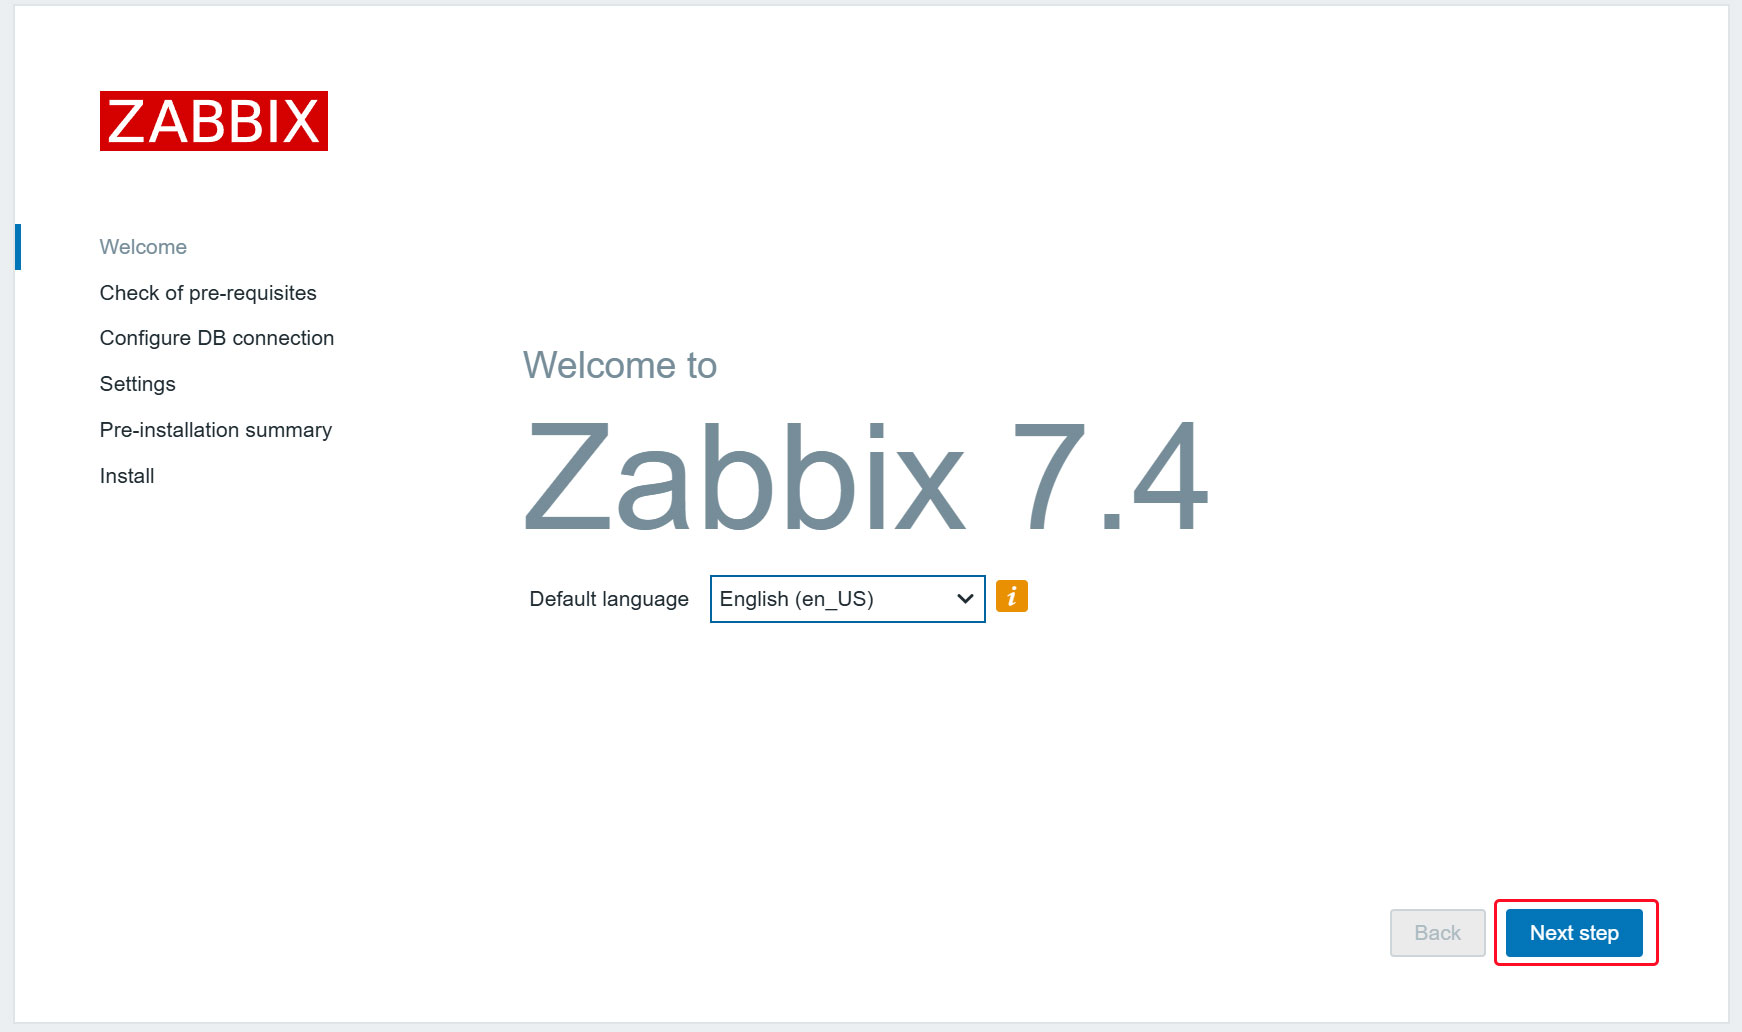
Webブラウザーを開き、http://[IP address]/setup.php にアクセス
次の画面になる。[ Next step]をクリック
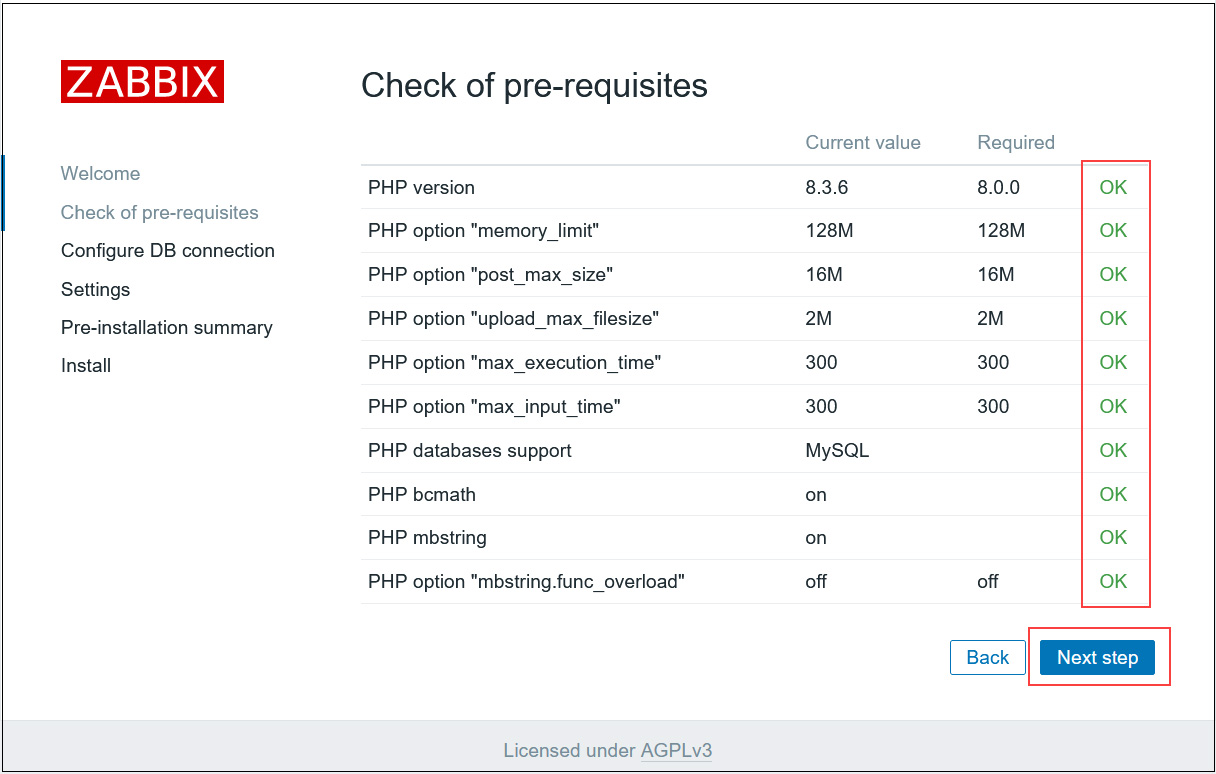
すべての要件がOKになっていることを確認後、[ Next step ]をクリック
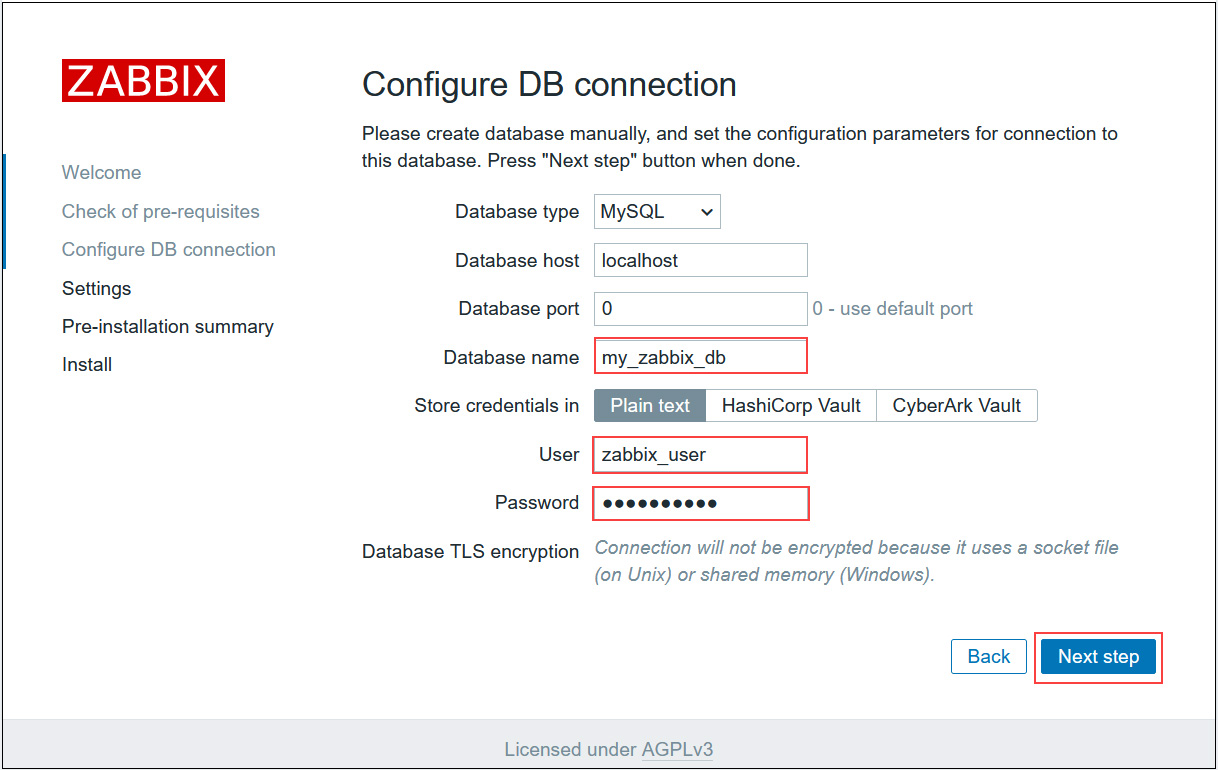
「Database name」「User」「Password」欄には、設定した情報を入力し、[ Next step ]をクリック
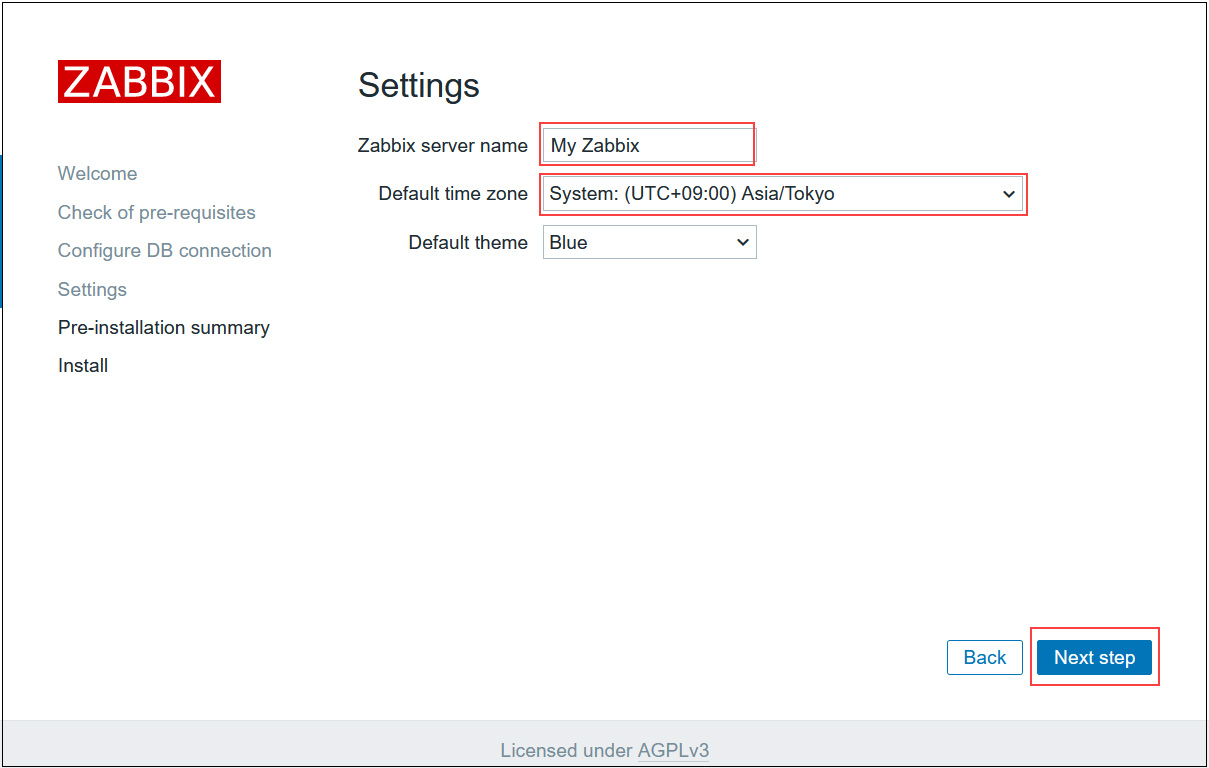
「Zabbix server names」は任意の名称を入力し、タイムゾーンにはAsia/Tokyoを選択する
自身のタイムゾーンになっているか確認後、[ Next step ]をクリック
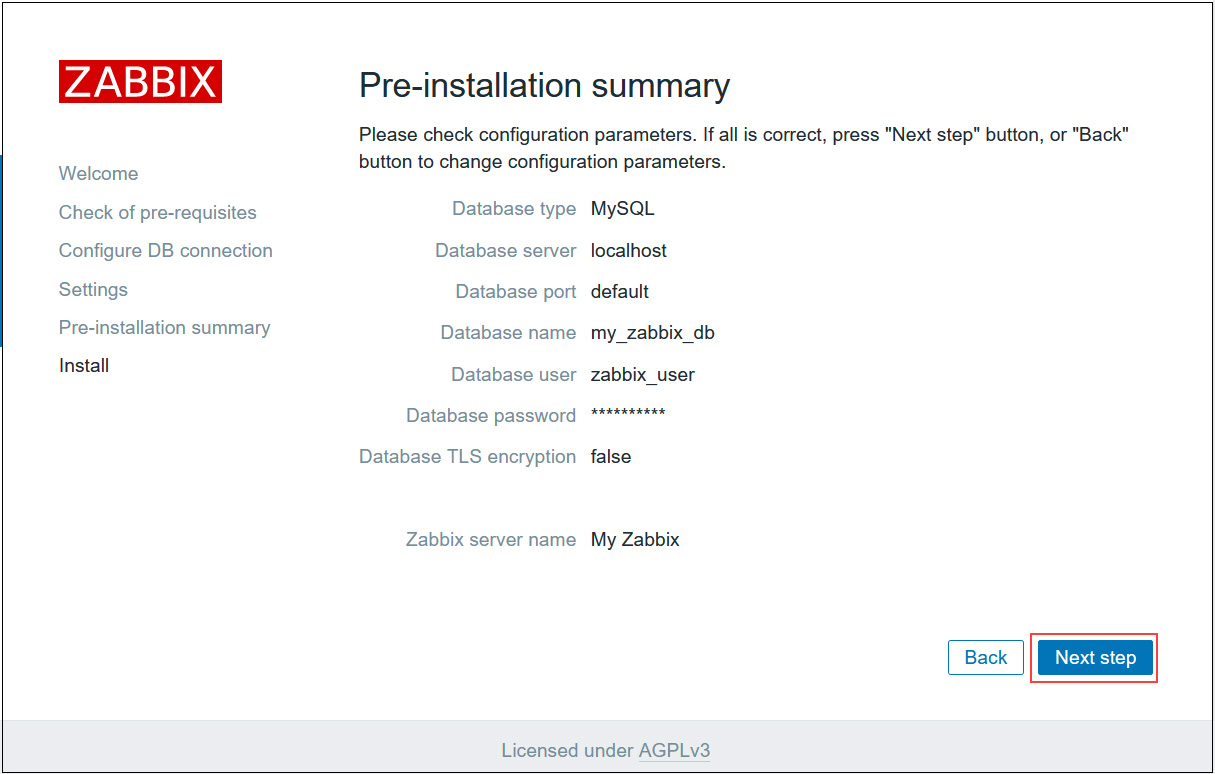
設定の再確認 情報が正しければ[Next step ]をクリック
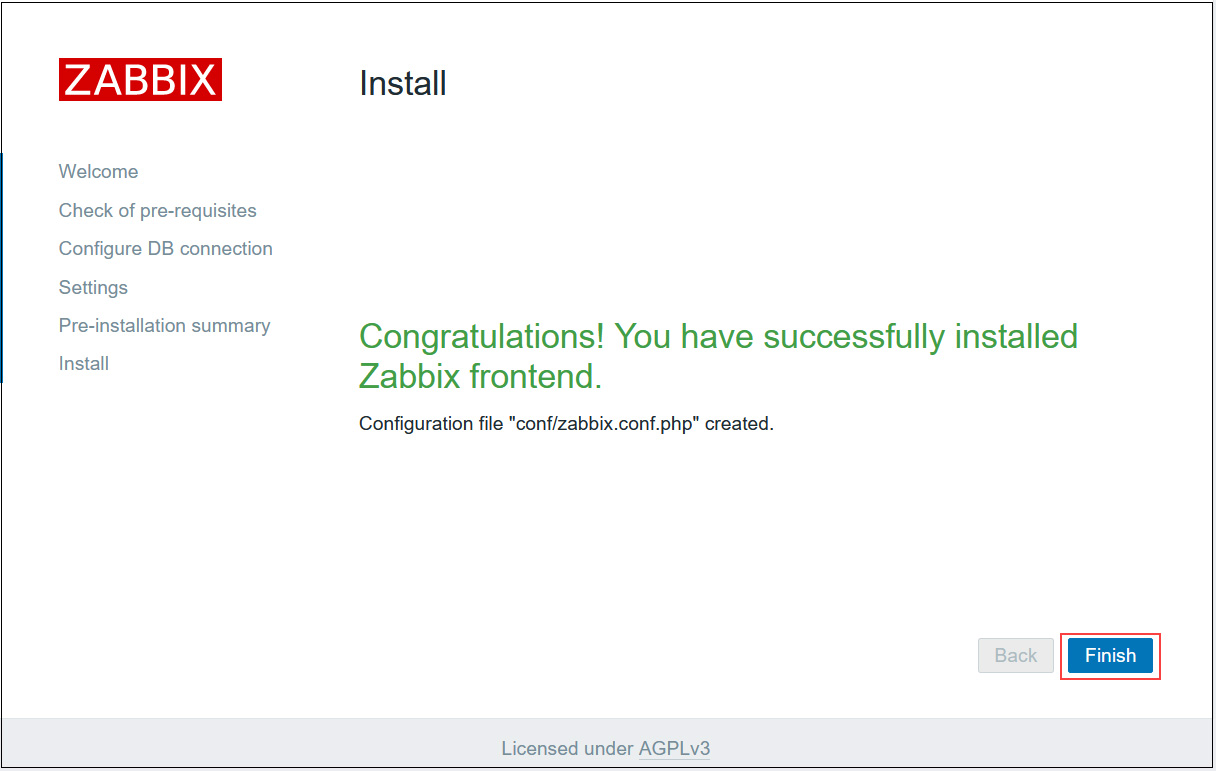
インストールが正常に完了すると、次のページが表示されます。「Finish」クリック
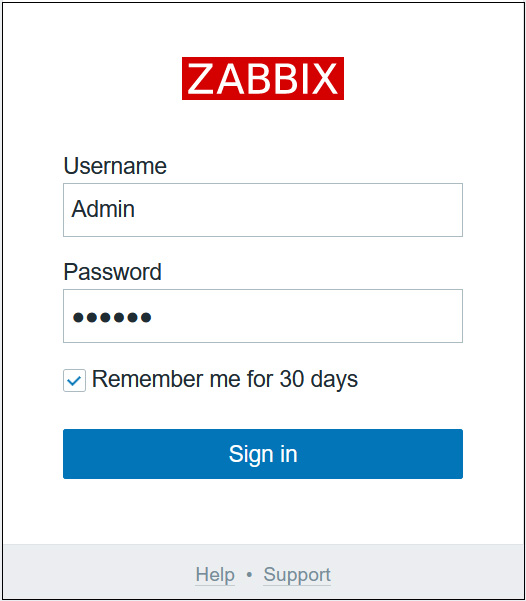
Zabbixログインページにリダイレクトされます
次のデフォルト資格情報を使用してログインします。
ユーザー名:Admin
パスワード:zabbix
ログインに成功すると次の画面(Zabbixダッシュボード)になる。
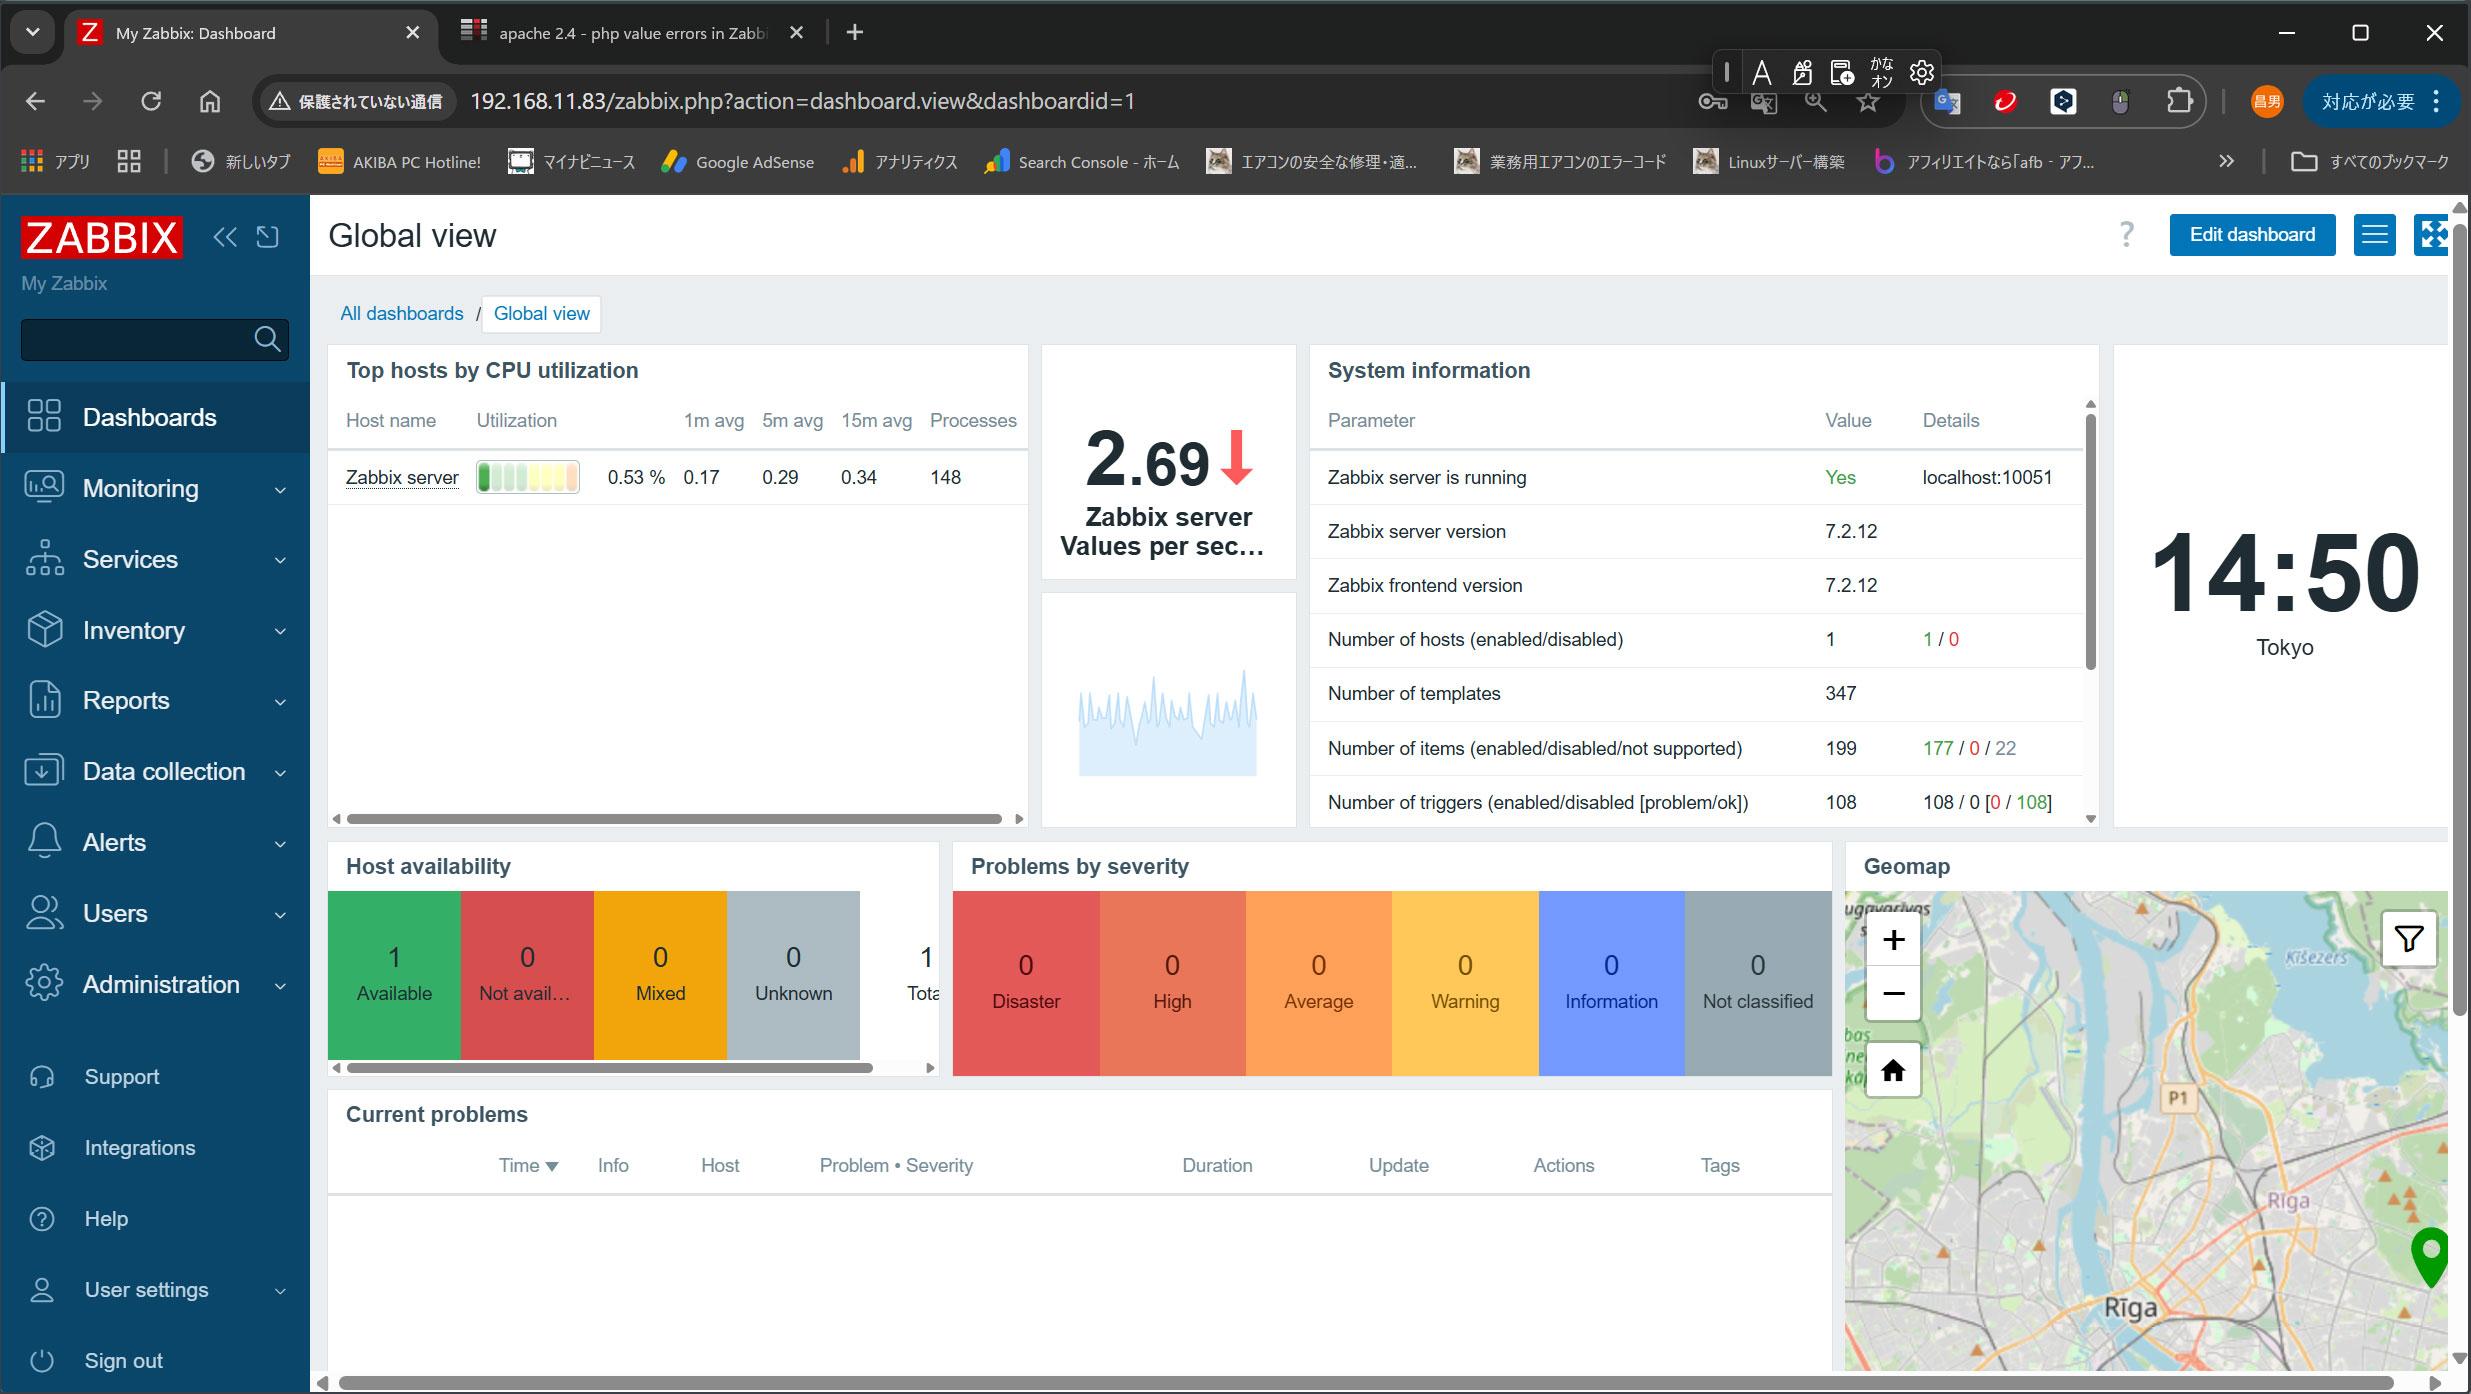
Zabbixの各種設定
管理者パスワード変更
セキュリティ上、デフォルトの管理者パスワードを変更しておきます
上記ダッシュボードが表示されれば、続いて
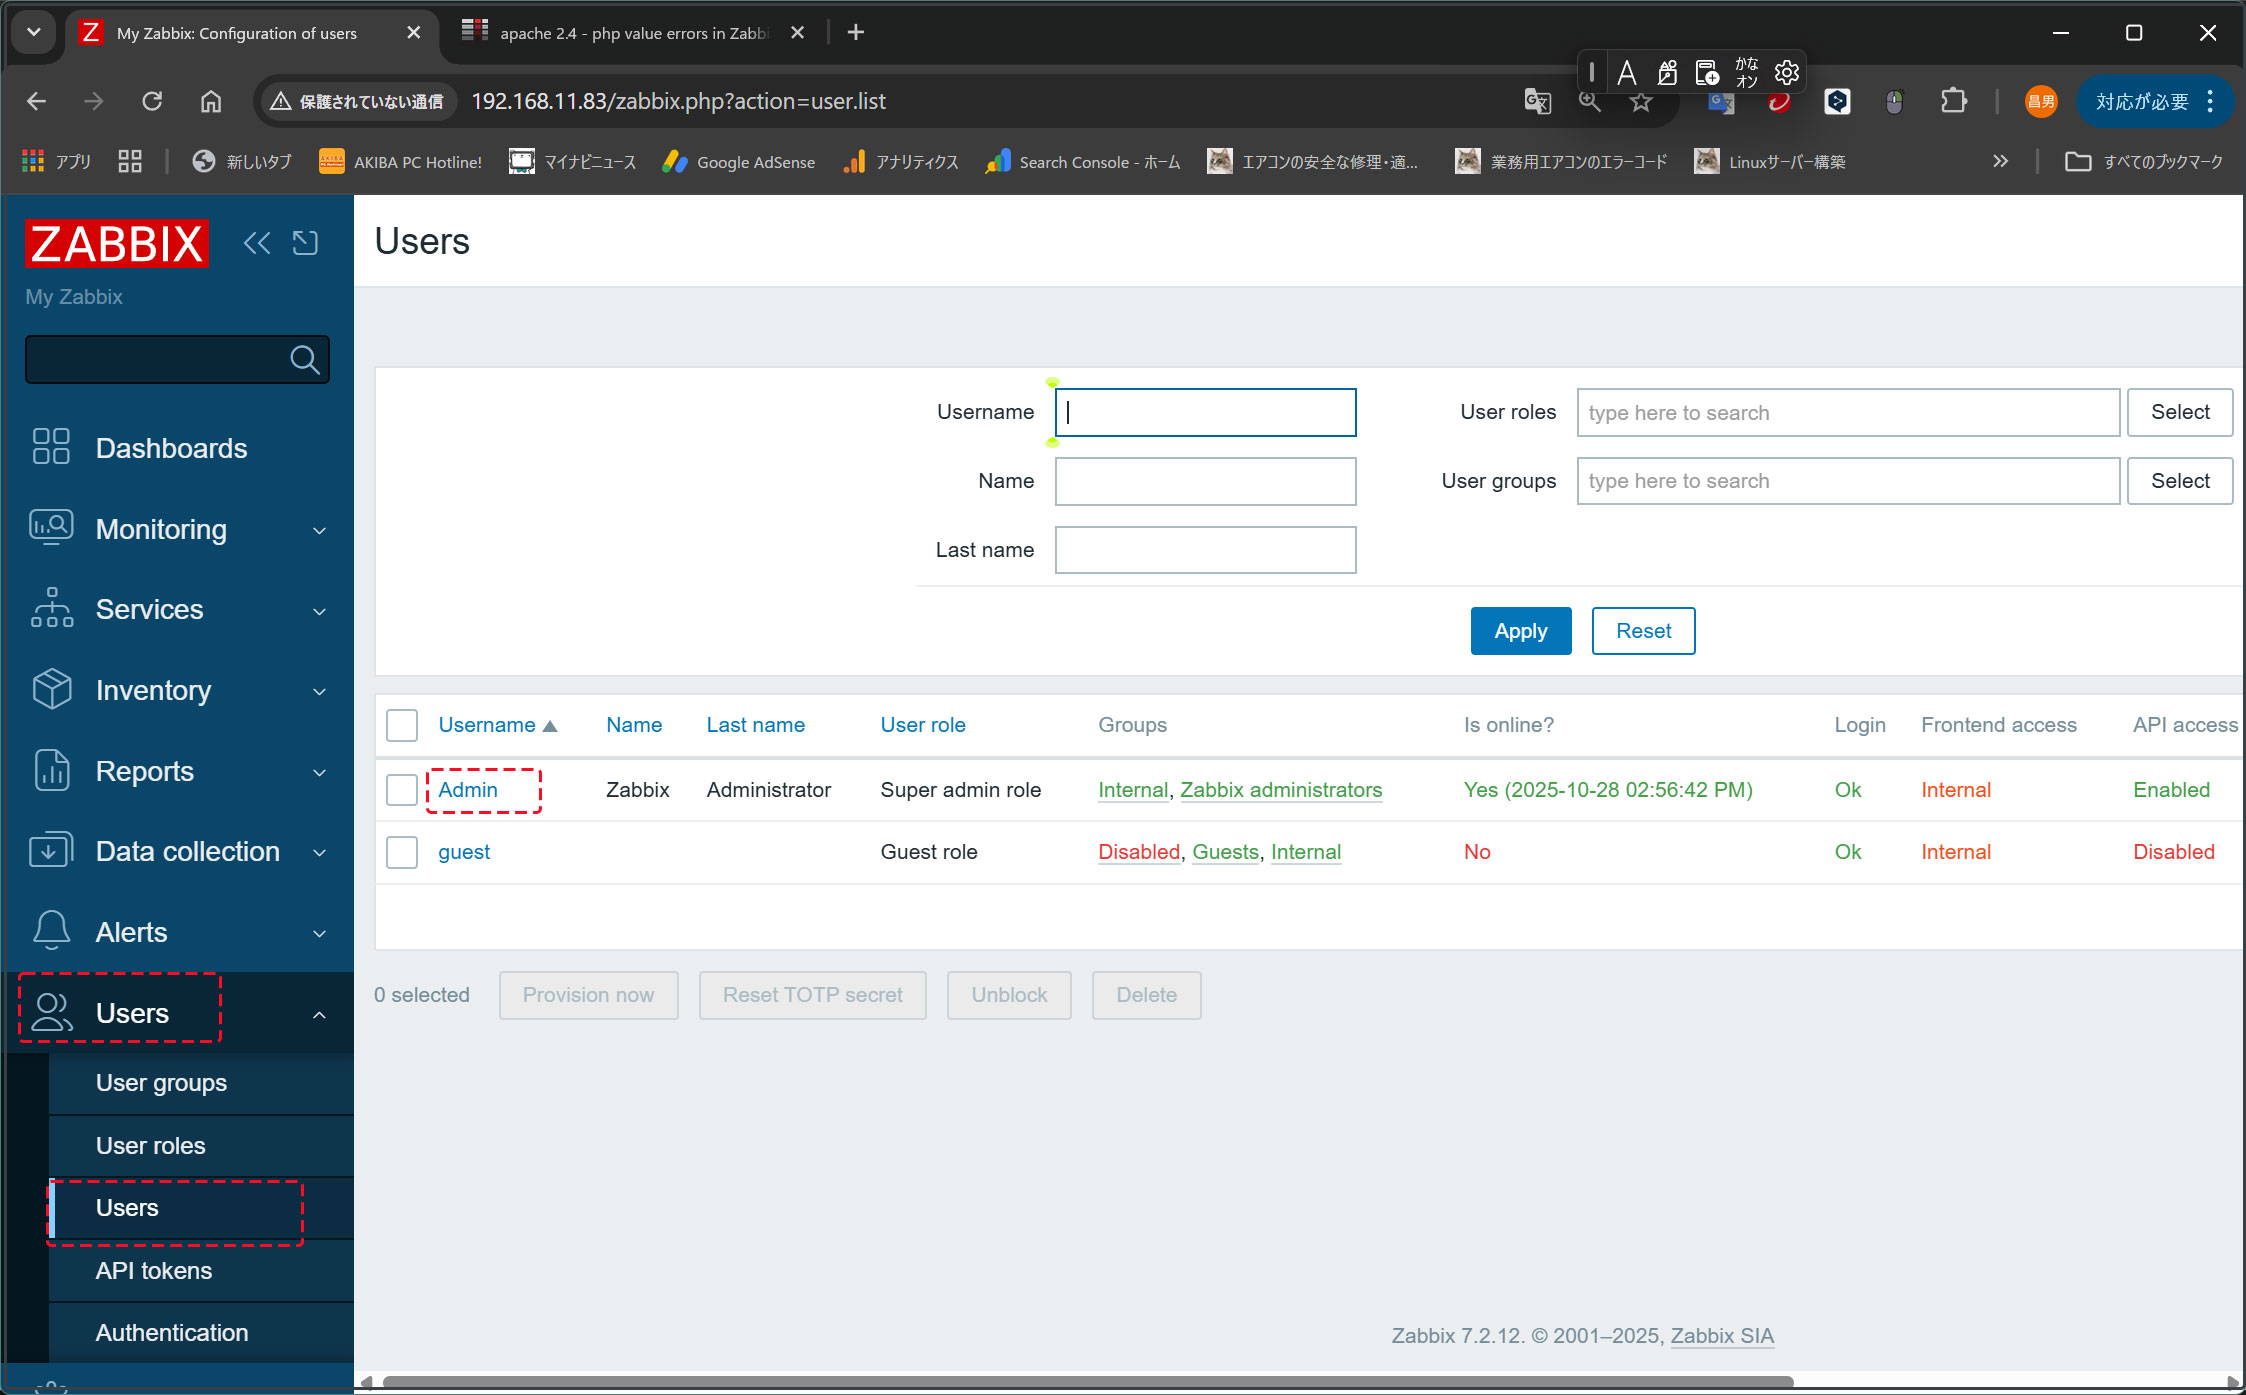
①左ペインで [Users] - [Users] を選択して、右ペインで [Admin] をクリックします
②[Change paddword] をクリック
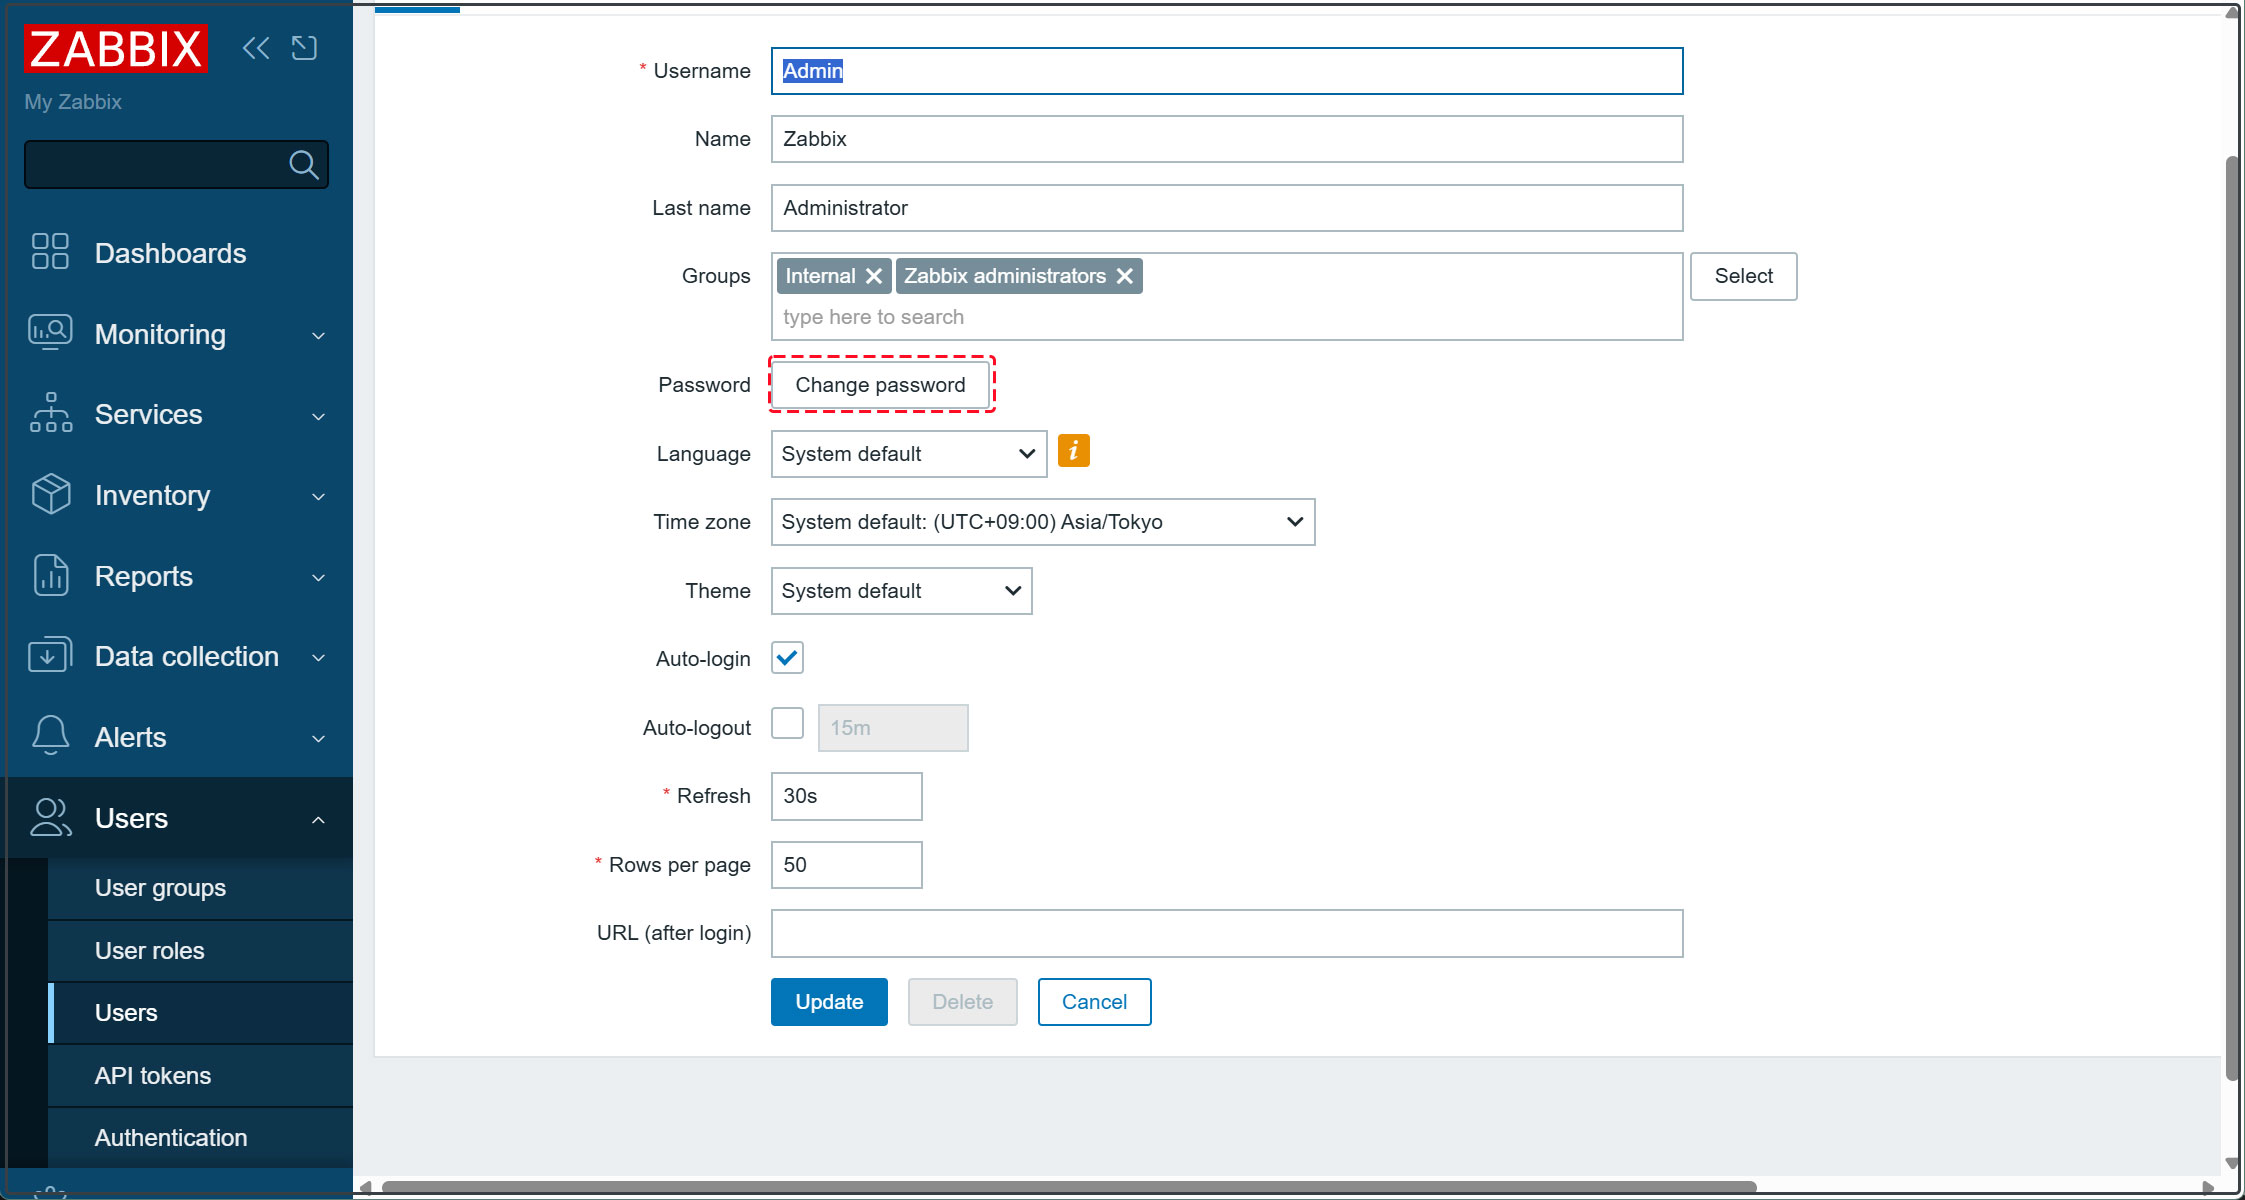
③Current password : デフォルトのパスワード zabbixを入力
変更したいパスワードを入力して [Update] をクリックする
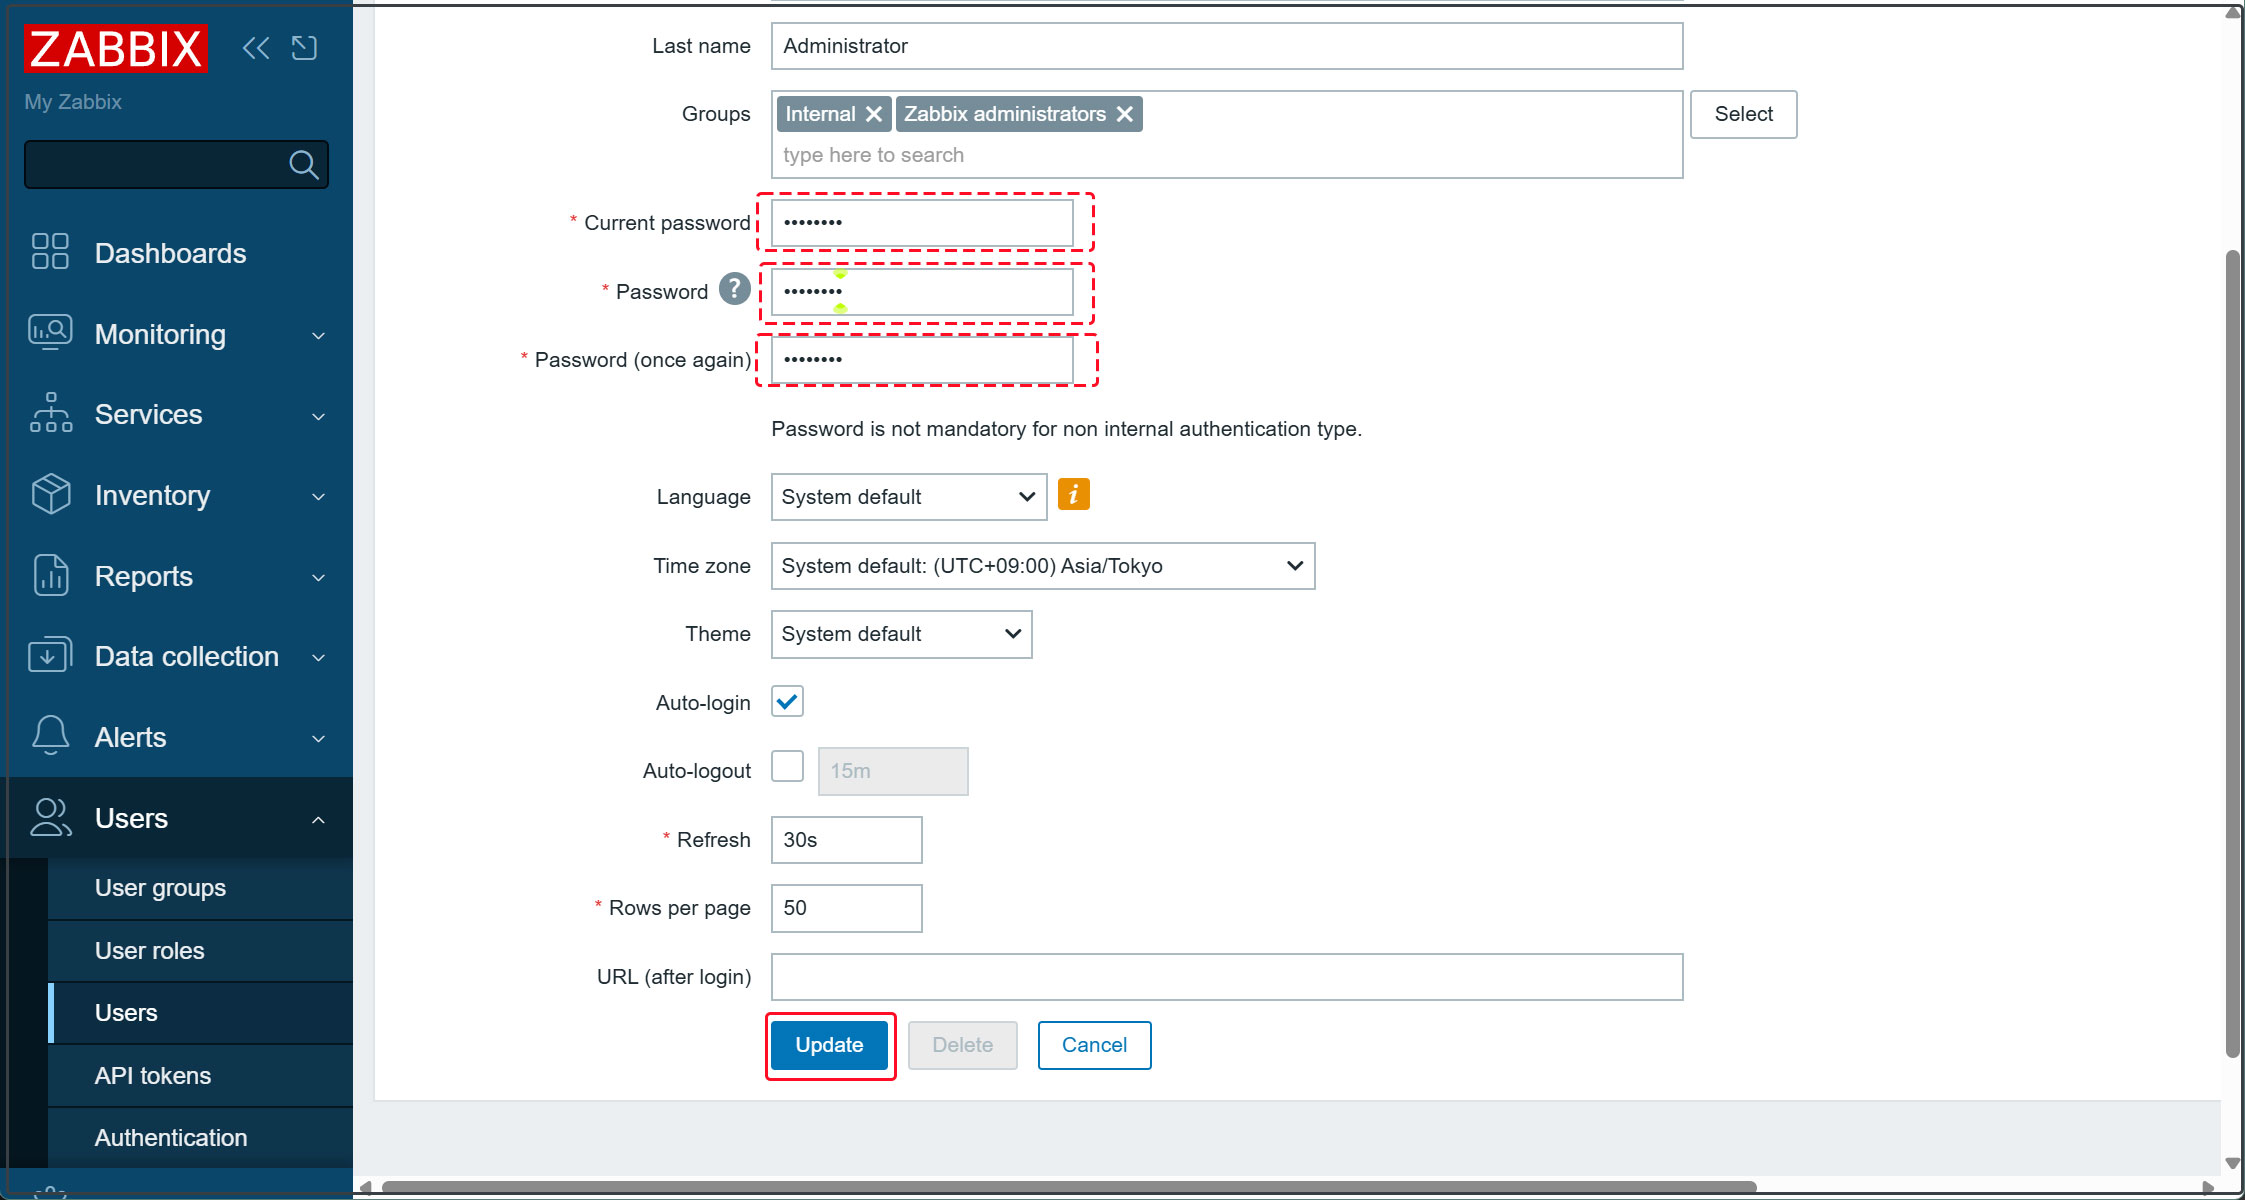
下記が表示されるので[OK]をクリック
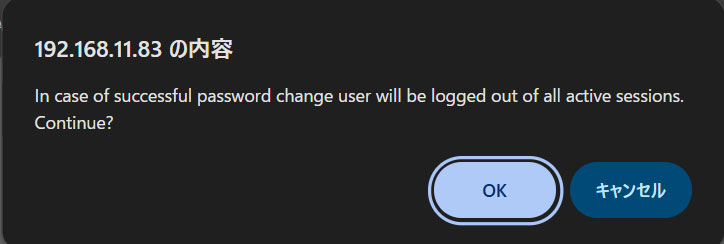
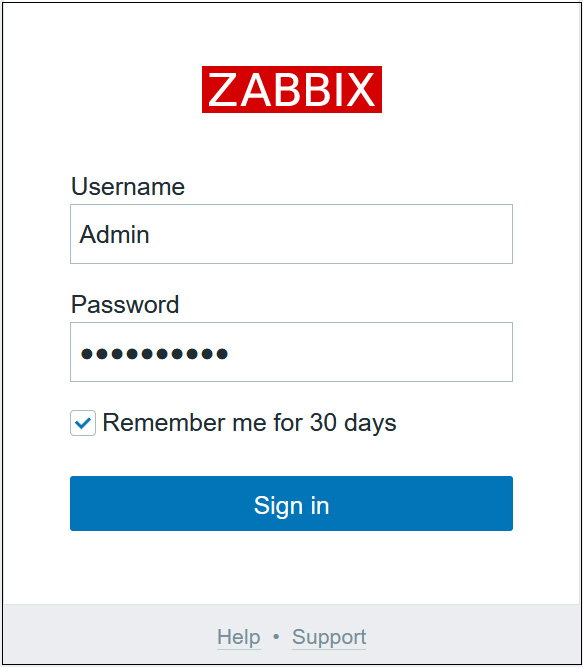
再度ログイン認証画面にリダイレクトしますので作成したパスワードでログインします
メールでの通知設定
各種情報等をメールで受け取れるように通知の設定をしておきます。
サーバーにpostfix等SMTPサーバーが構築されていることが前提です。
①左ペインで [Alerts] - [Media Types] を選択し、右ペインで [Email] をクリック
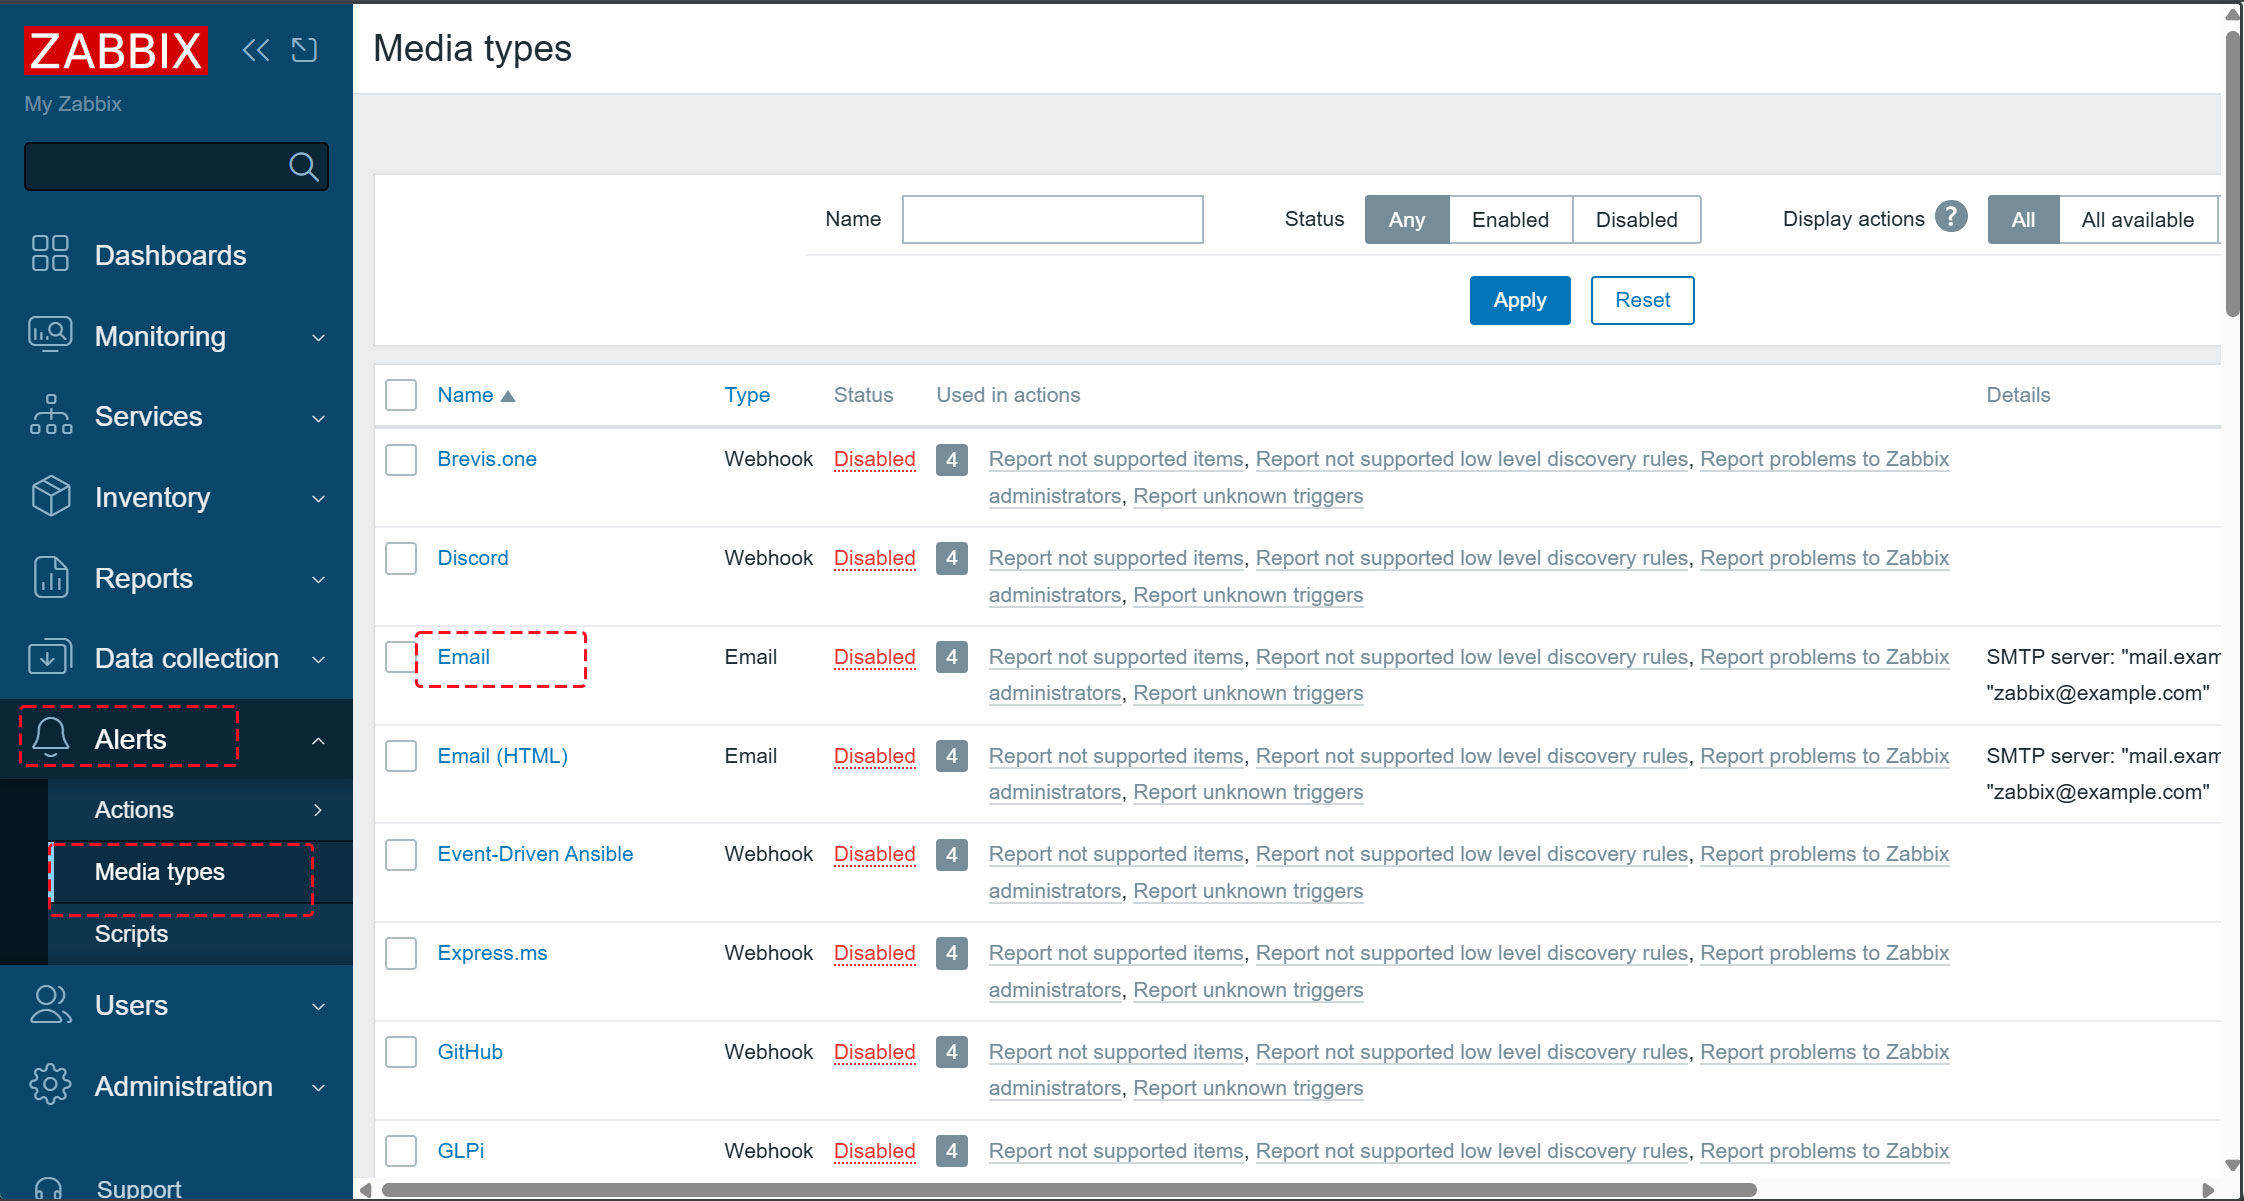
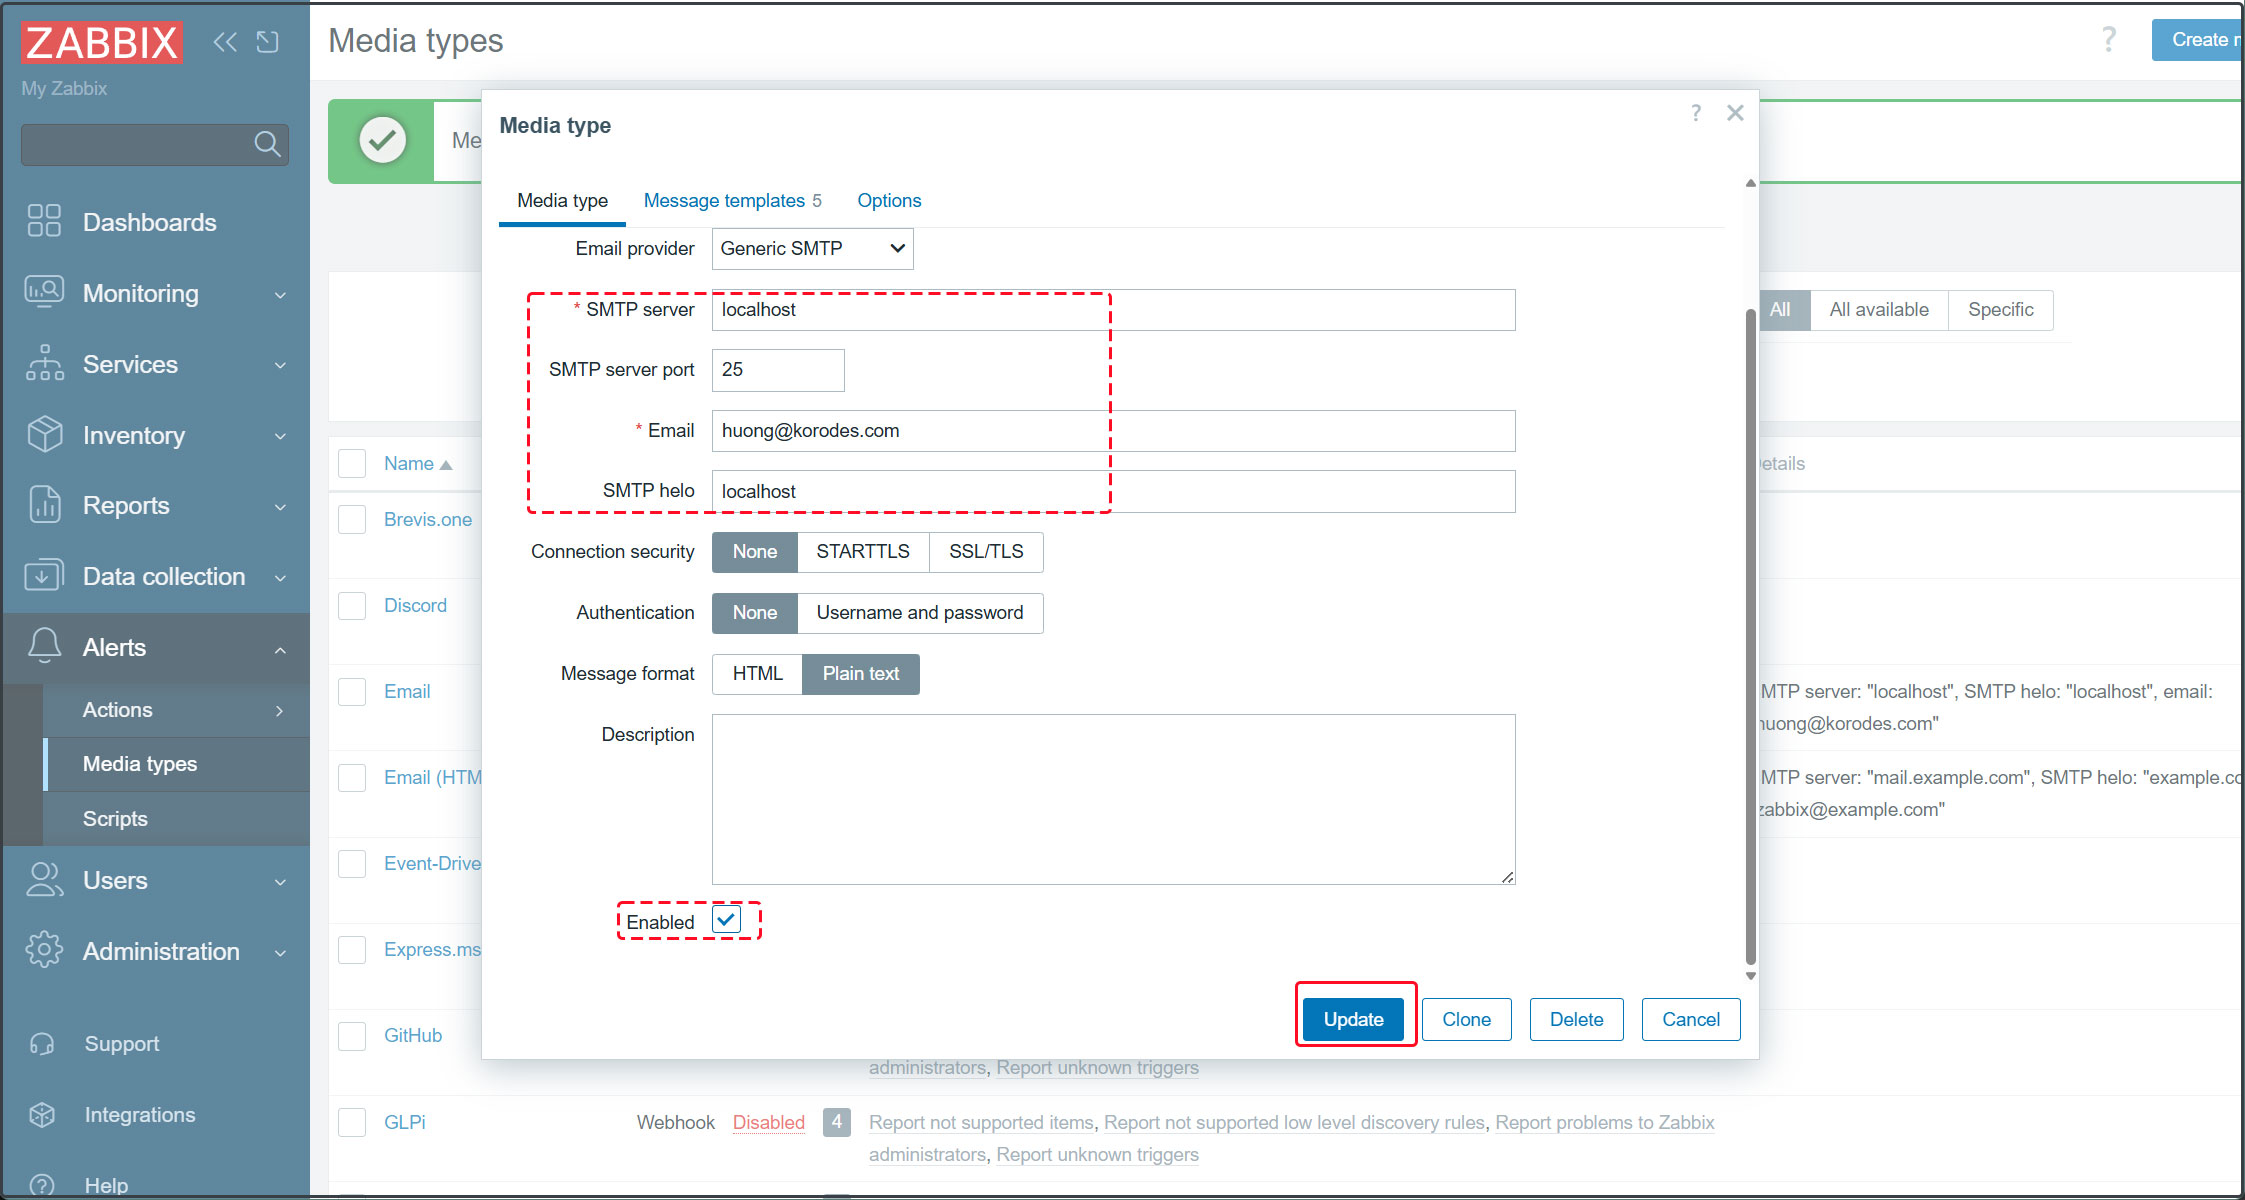
➁下図のようにメールサーバーの設定をし、 [Enabled] にチェックを入れ [Update] ボタンをクリック
[Email]には管理者メールアドレスを記載する
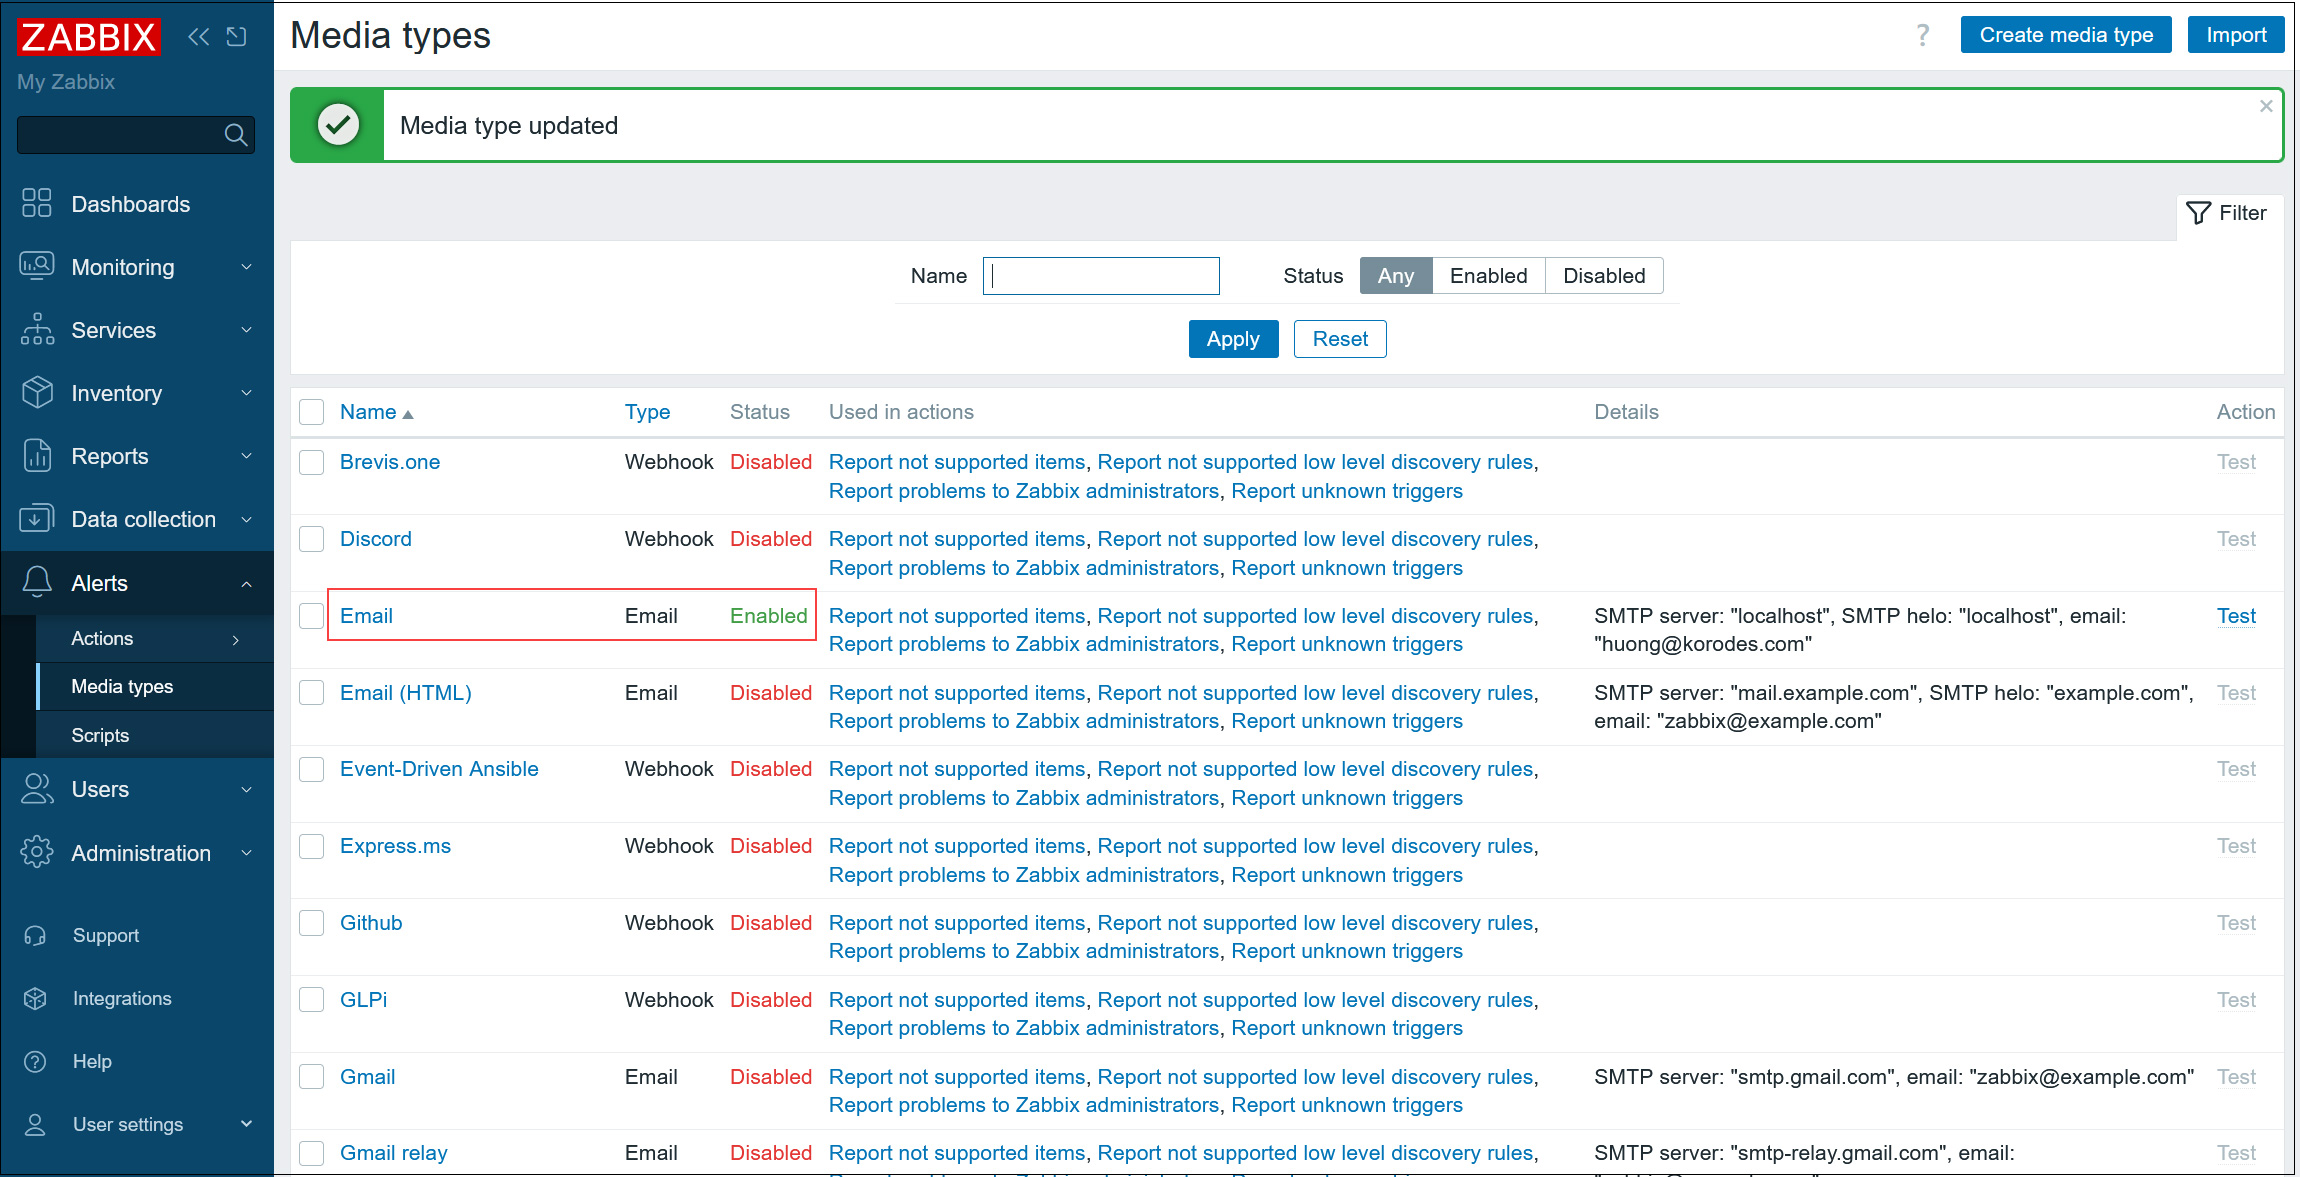
➂[Email] が [Enabled] になります
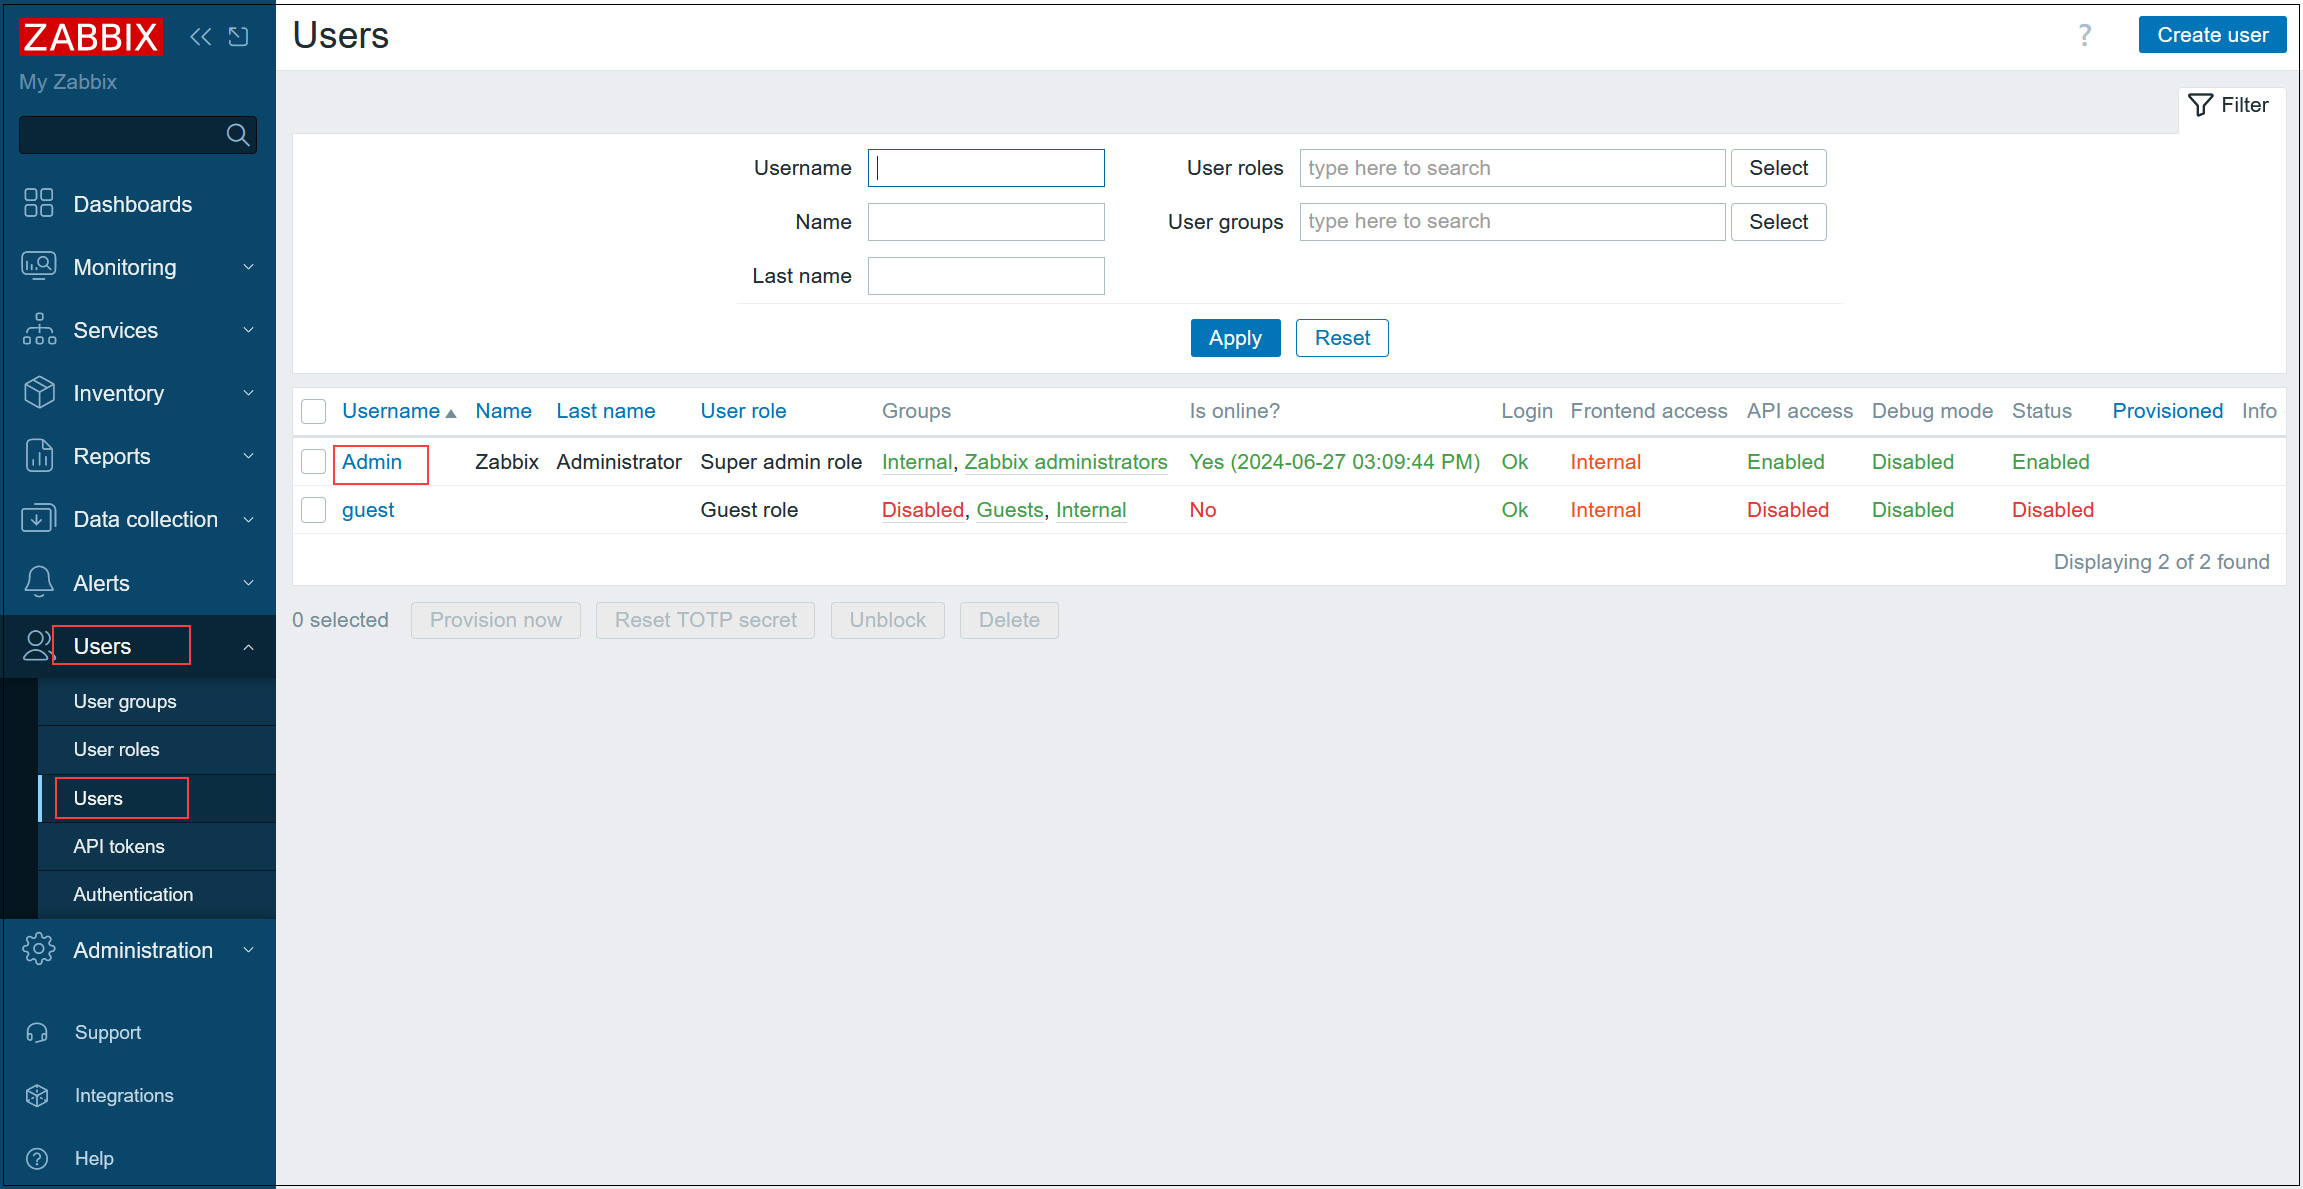
④左ペインで [Users] - [Users] を選択し、右ペインで [Admin] をクリック
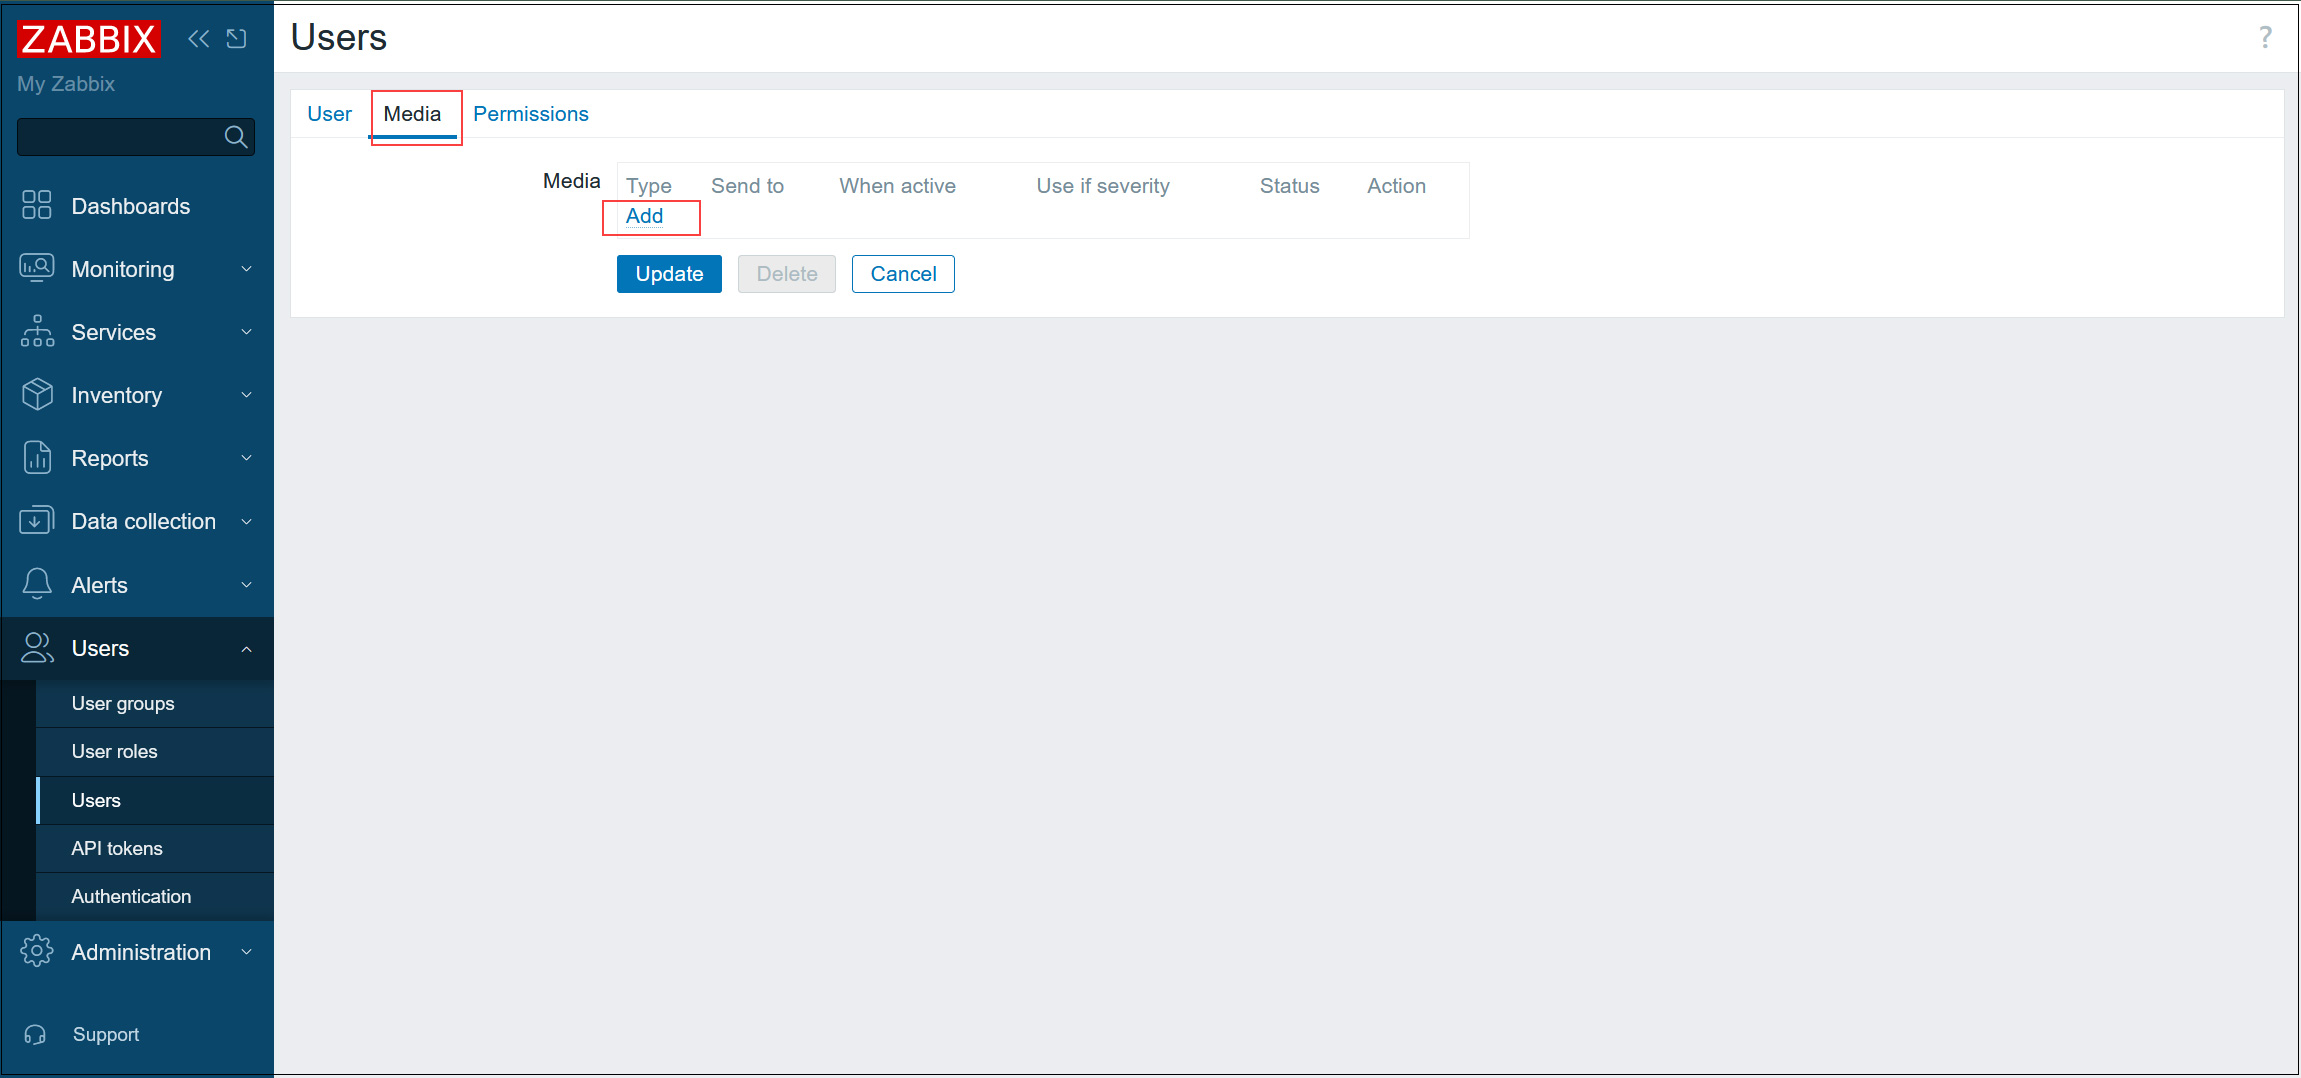
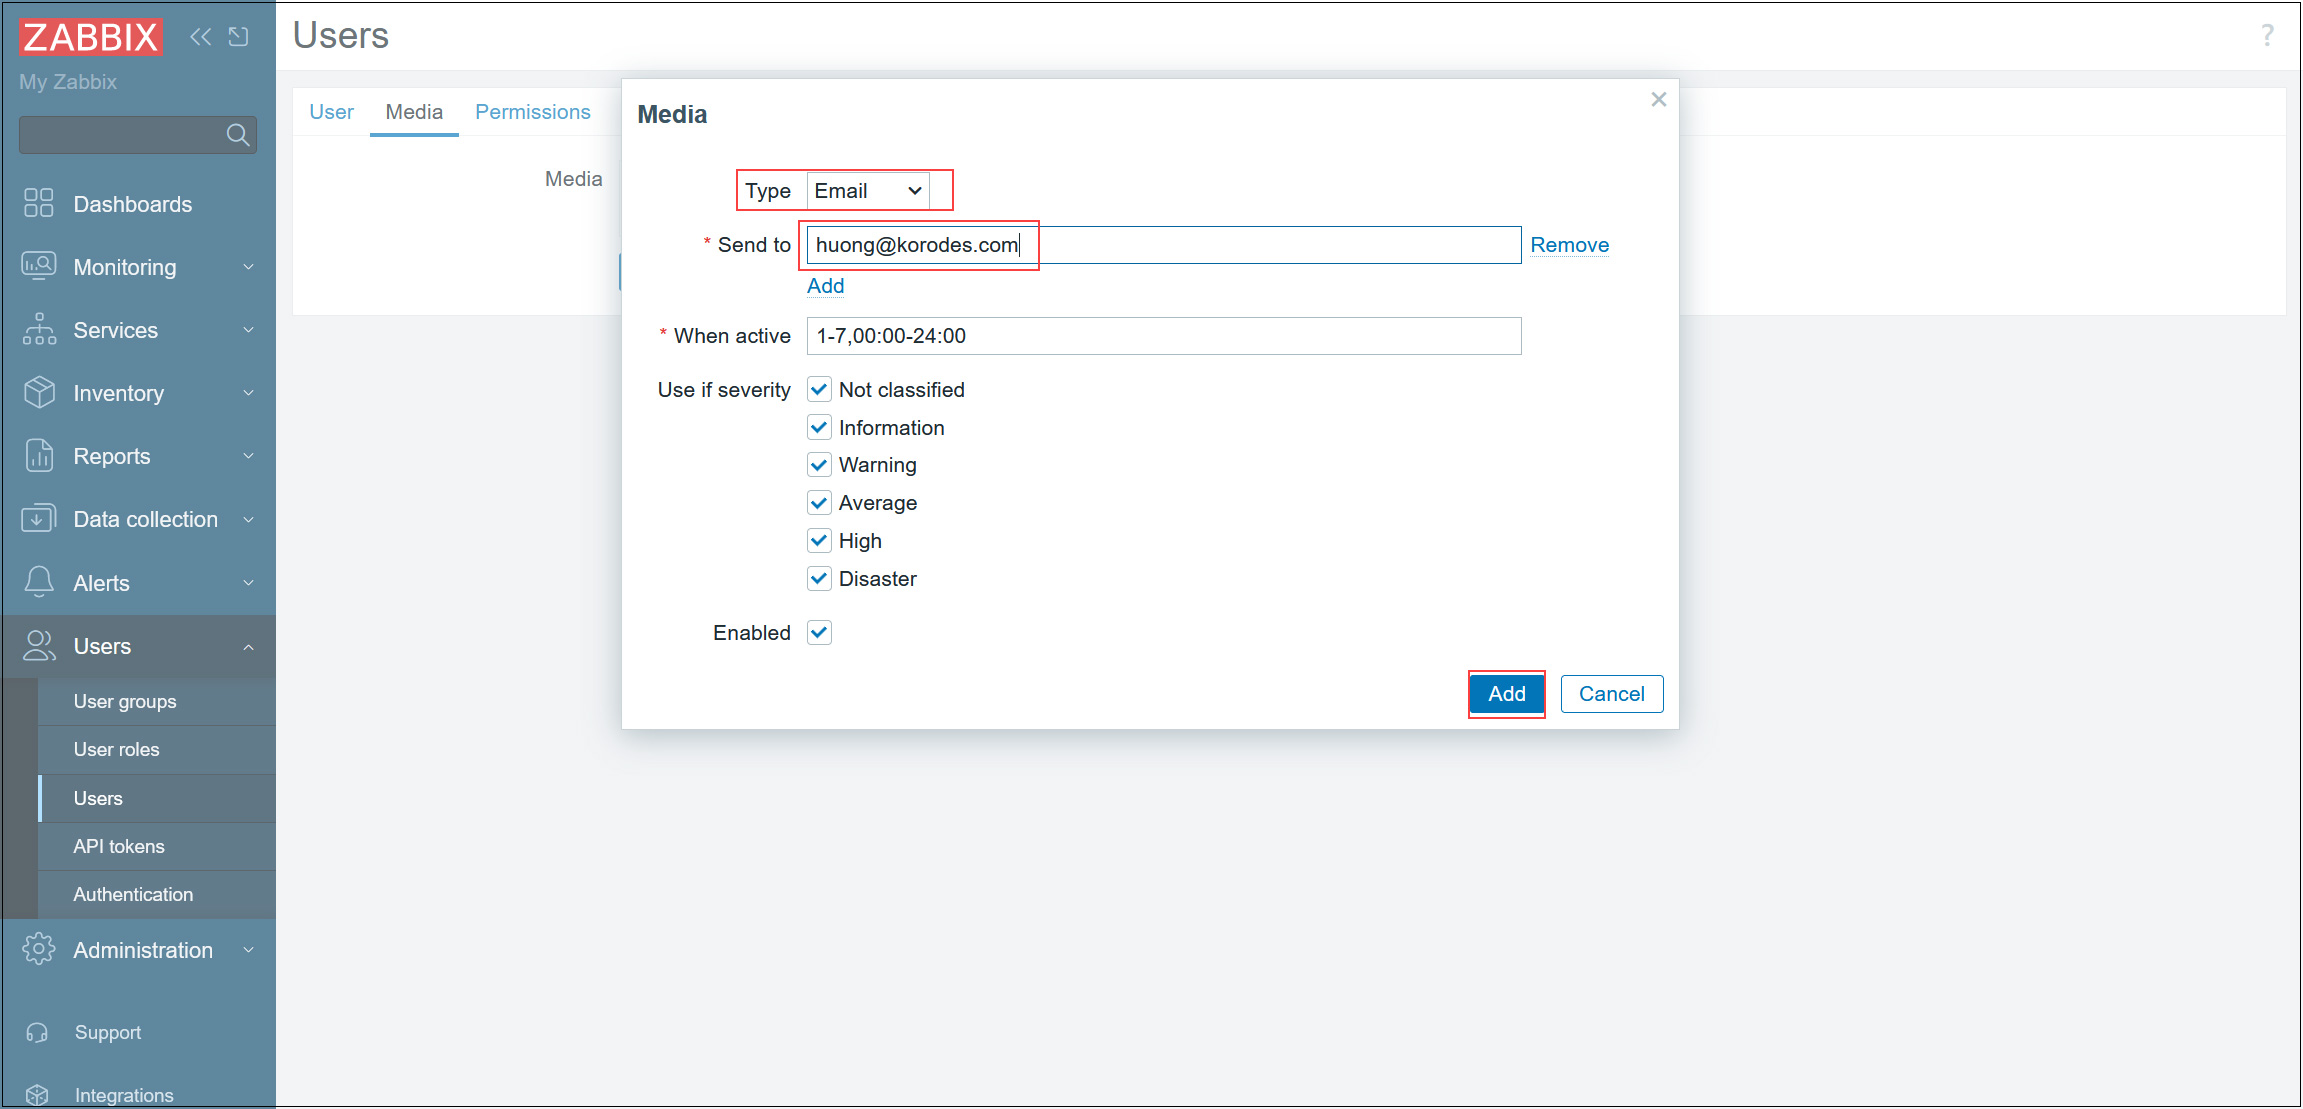
⑤[Media] タブに移動し、[Add] をクリック
⑥[Type] は [Email] を選択し、[Send to] に管理者のメールアドレスを入力し[Add] をクリック
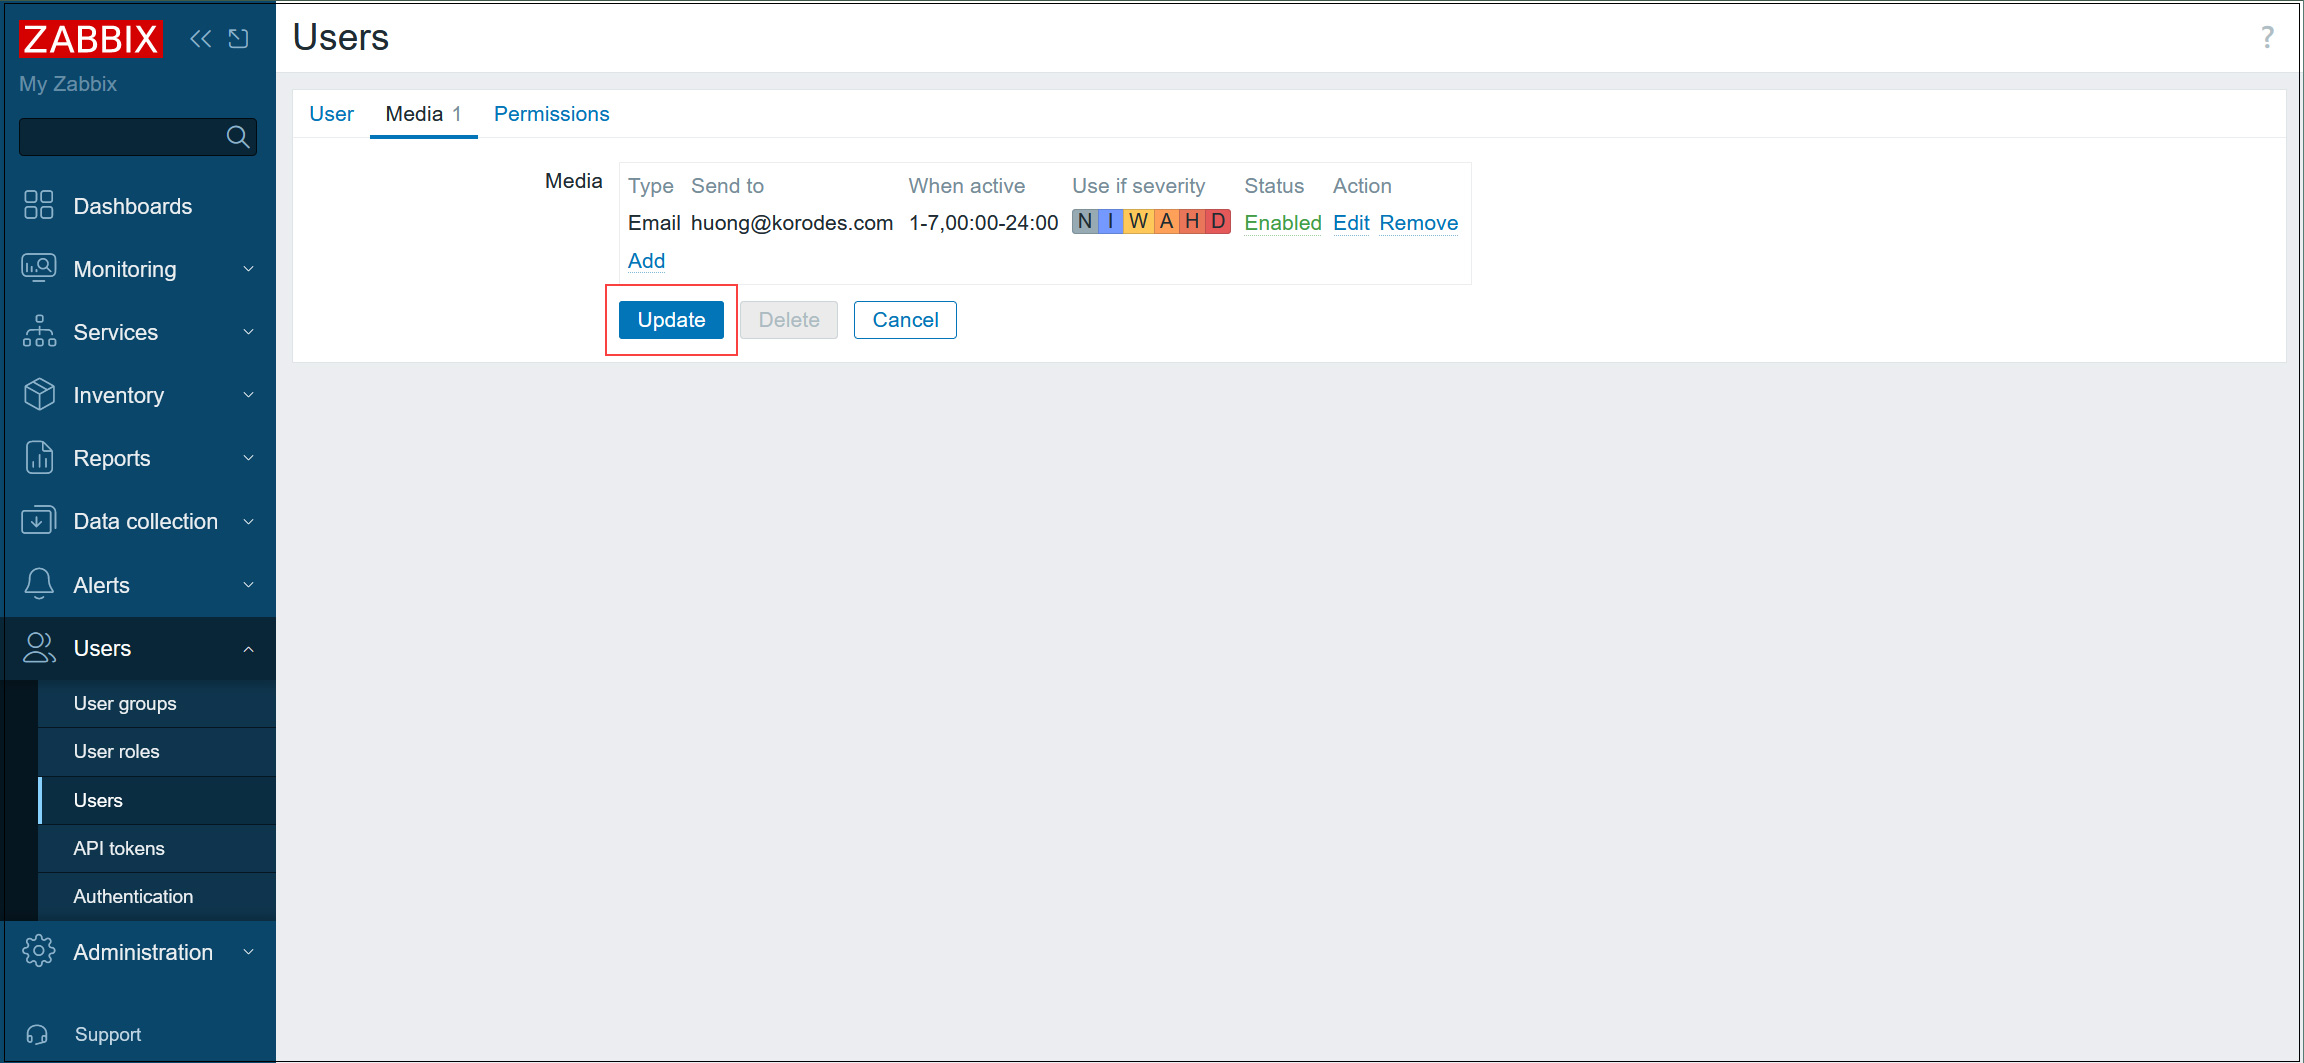
⑦[Update] ボタンをクリック
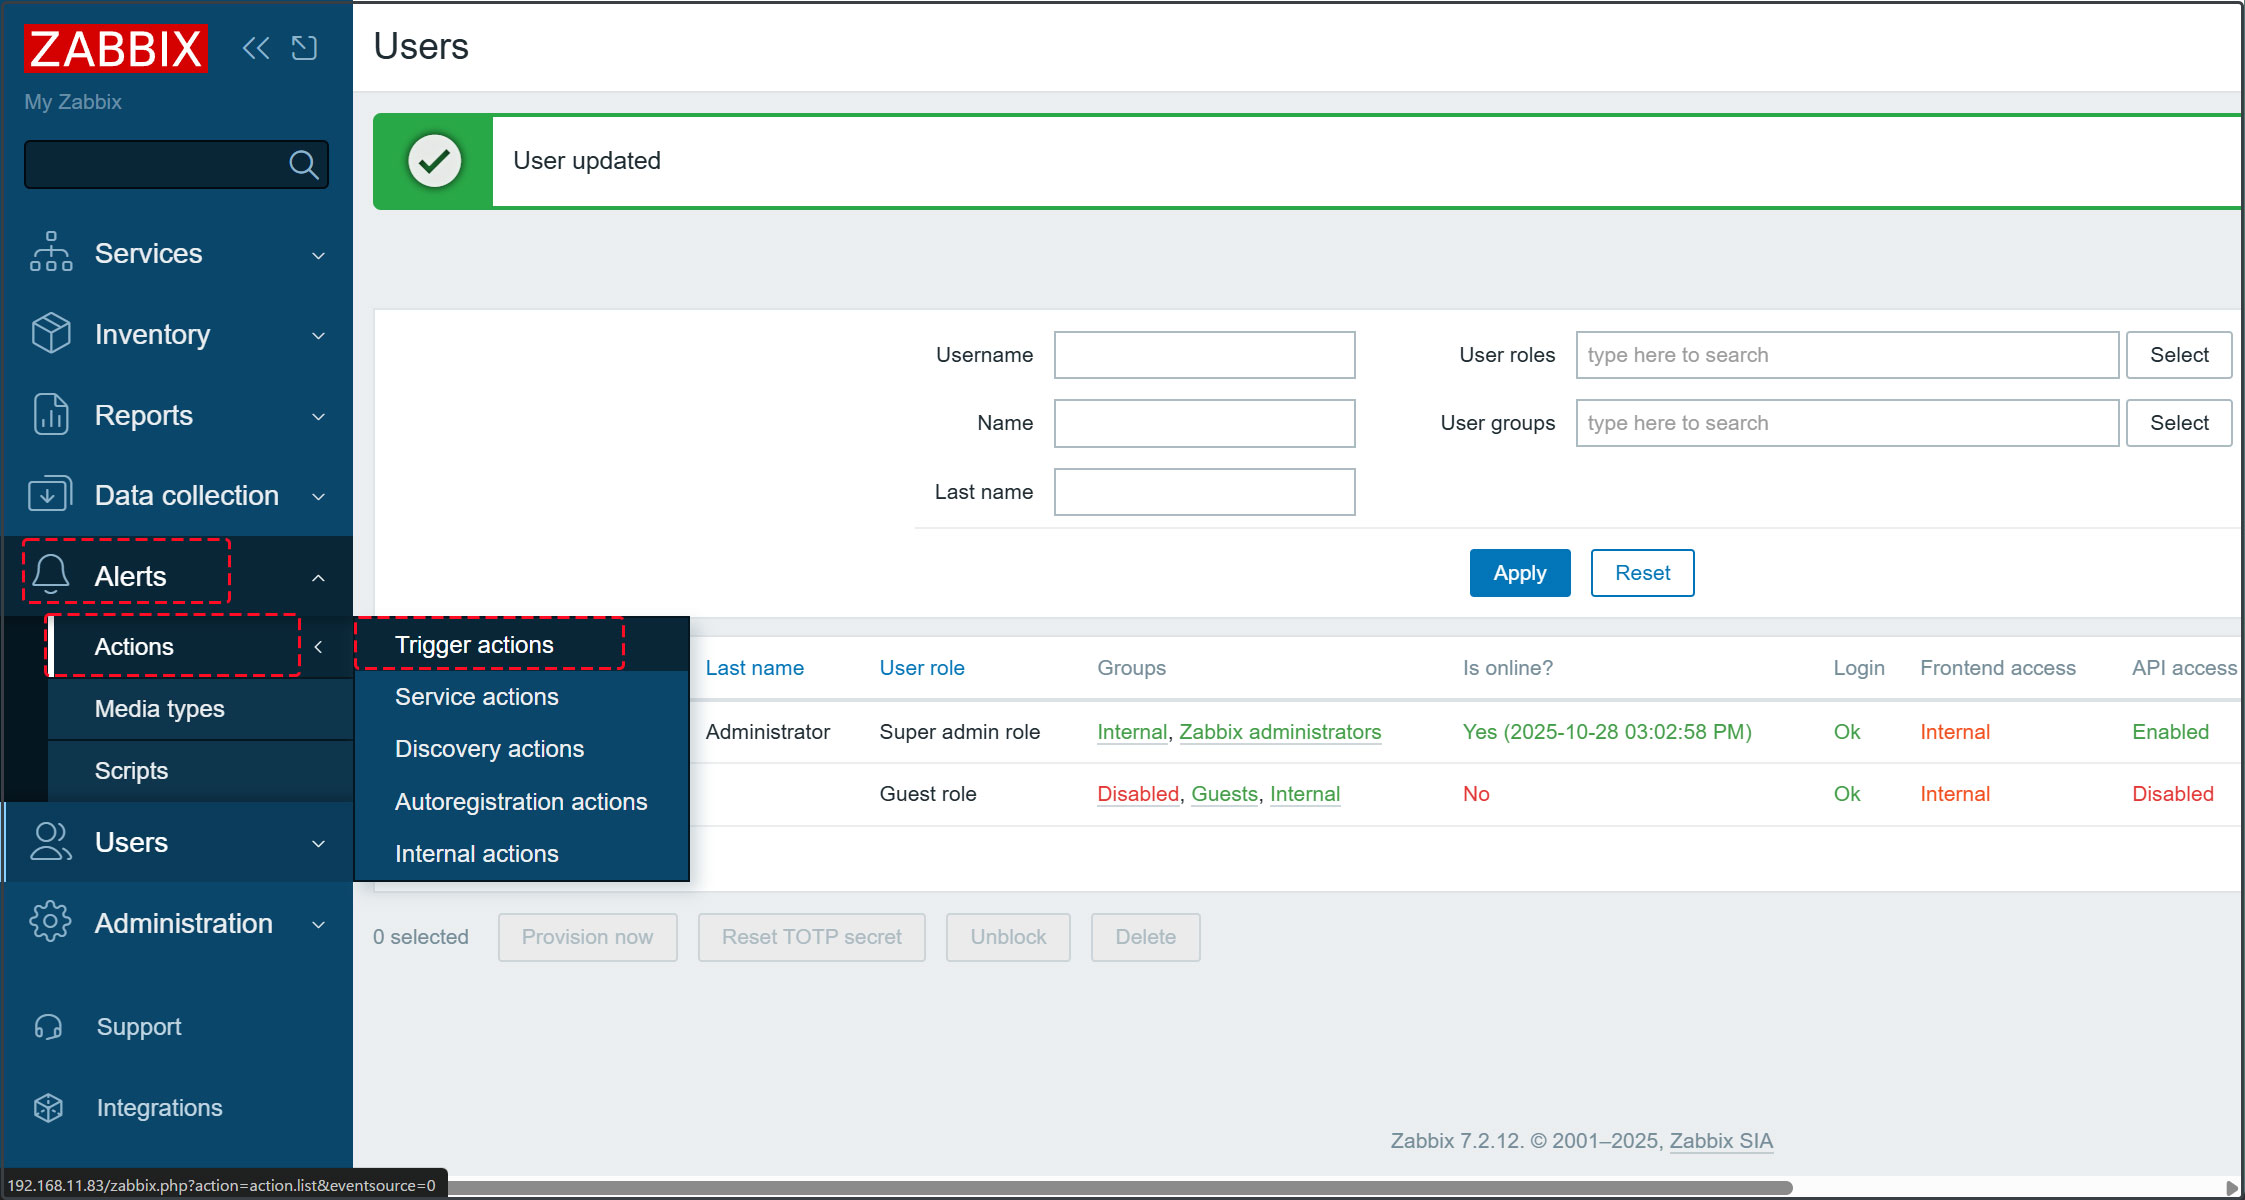
⑧左ペインで [Alerts] - [Actions] - [Trigger actions] を選択
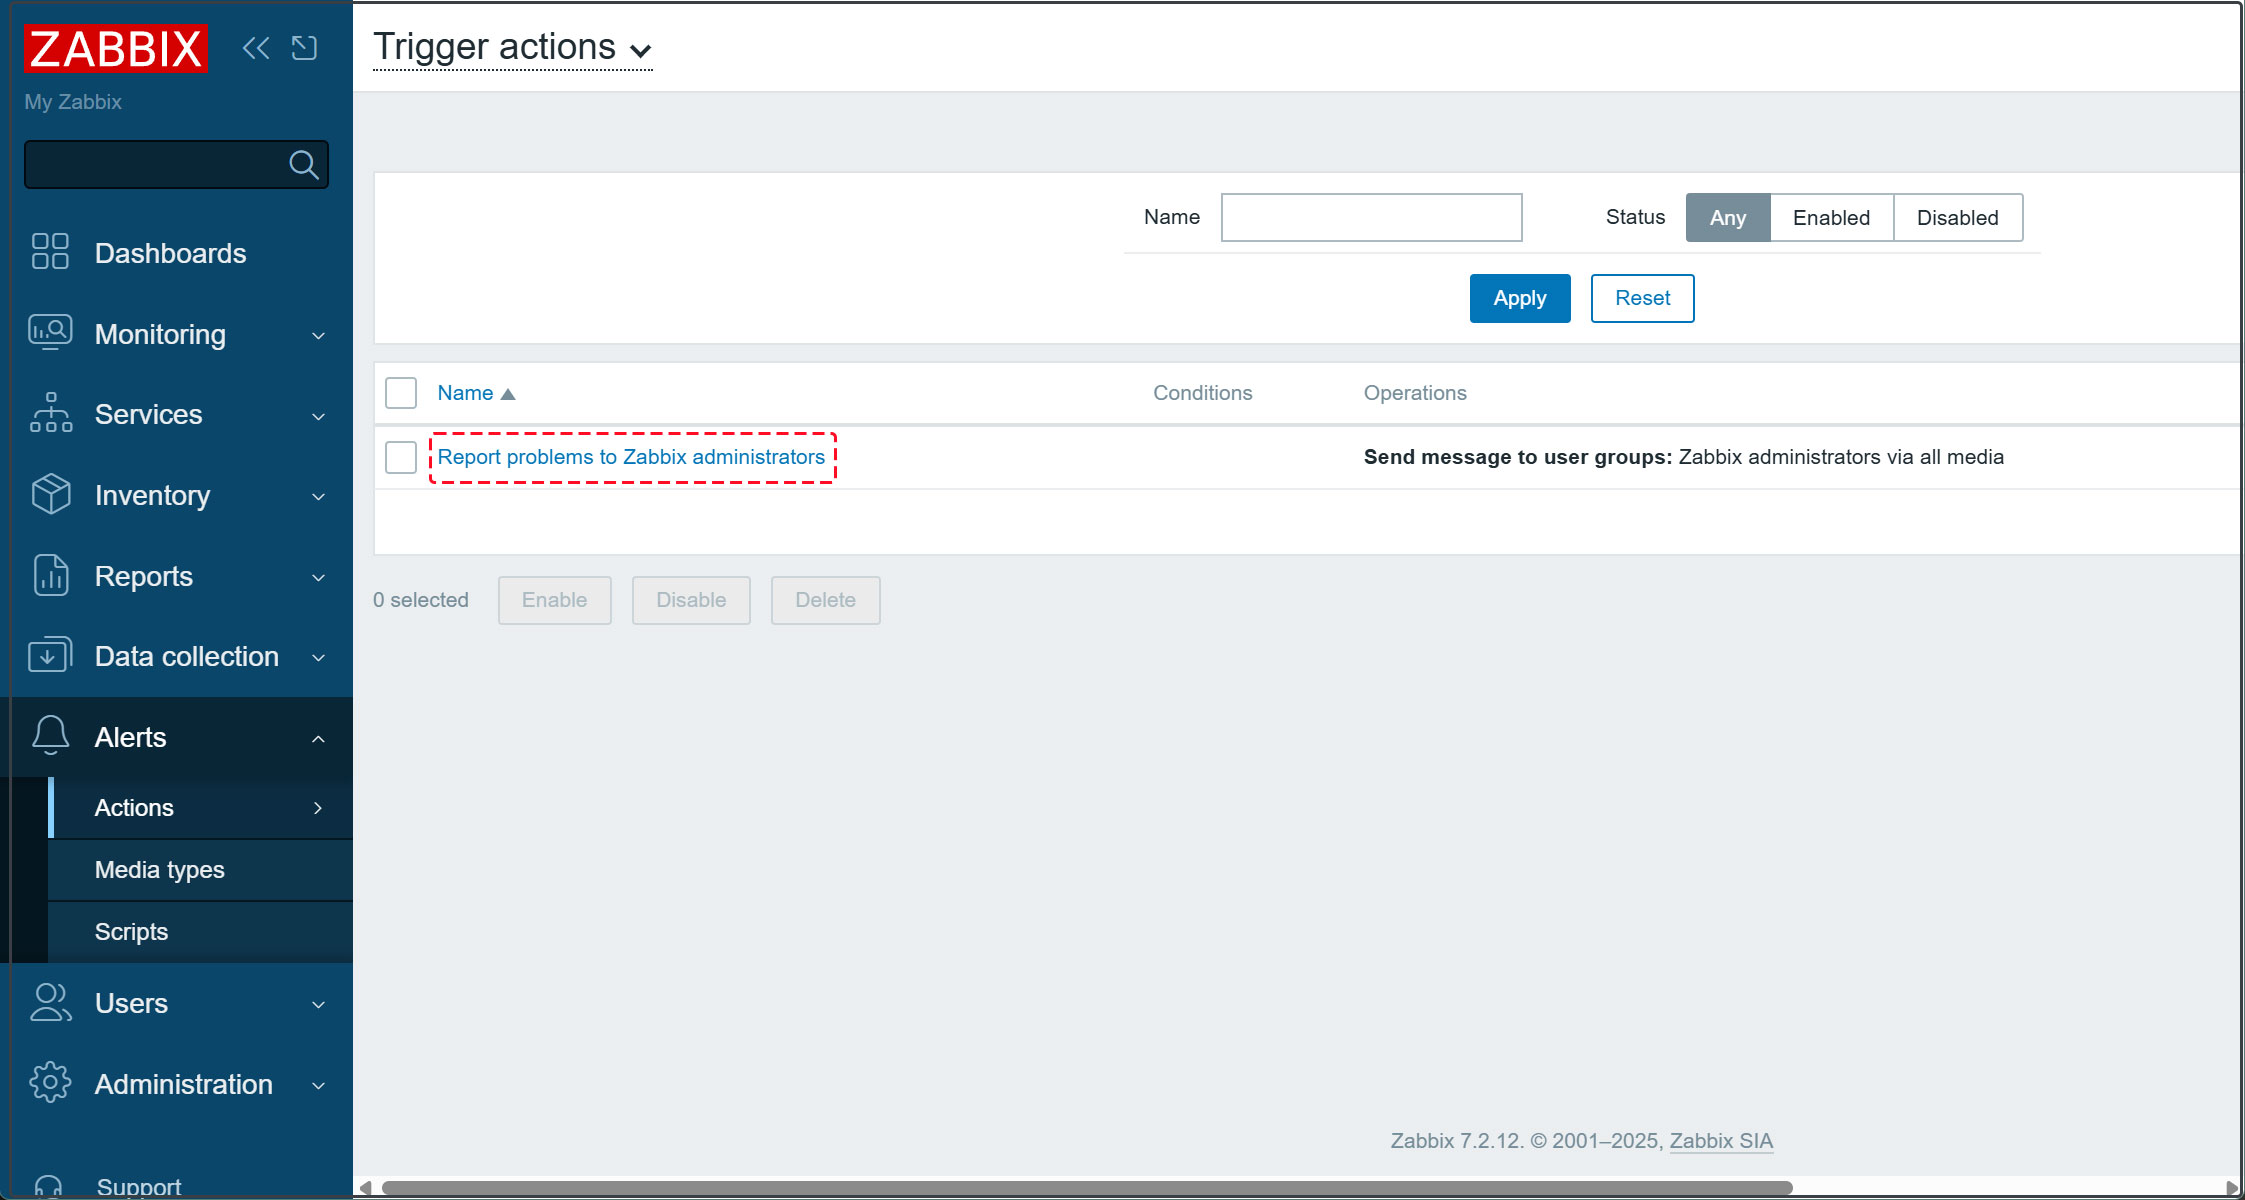
⑨右ペインで [Report problems to Zabbix administrators] をクリック
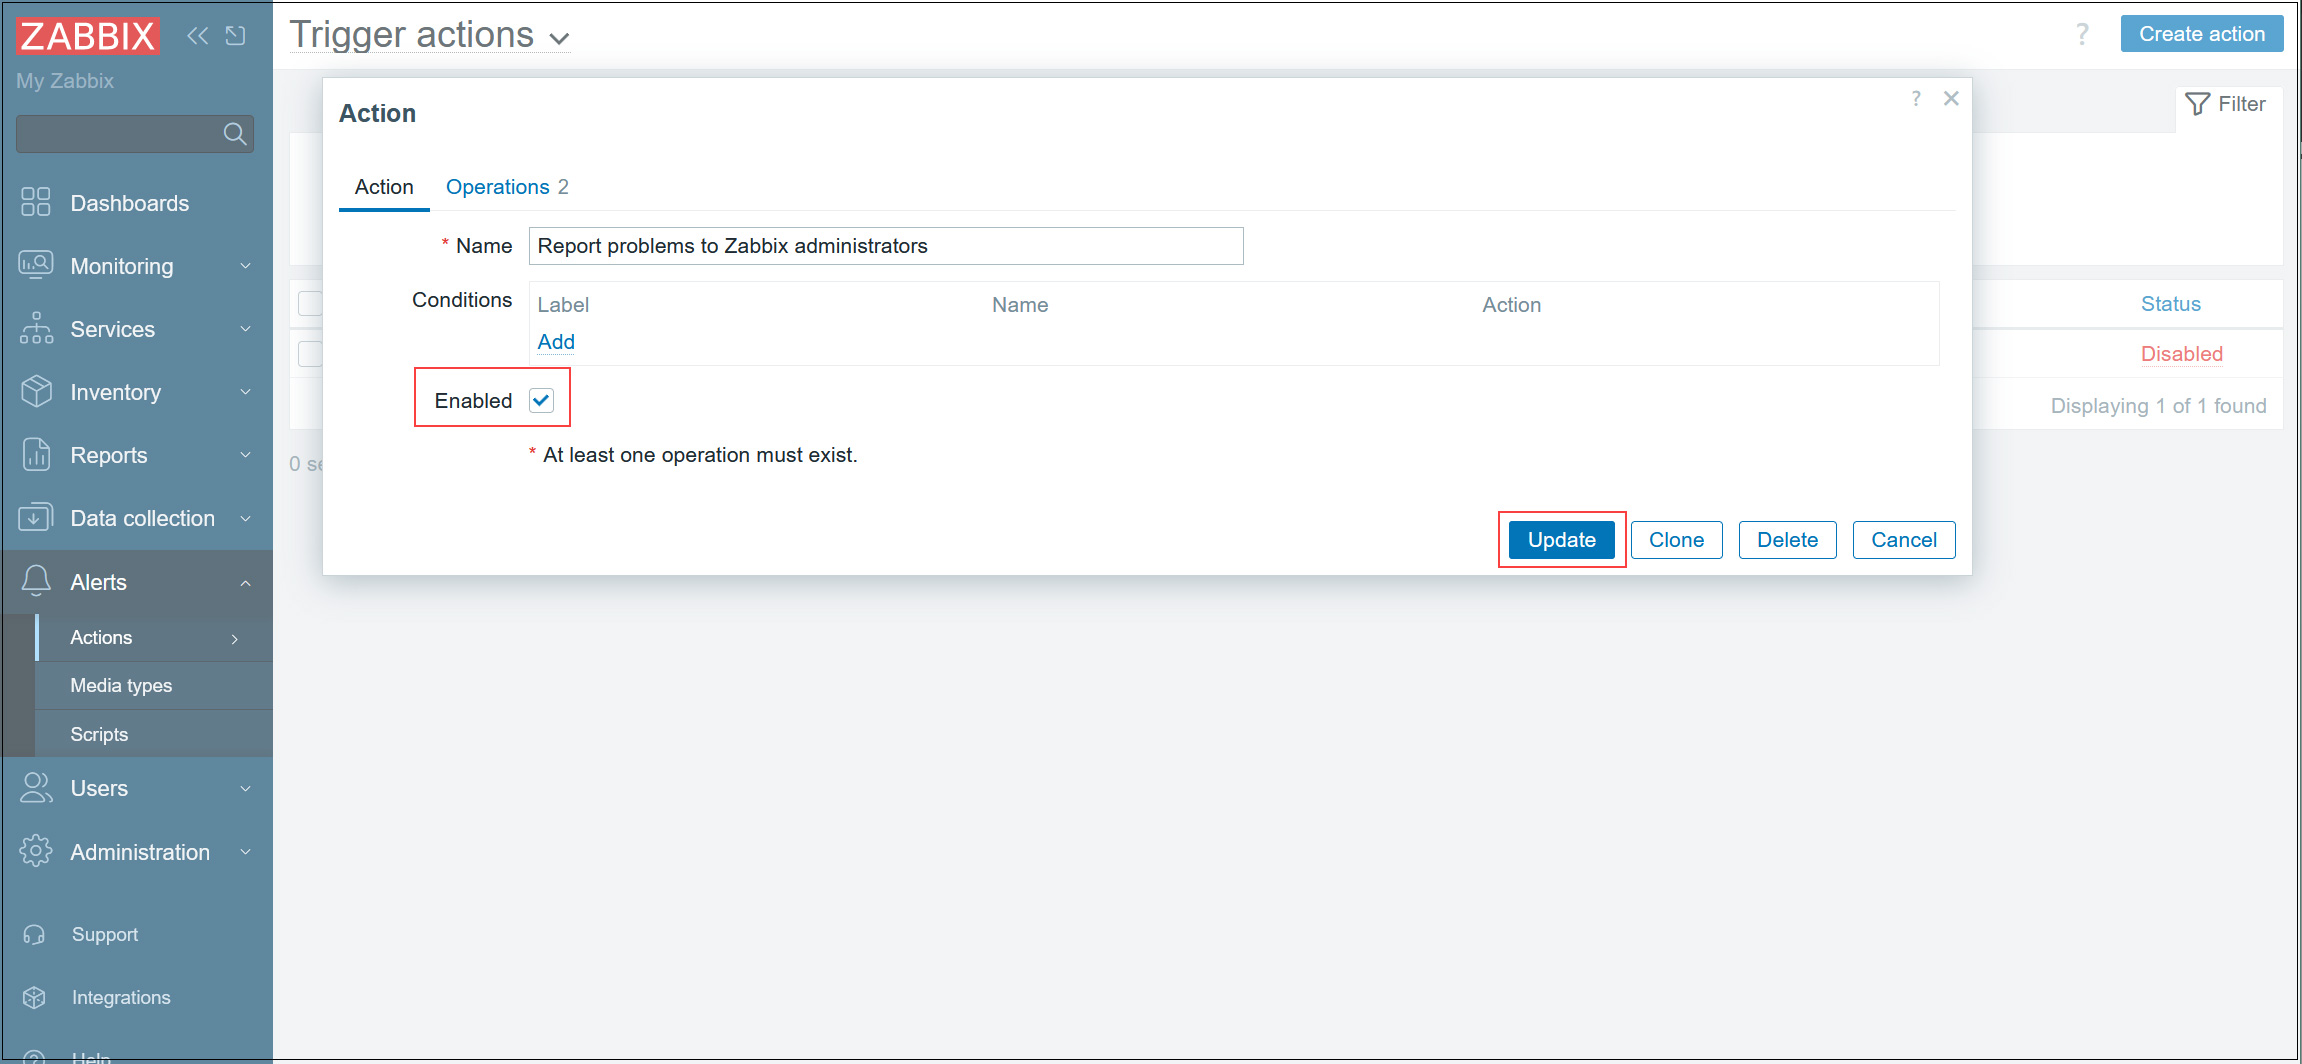
⑩[Enabled] にチェックを入れ[Update] ボタンをクリック
以上で、各種障害通知が設定したメールアドレスへ送信される
監視対象ホストを追加する
下記サーバーを対象に追加
OS : FreeBSD14.3
IPアドレス : 192.168.11.85
Host name : Lion
1.監視対象としたいサーバーでの設定
1.1 監視対象としたいサーバーに Zabbix Agent をインストール
# pkg install -y zabbix74-agent
1.2 zabbix-agent 設定ファイル編集
#  vi /usr/local/etc/zabbix74/zabbix_agentd.conf

# 113行目 : Zabbix サーバーを指定(今回は192.168.11.83)
Server=192.168.11.83
# 169行目 : Zabbix サーバーを指定(今回は192.168.11.83)
ServerActive=192.168.11.83
# 178行目 : 自身のホスト名に変更(今回はLion)
Hostname=Lion
# service zabbix_agentd enable
zabbix_agentd enabled in /etc/rc.conf
# service zabbix_agentd start
1.3 Zabbix-agent側のファイアウォールを設定
Zabbixポート10050(Zabbixサーバー側)および10051(zabbix agent側)を許可する必要があります。(xxx,***は他と重複しないナンバーを指定する)
# vi /usr/local/etc/ipfw.rules

$IPF xxx allow tcp from any to any 10050 in
$IPF xxx allow tcp from any to any 10050 out

$IPF *** allow tcp from any to any 10051 in
$IPF *** allow tcp from any to any 10051 out
# service ipfw restart
2. Zabbix WEB UIでの設定
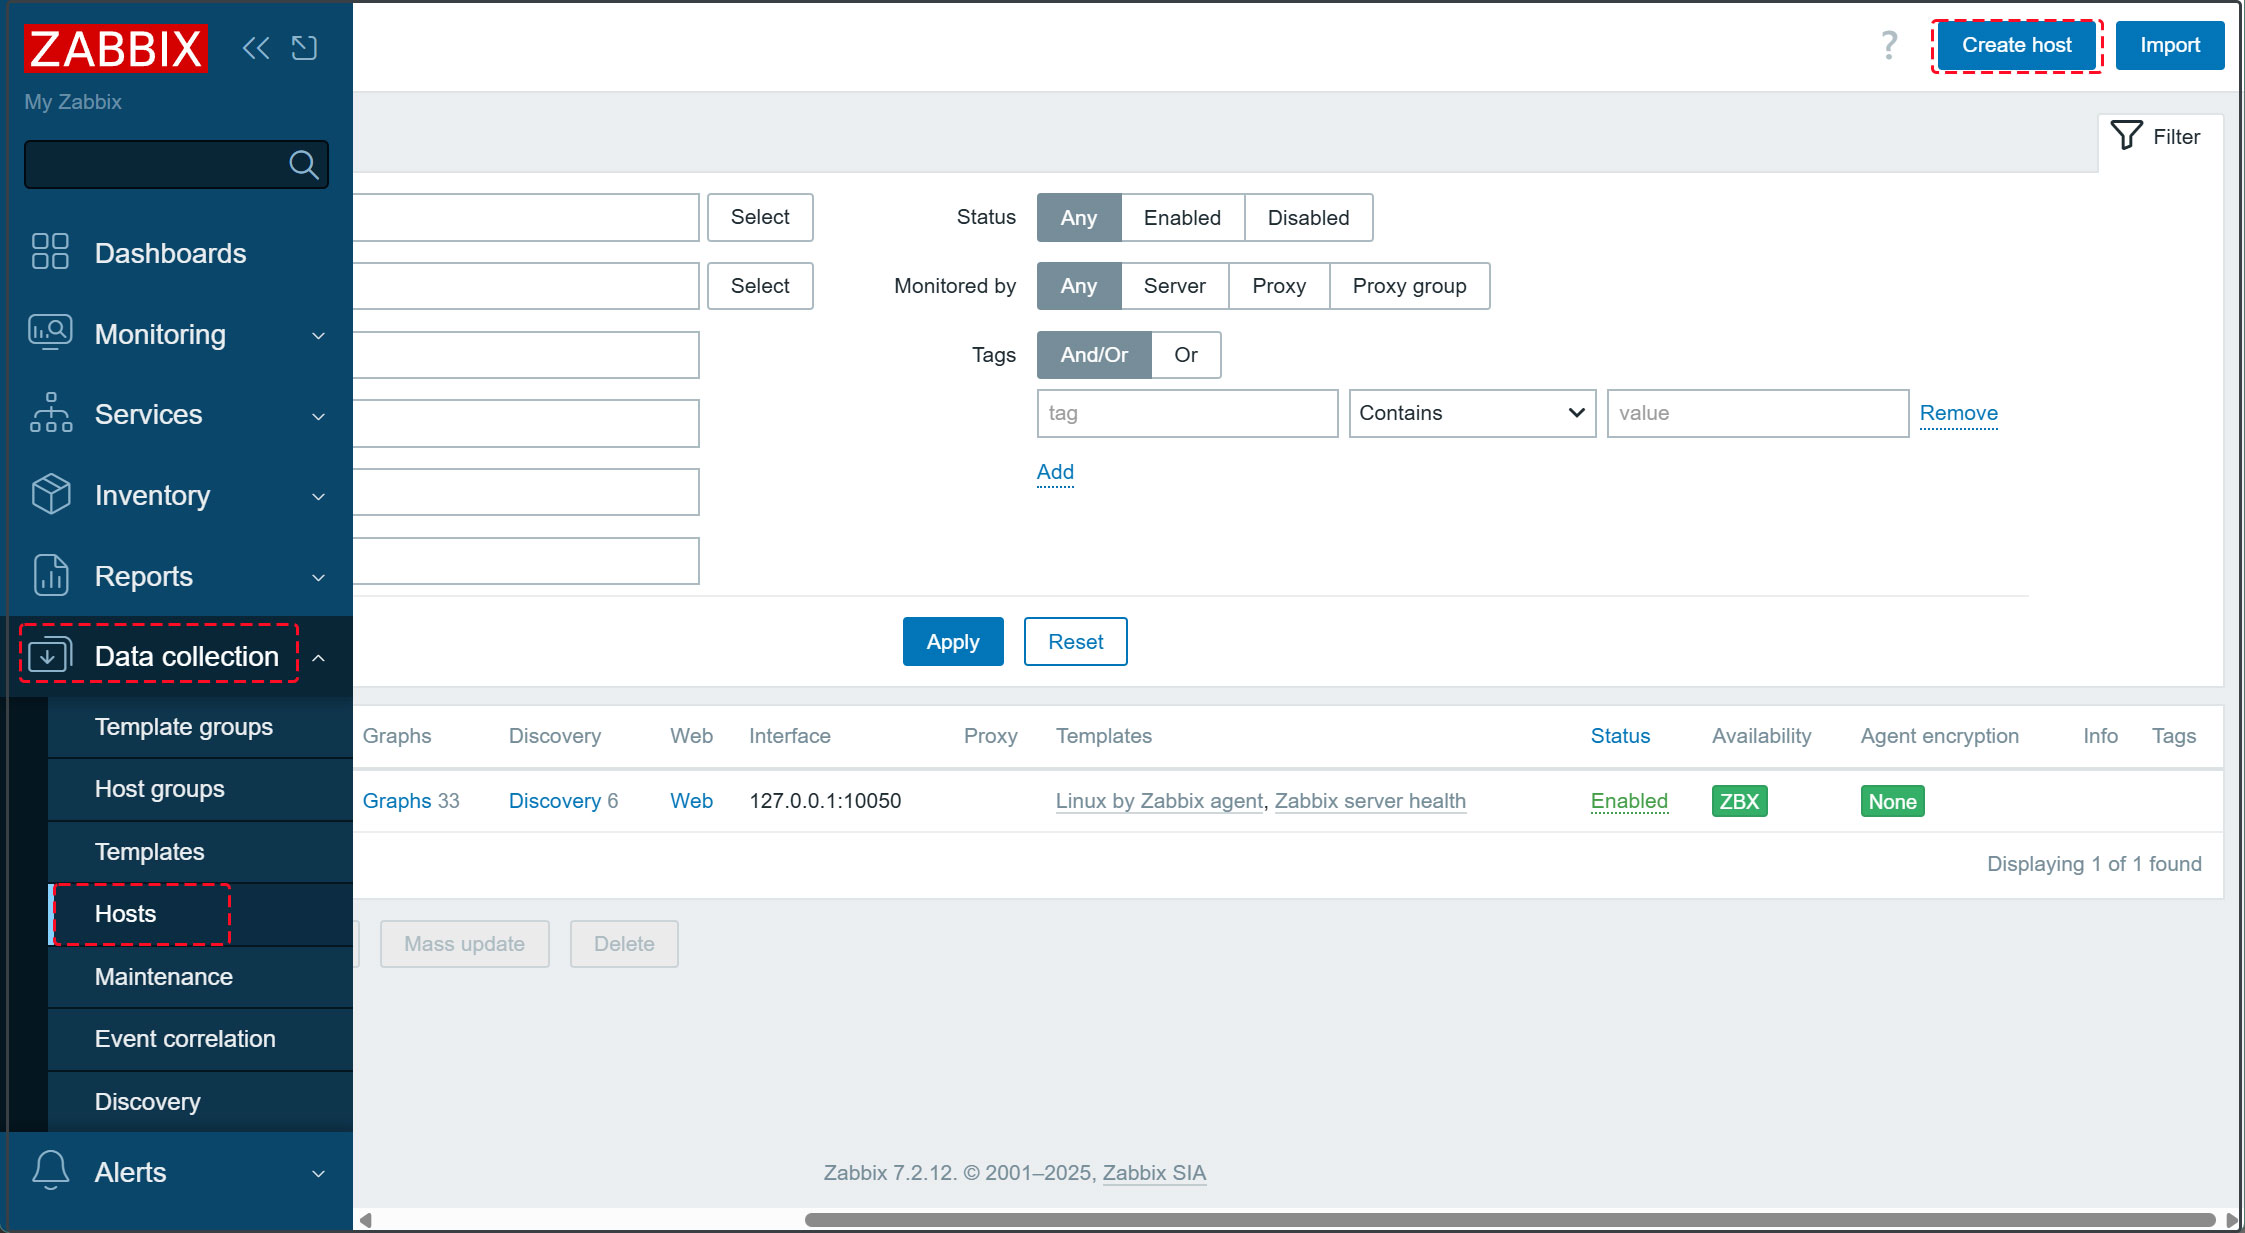
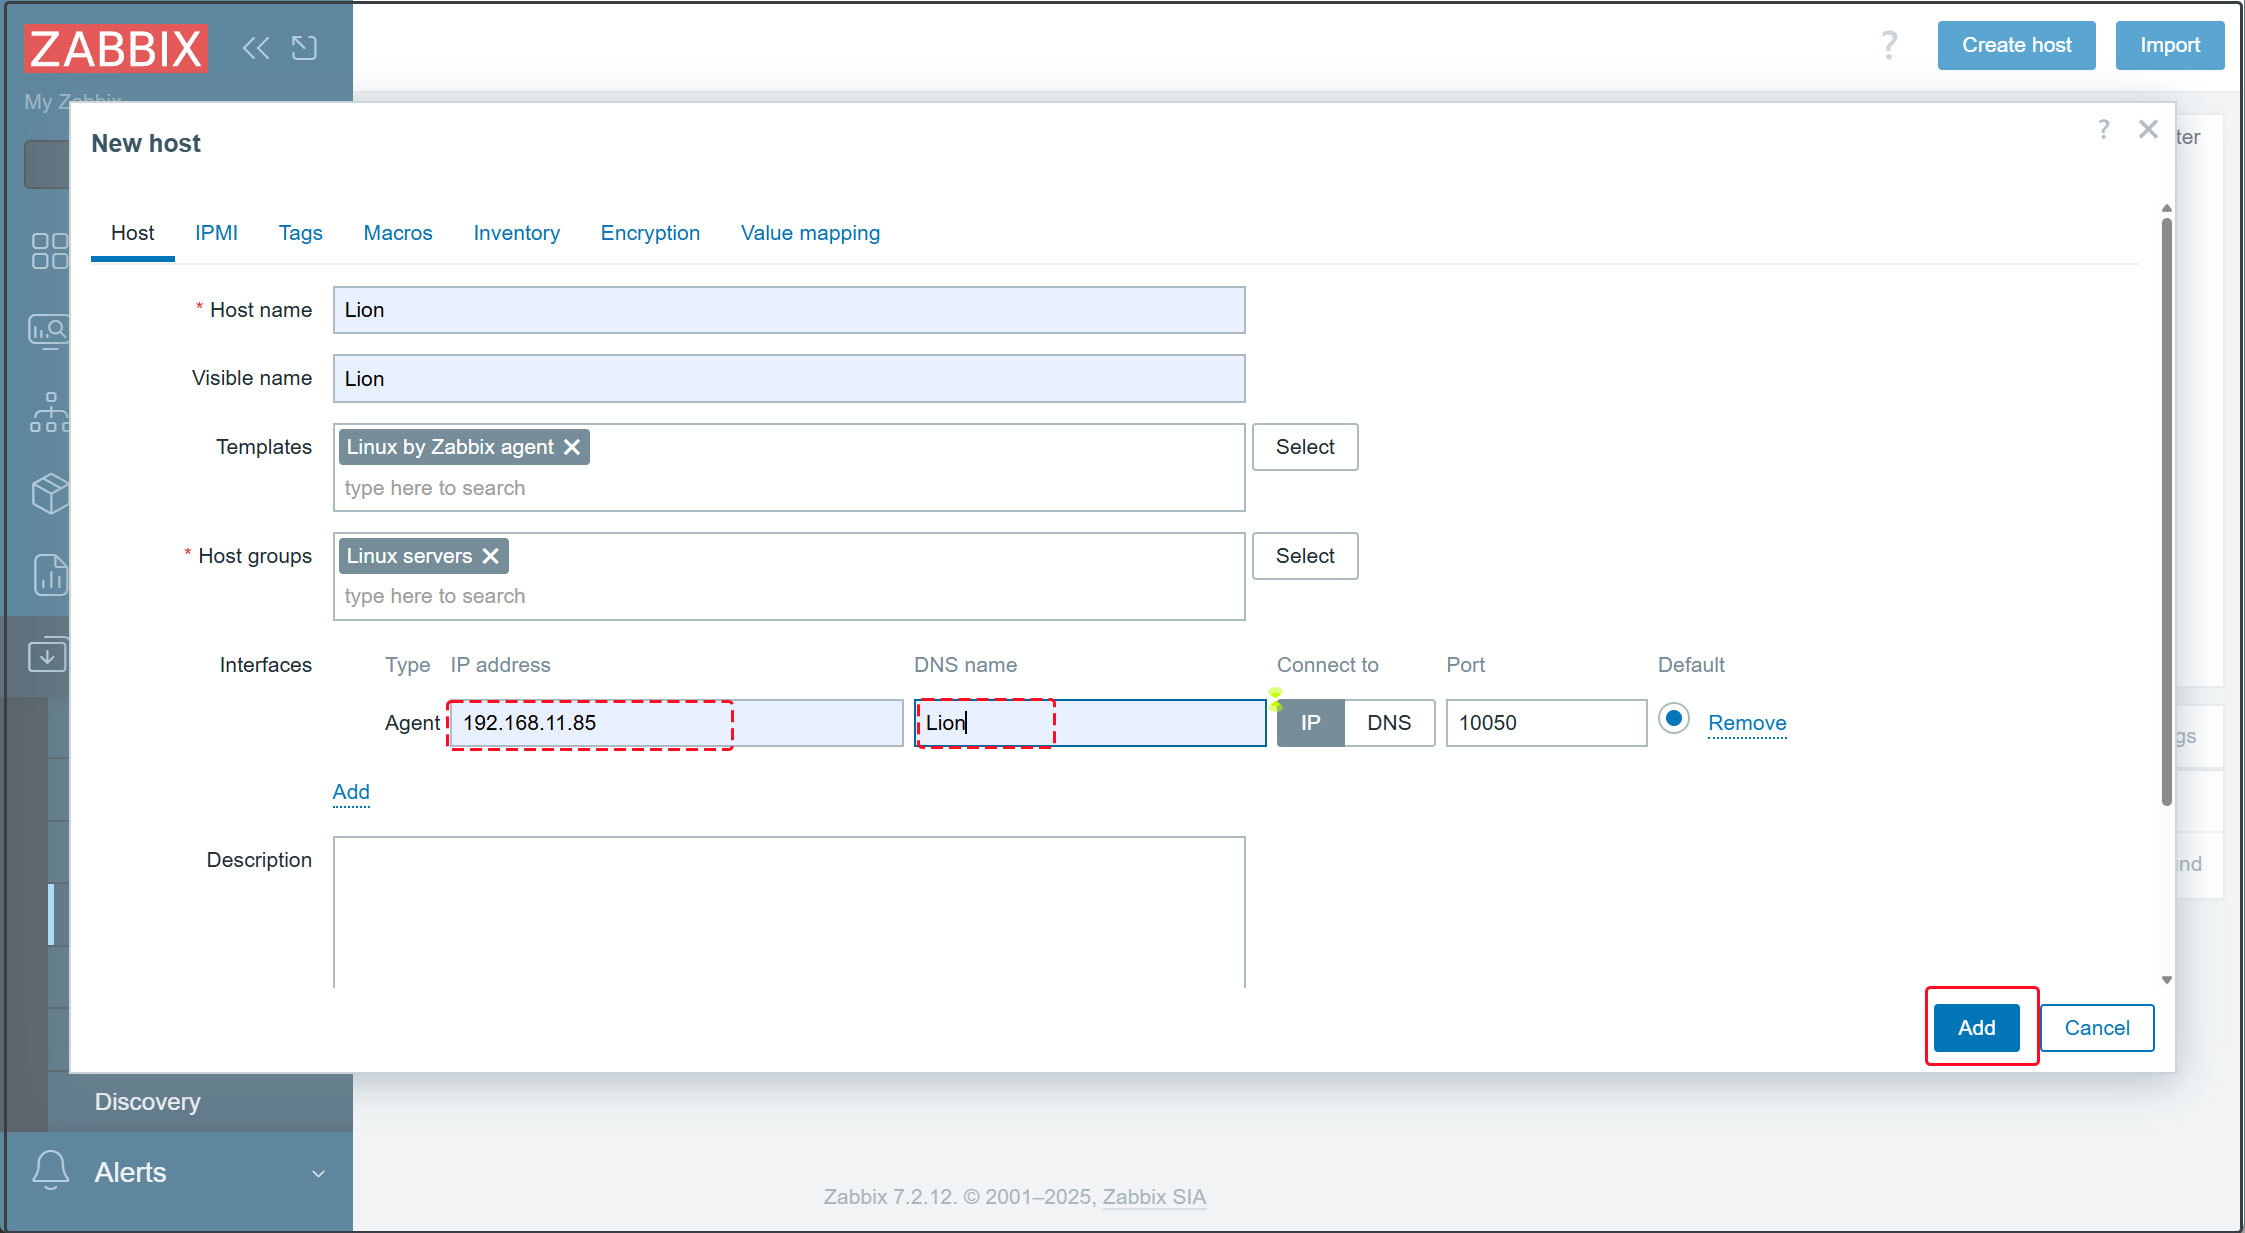
2.1 Zabbix の管理サイトにログインし、左ペインで [Datacollection] - [Hosts] を選択し、右ペイン上部の [Create Host] ボタンをクリック
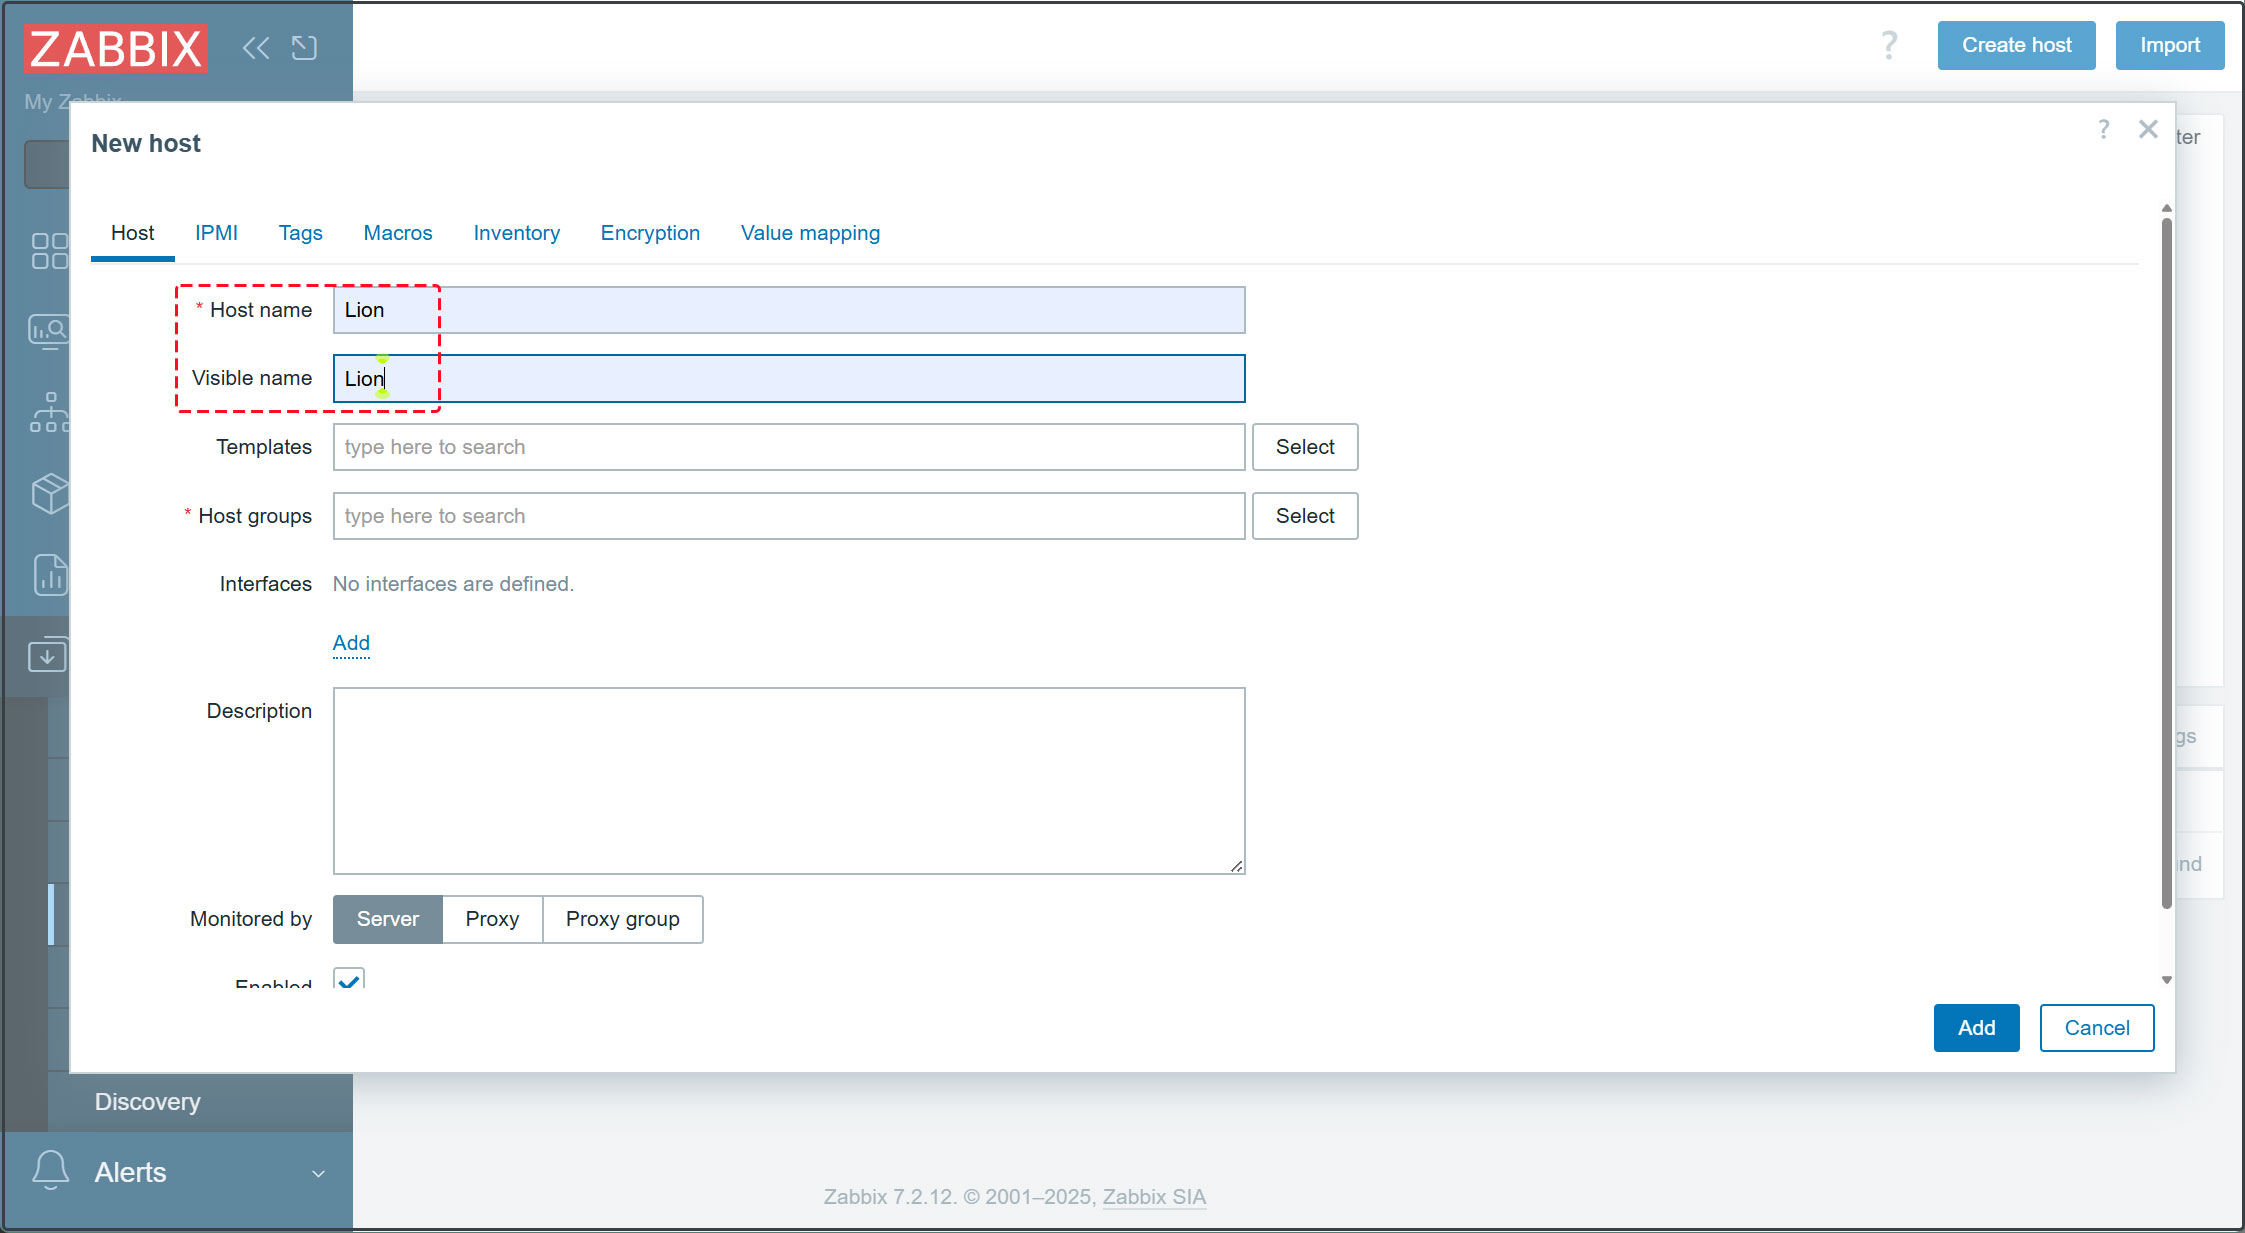
2.2 [Hostname] にはホスト名、[Visible name](表示される名前)にもホスト名を入力(今回はLion)
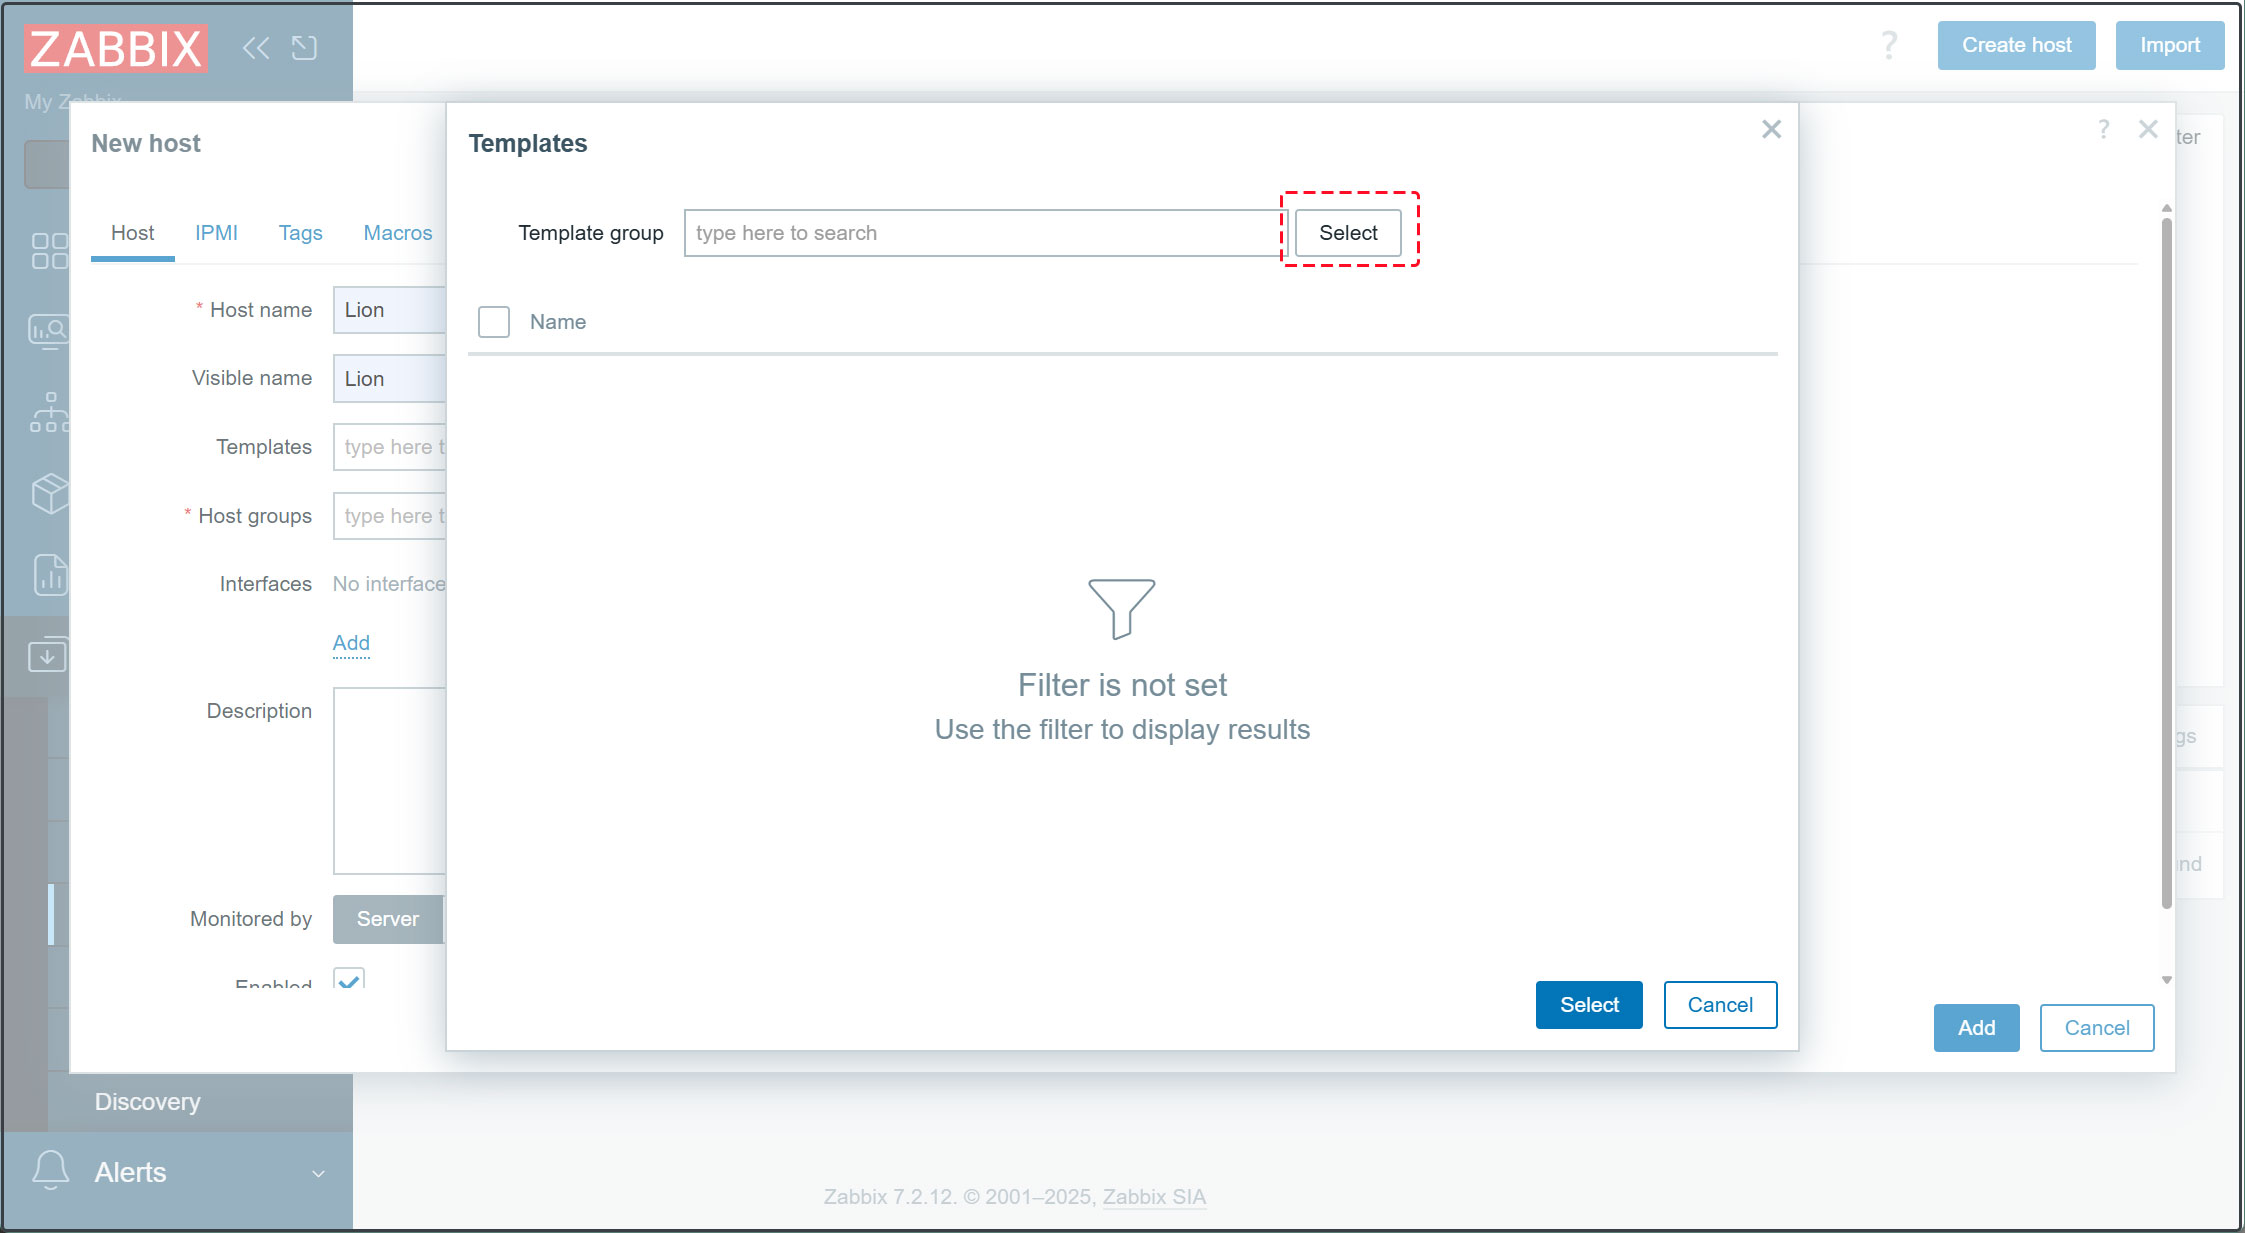
2.3 [Templates] は、[Select] ボタンをクリックし、[Templates]をクリックし、監視テンプレートのリストの中から Linux OS で CPU 等の一般的な項目を監視する場合は、[Linux by Zabbix agent] を選択
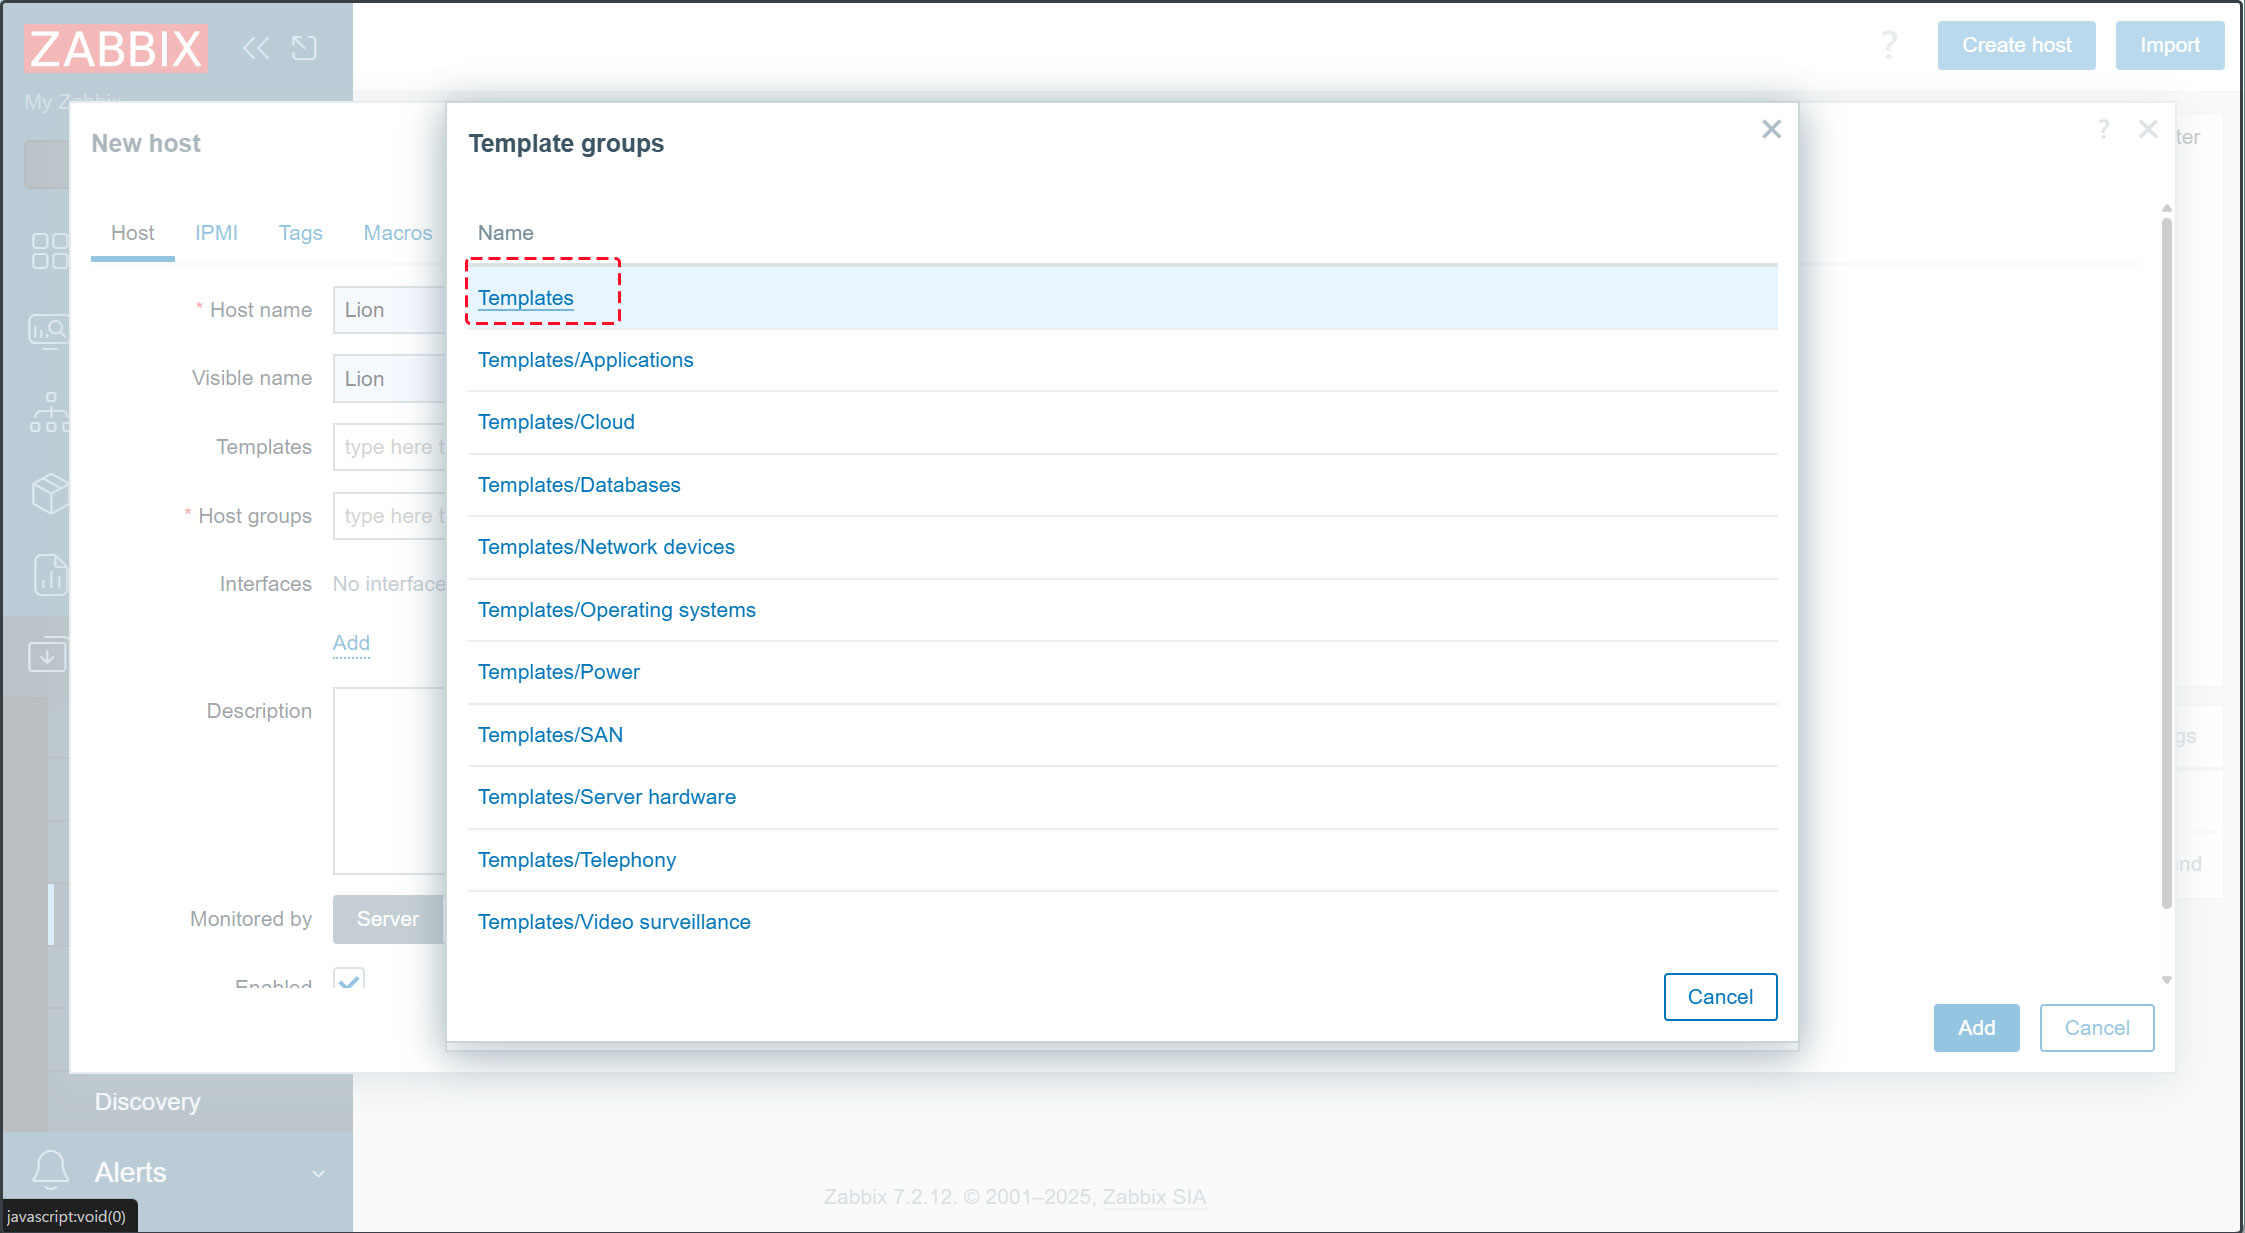
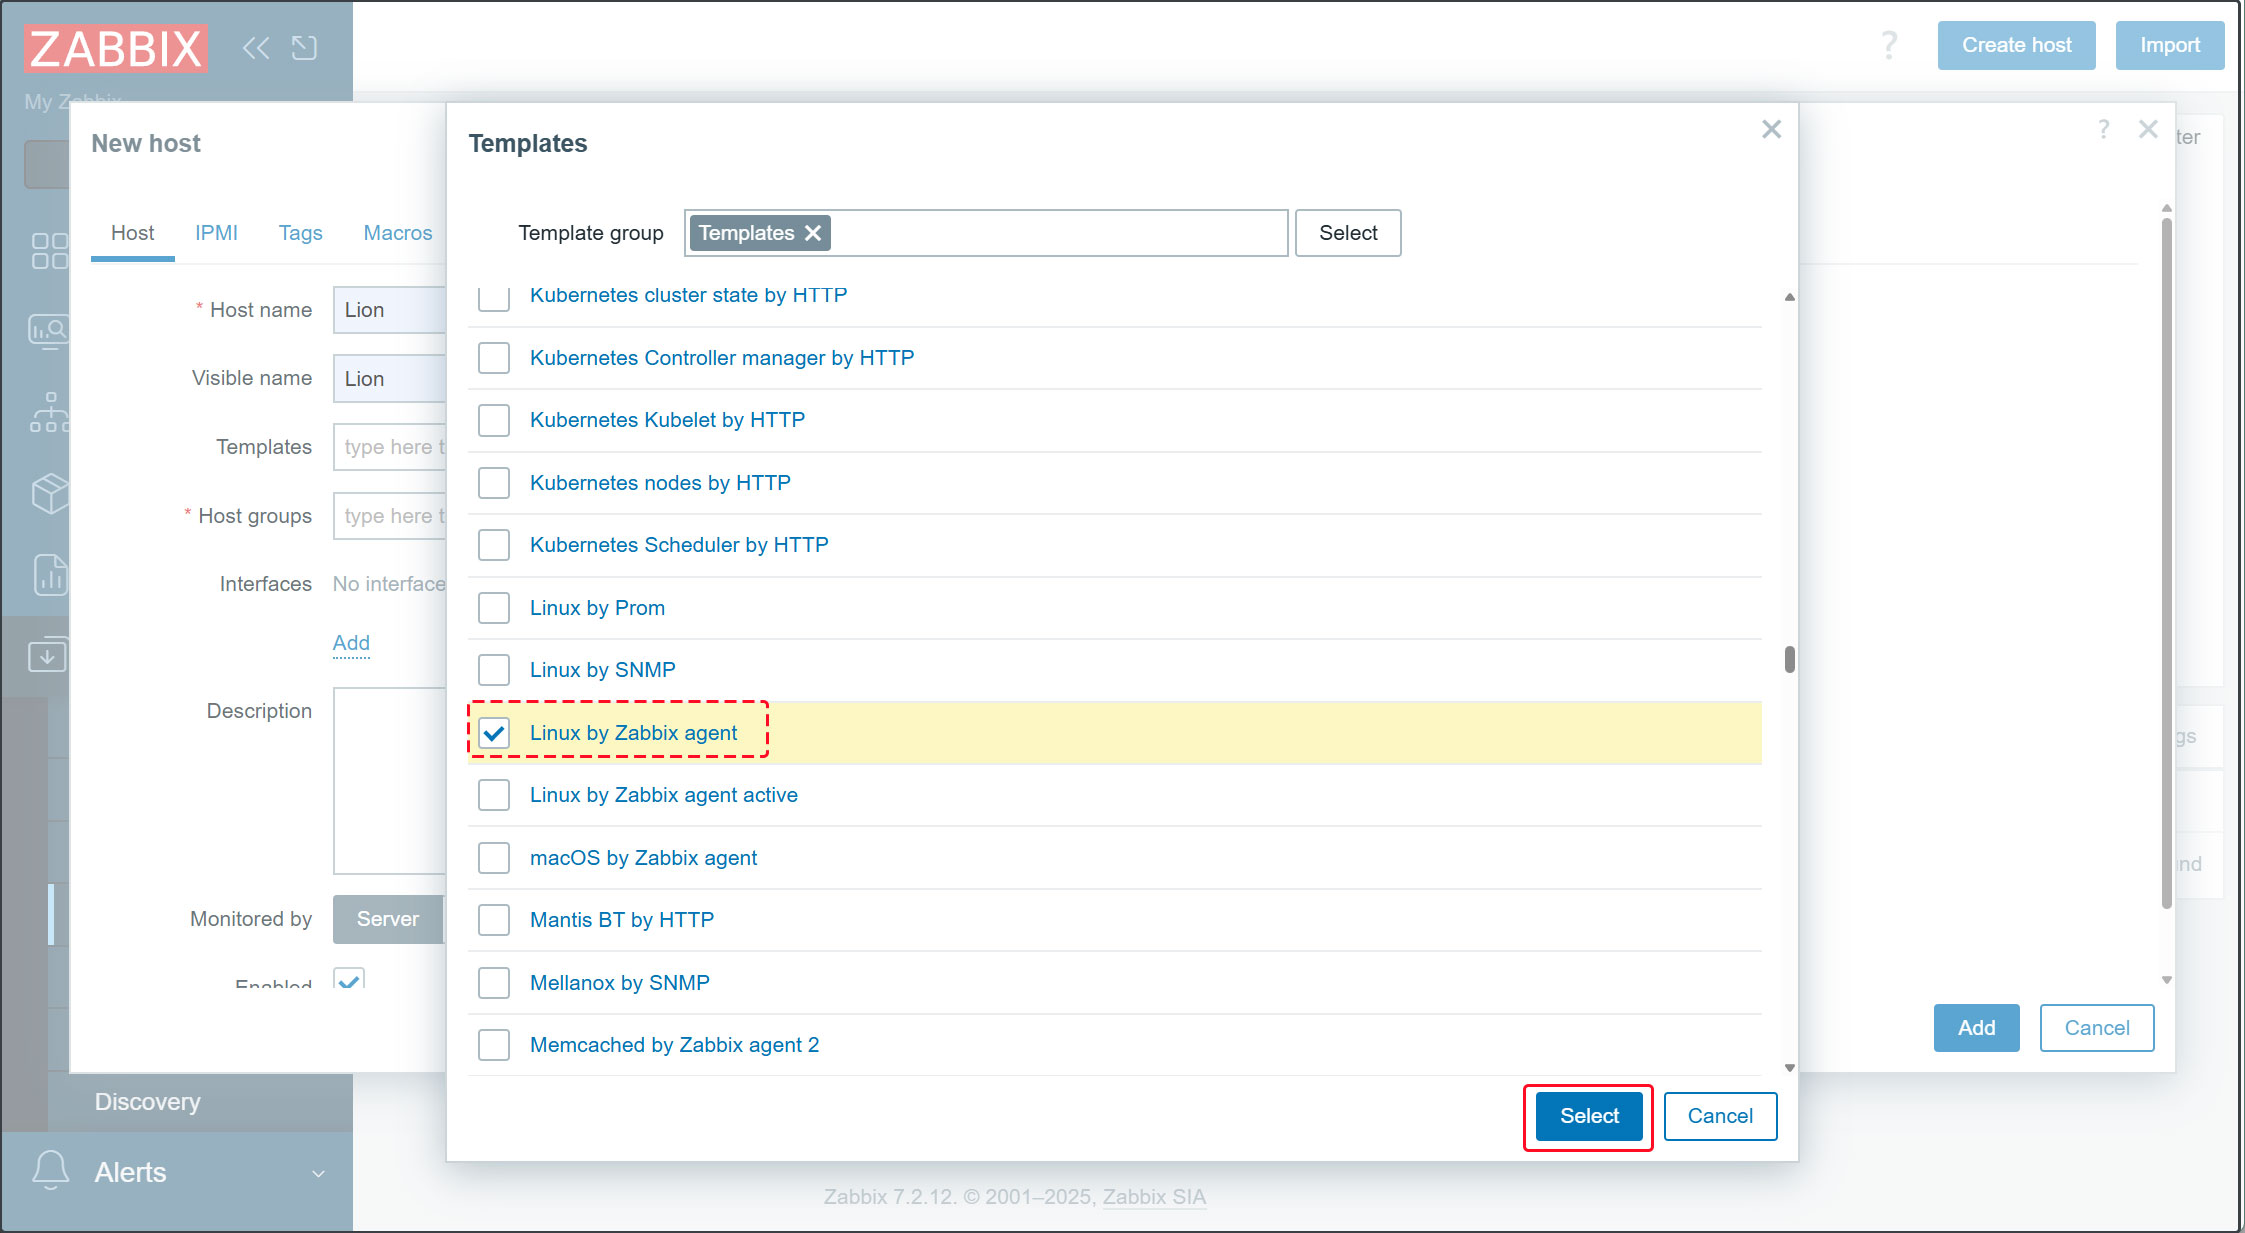
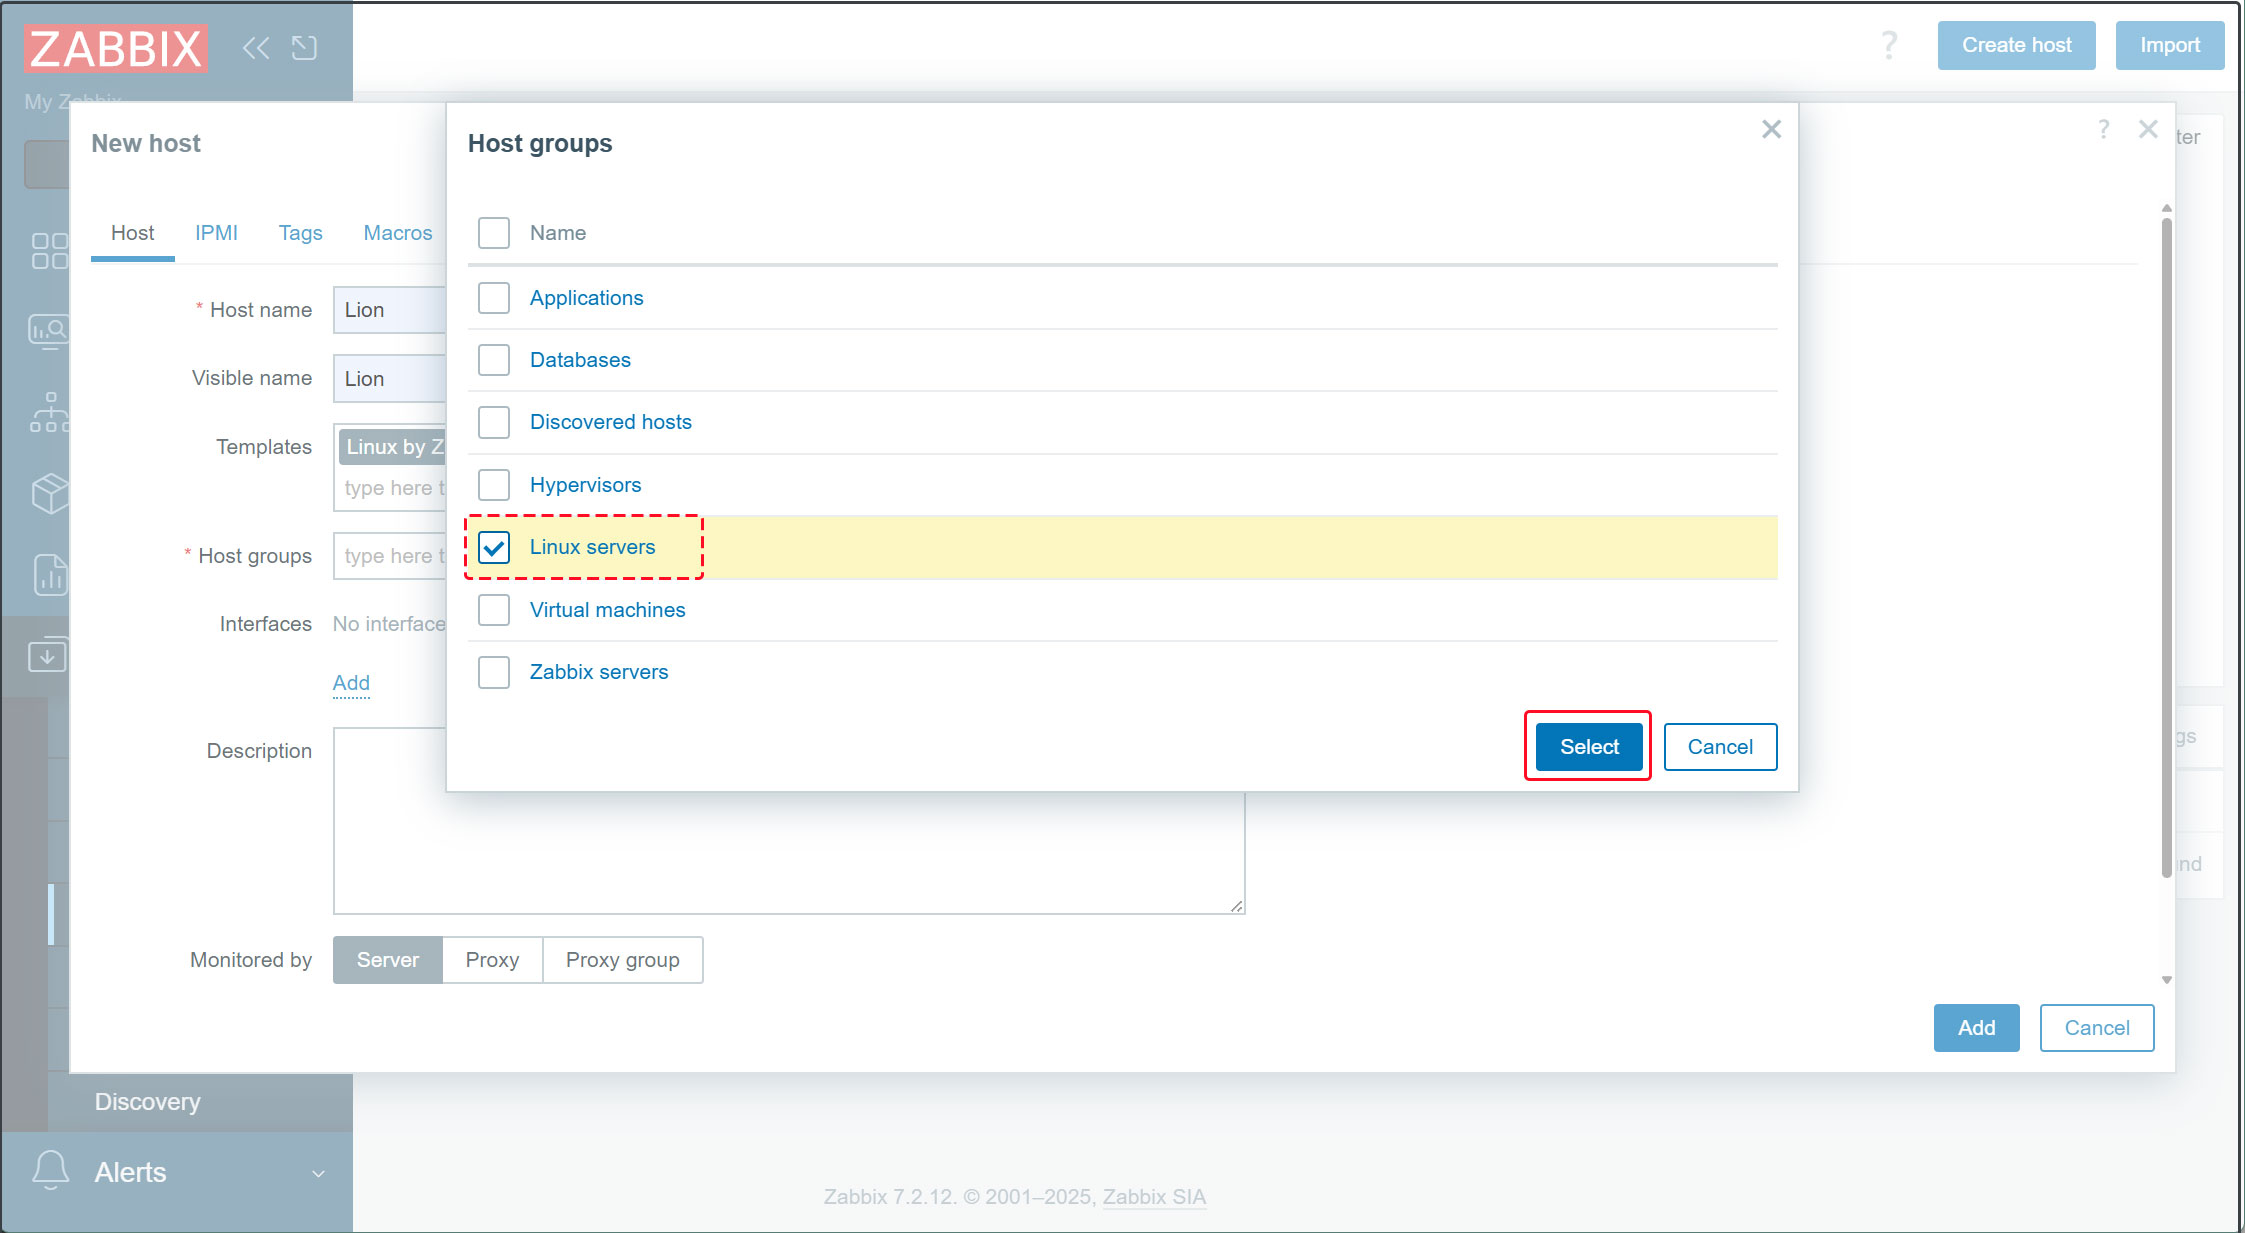
2.4 [Host groups] には[Linux servers]を選択し、[Select]をクリック
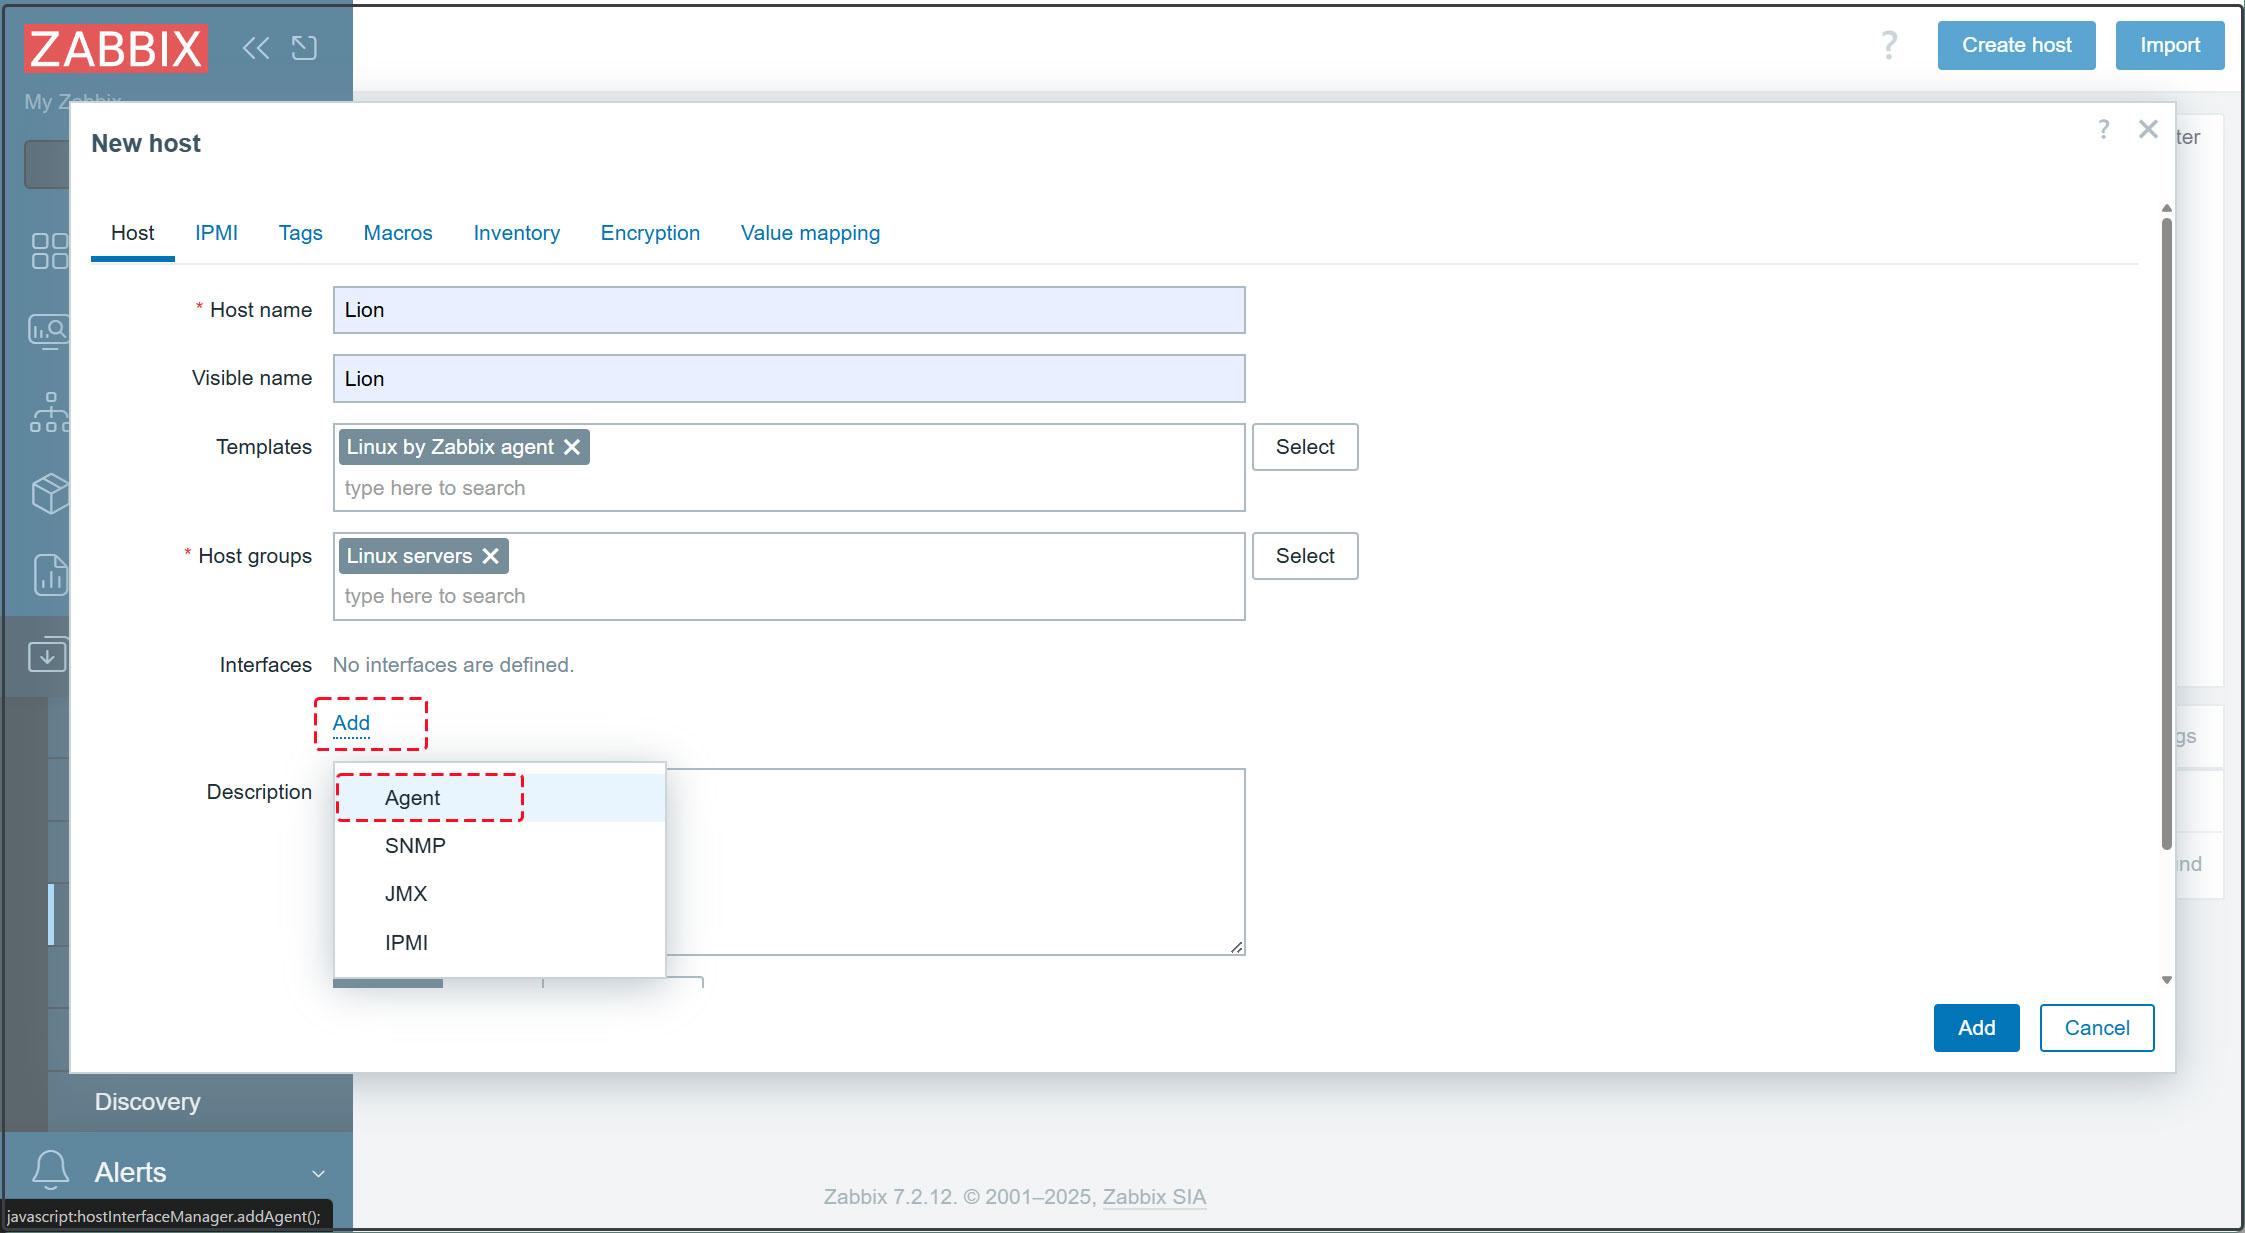
2.5 [Interfaces] にはInterfadesの中の[Add]をクリックし[Agent]を選択し、監視対象の IP アドレスおよび[DNS name]にはホスト名を入力後下段の[Add]をクリック
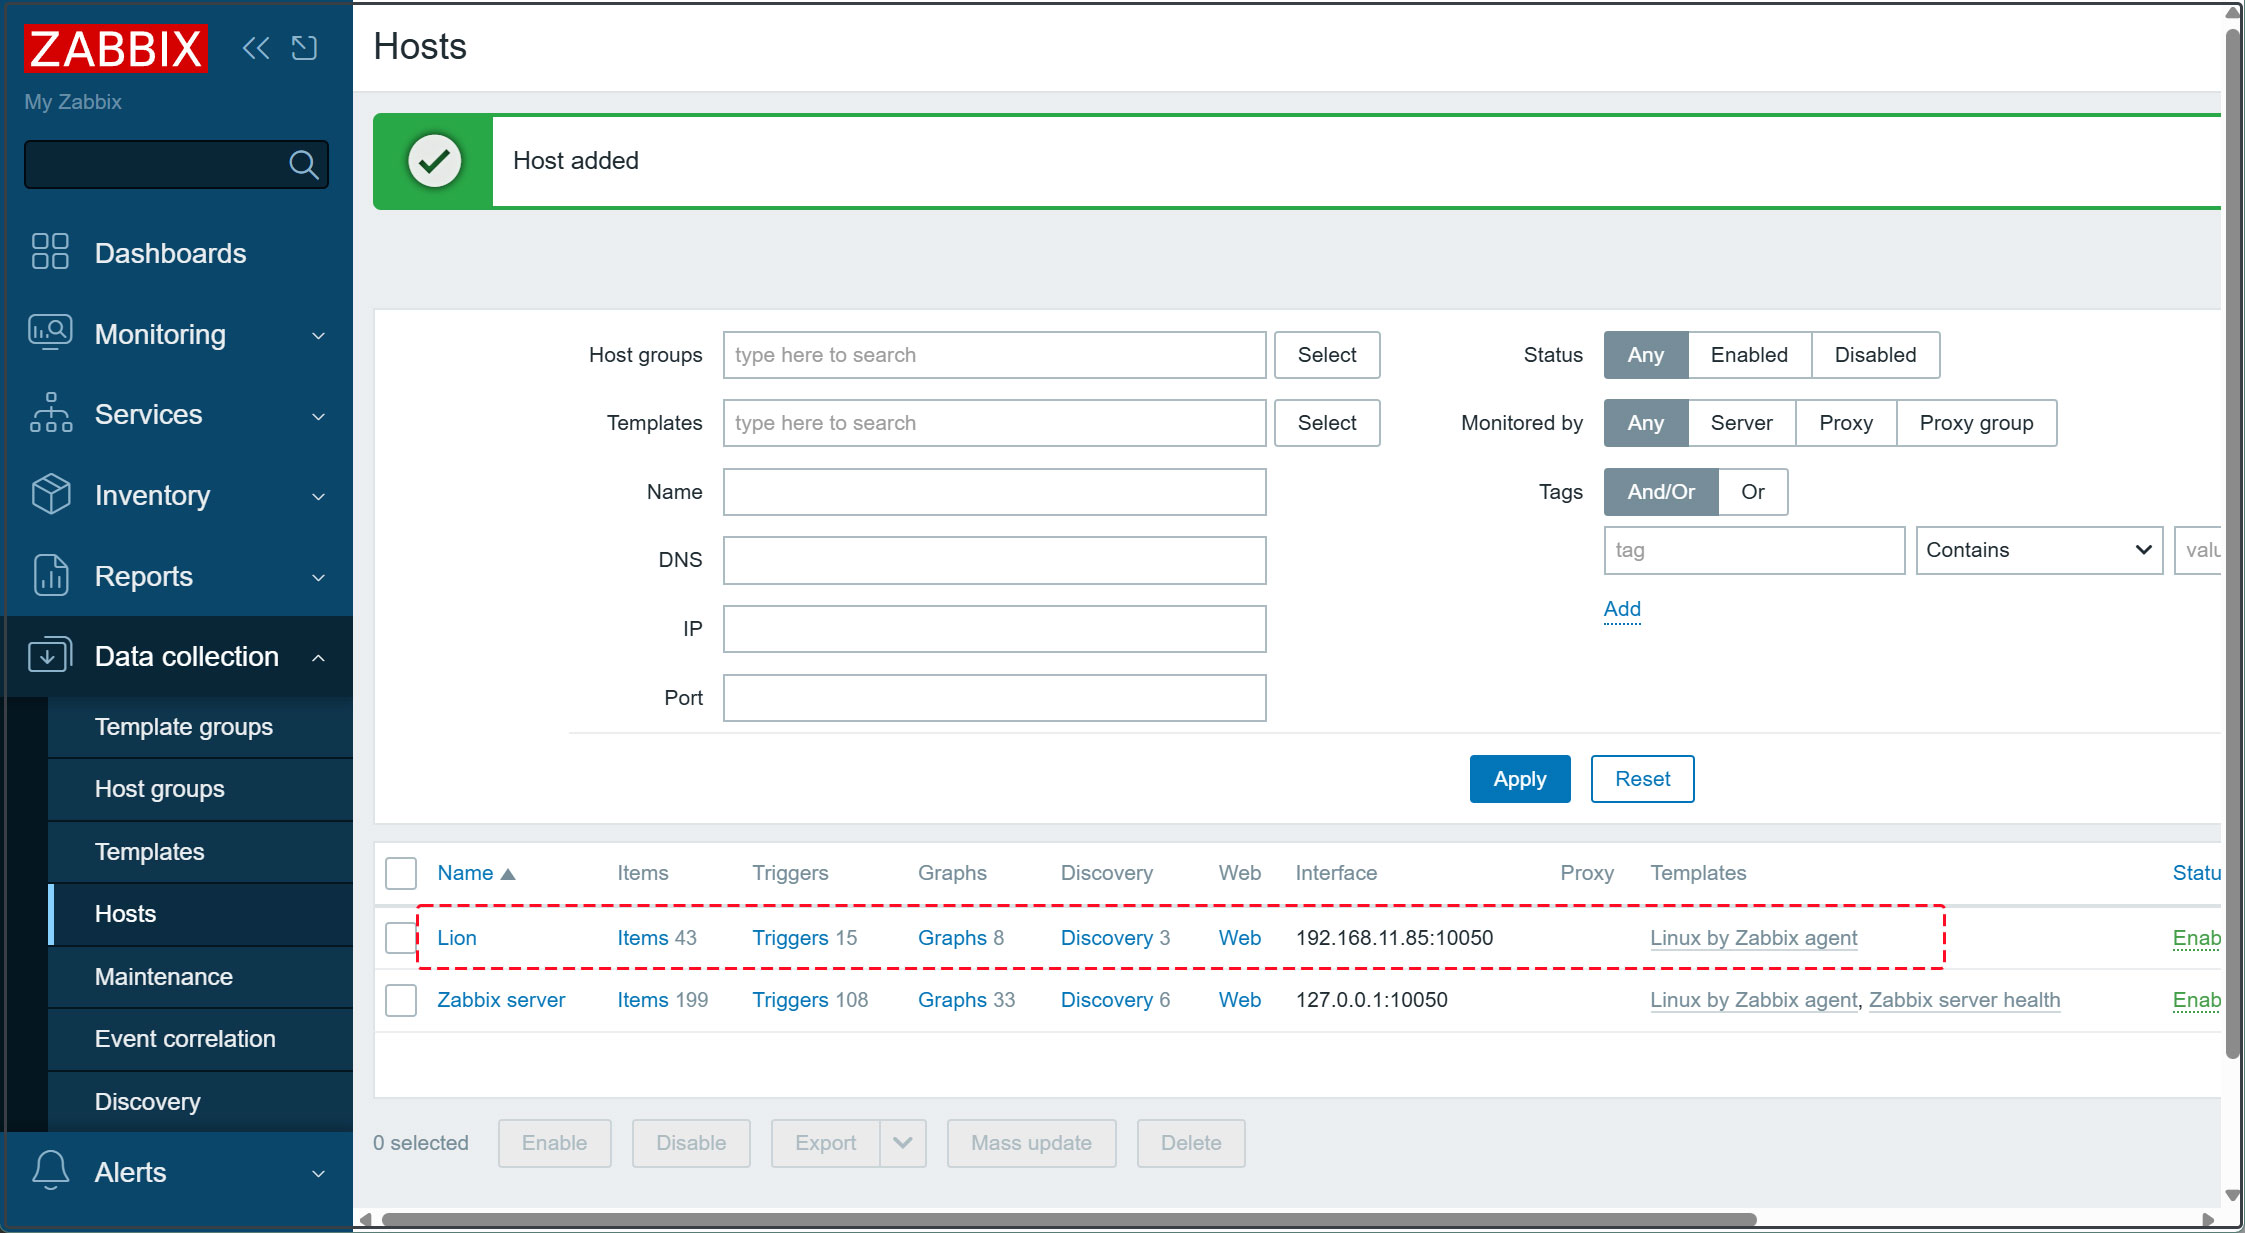
2.6 新しく監視対象サーバーが登録されている
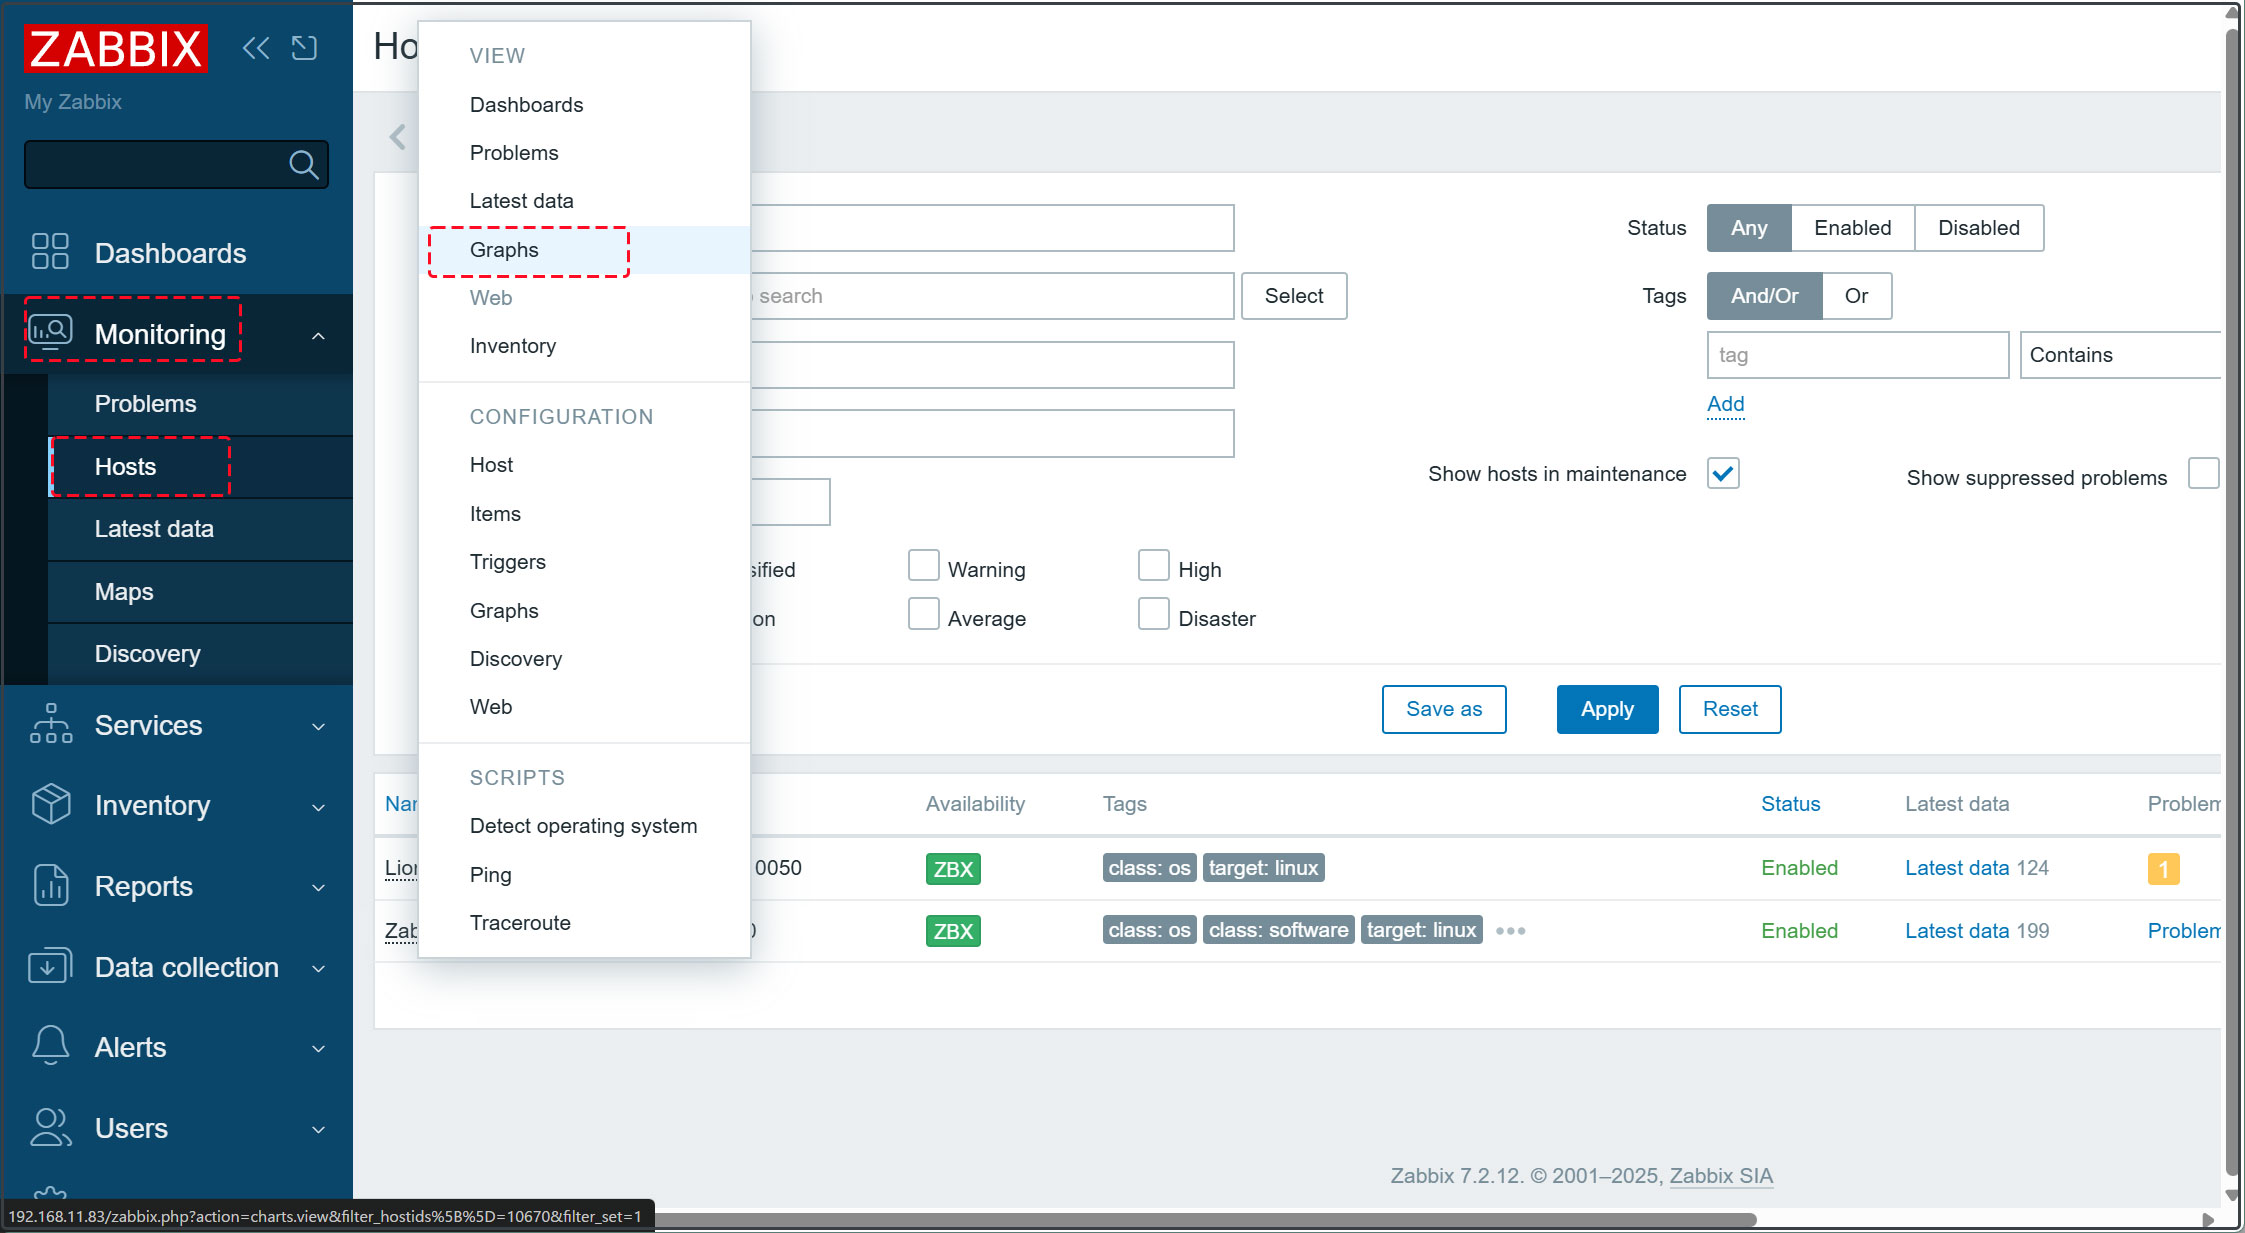
左ペインの[Monitoring][Hosts]、右ペインで追加したホストをクリックし[Graphs]を選択する。
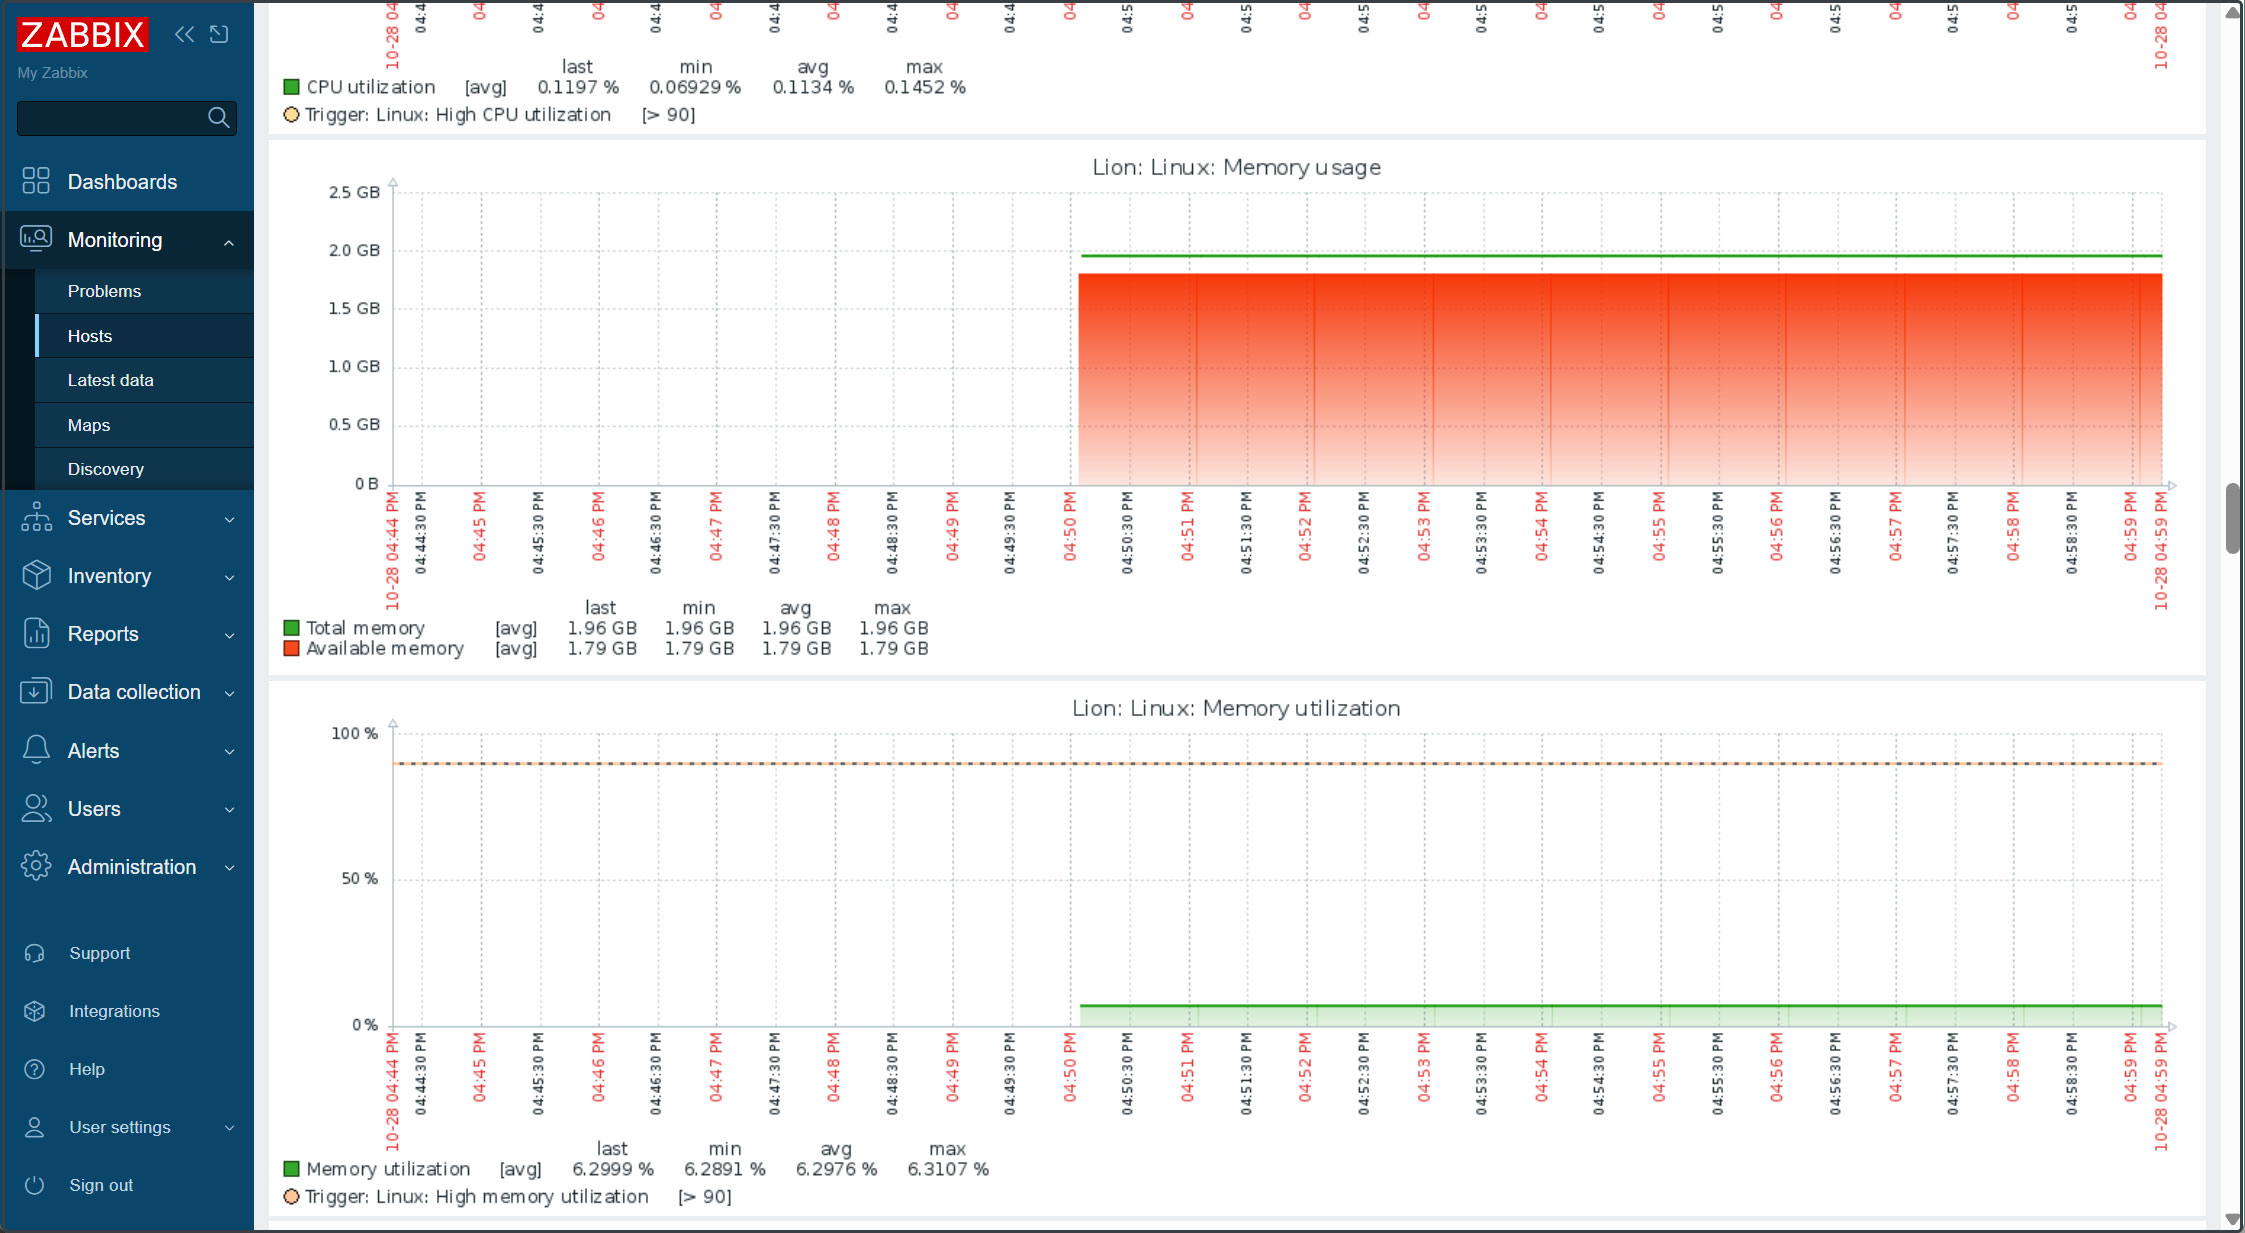
しばらくすると追加した対象ホストのデータが表示されるようになる
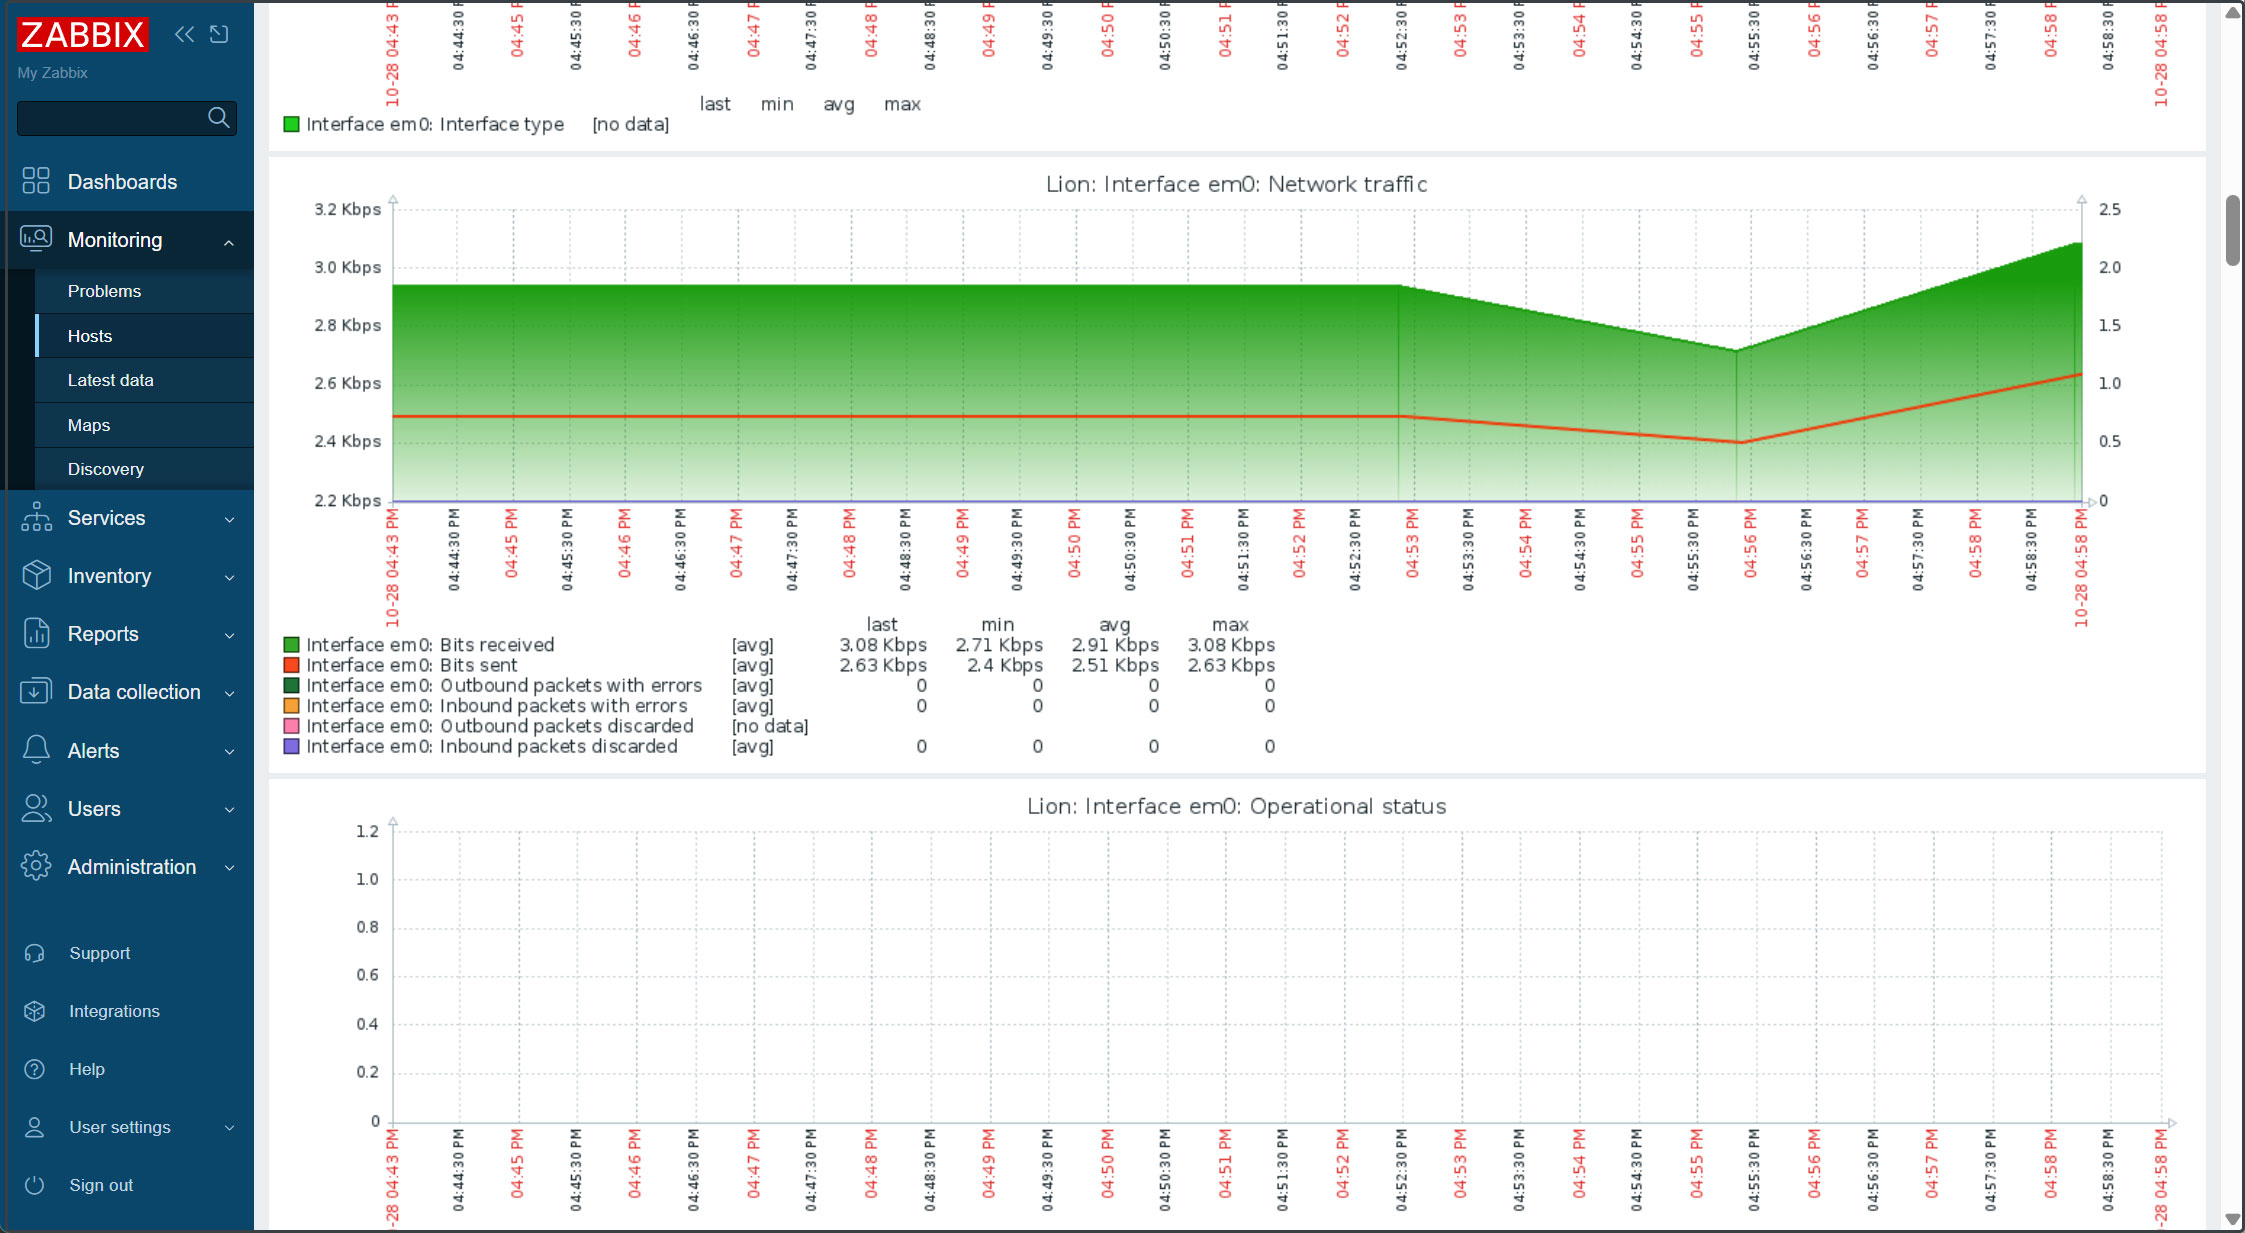
監視対象項目を追加
今回は Zabbix サーバー上の Apache httpd サービスを監視対象に追加する
1. 監視対象とする Zabbix サーバーの Apache httpd で server-status を有効化する
apache構成ファイルhttpd.confを編集
 # vi  /usr/local/etc/apache24/httpd.conf

161行目 status_moduleが有効になっているか確認
LoadModule status_module libexec/apache24/mod_status.so

最終行に下記を追加
<Location /server-status>
    SetHandler server-status
    Require local
</Location>
# service apache24 restart
2.Zabbix の管理サイトにログインし、左ペインで [Data collection] - [Hosts] をクリックし、右ペインで、監視項目を追加したいホストをクリック(今回はZabbix server)
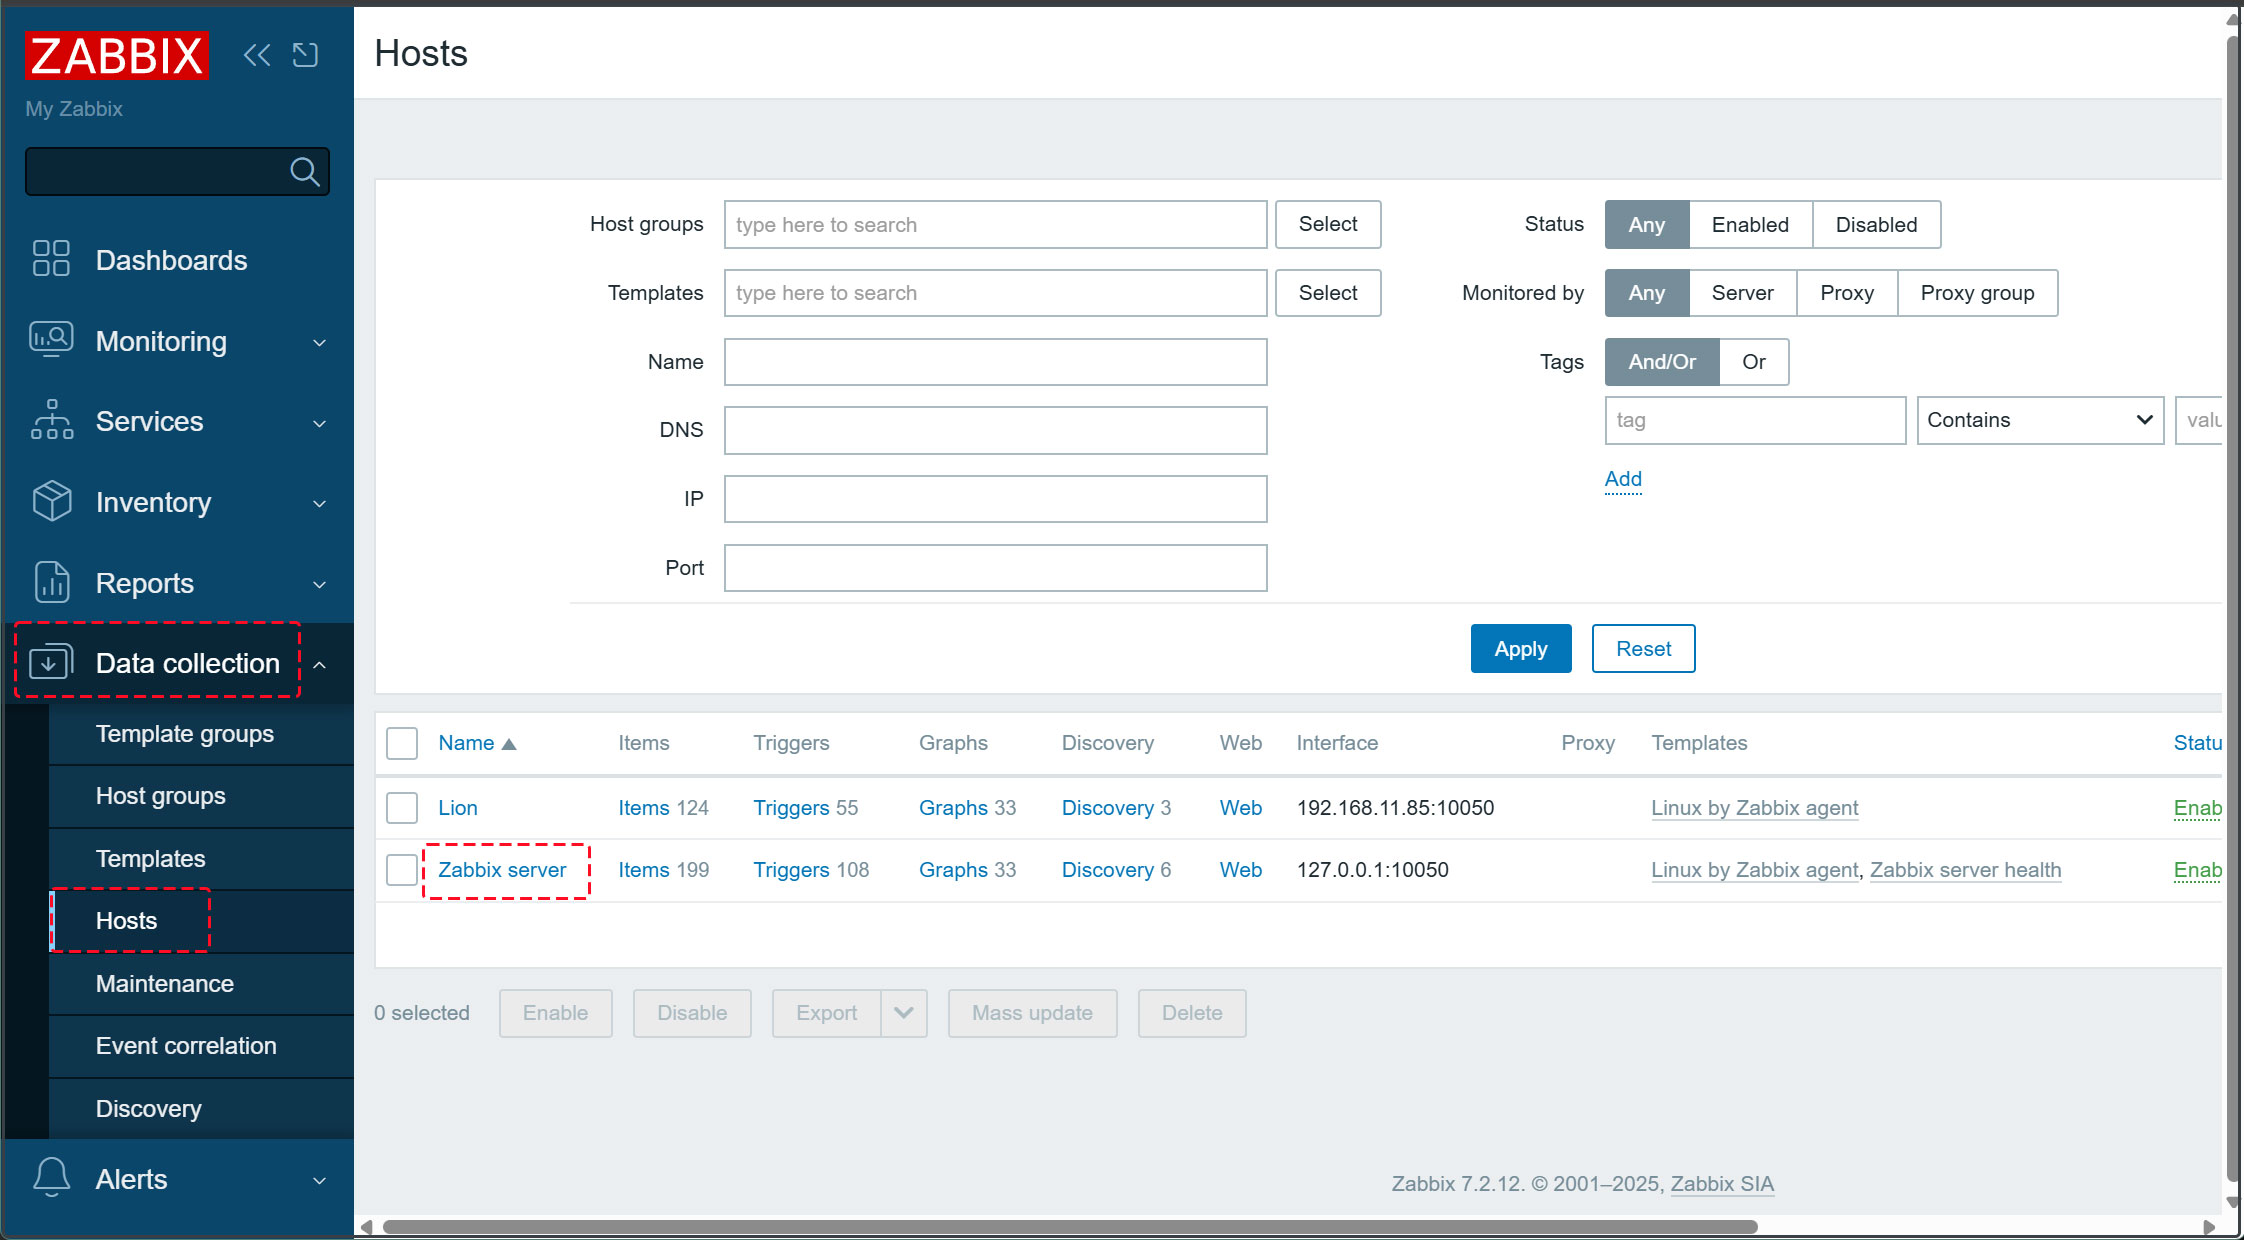
3. [Templates] セクションの [Select] ボタンをクリック
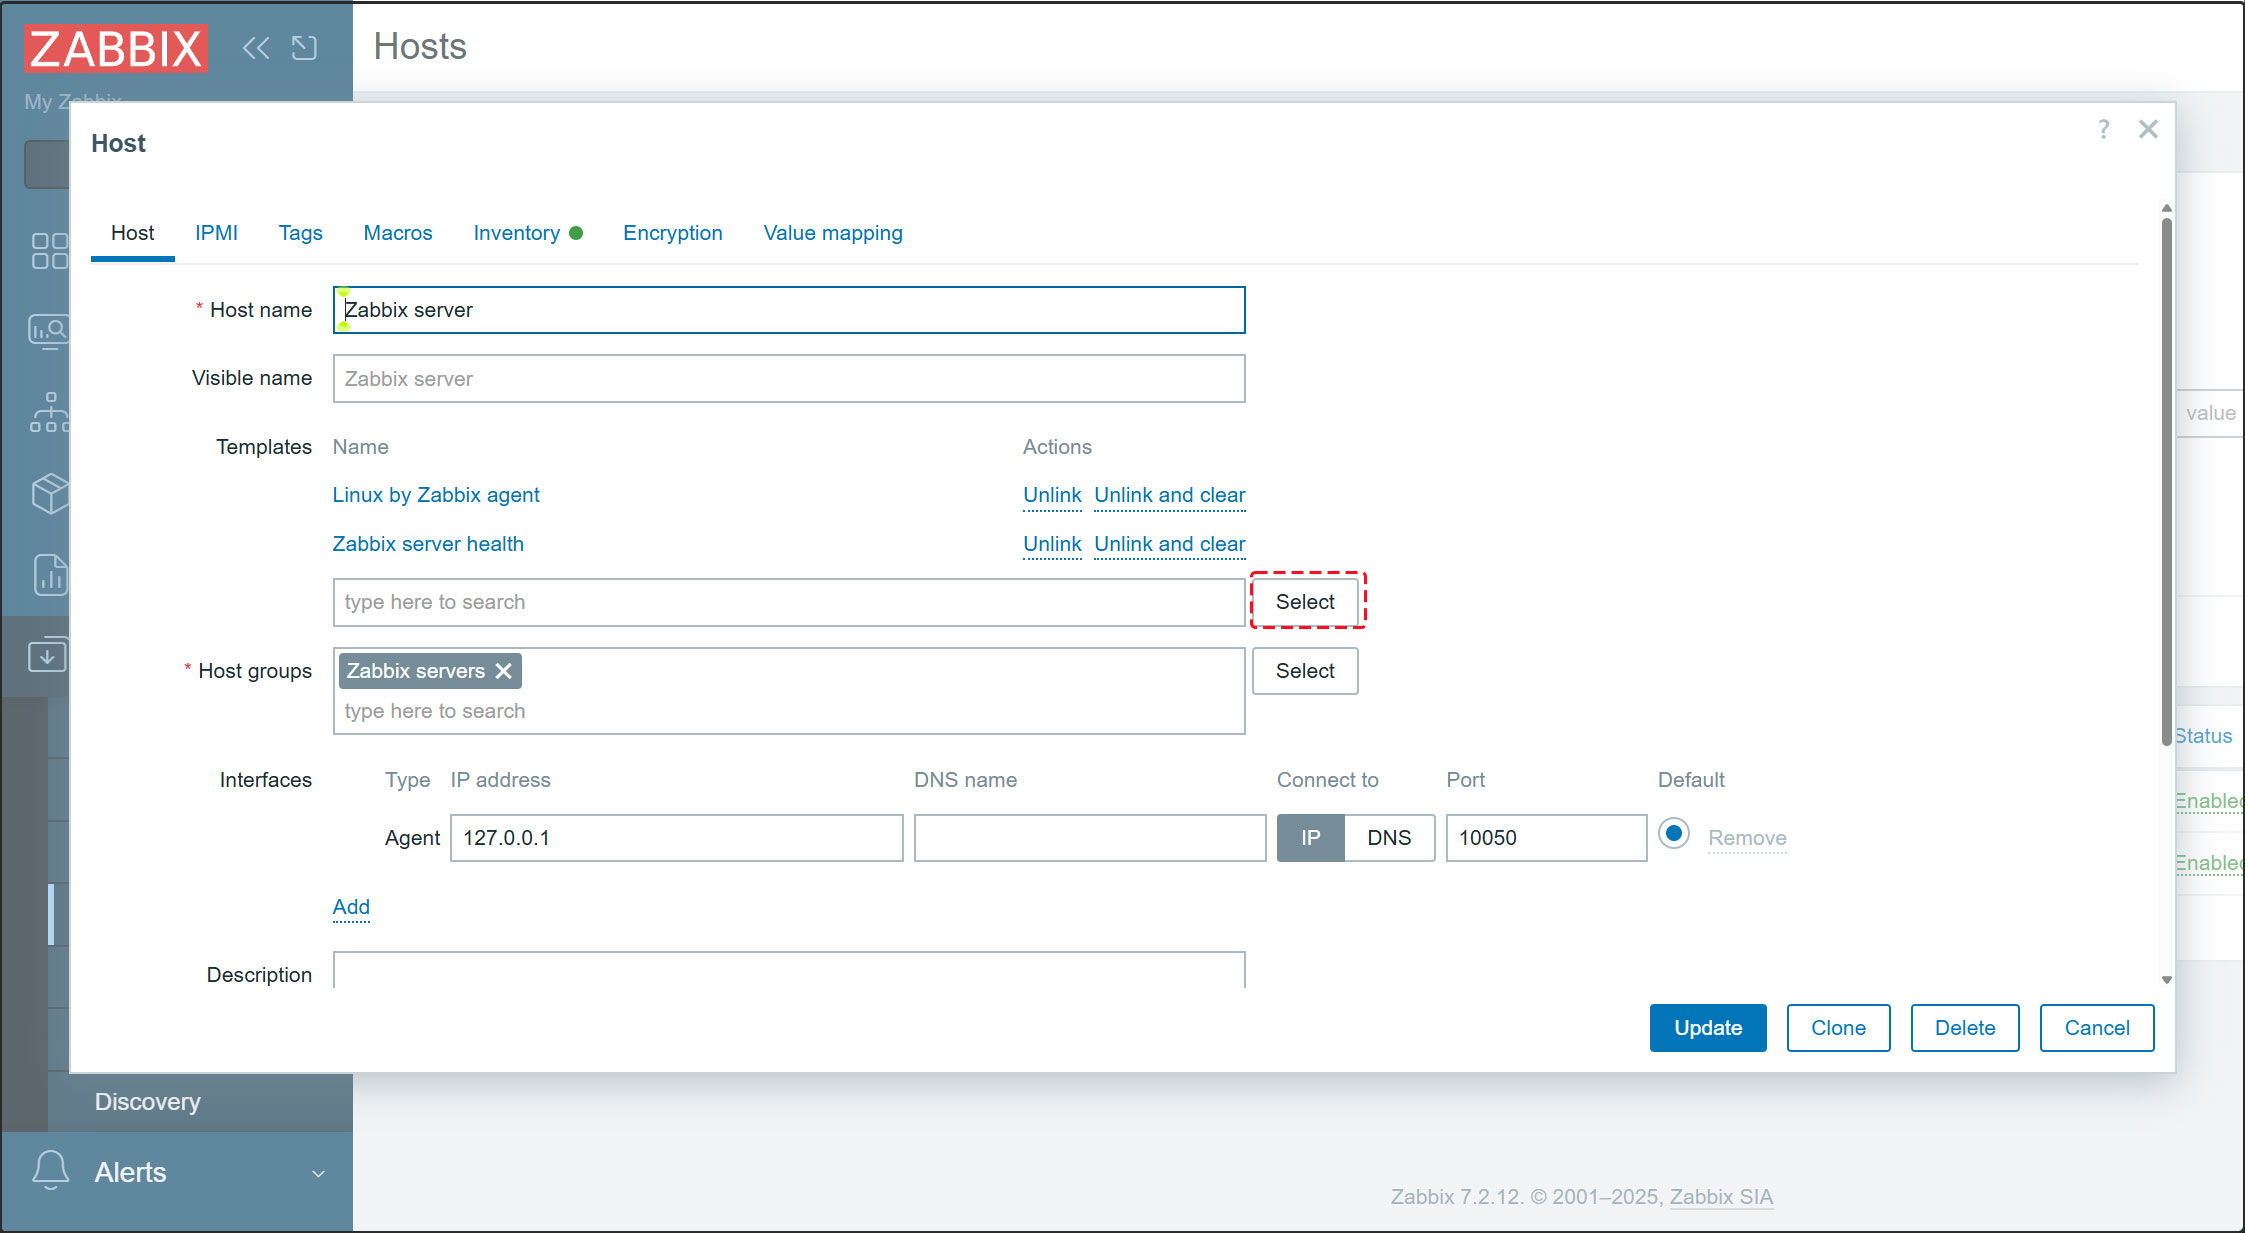
4. [Select] ボタンをクリック
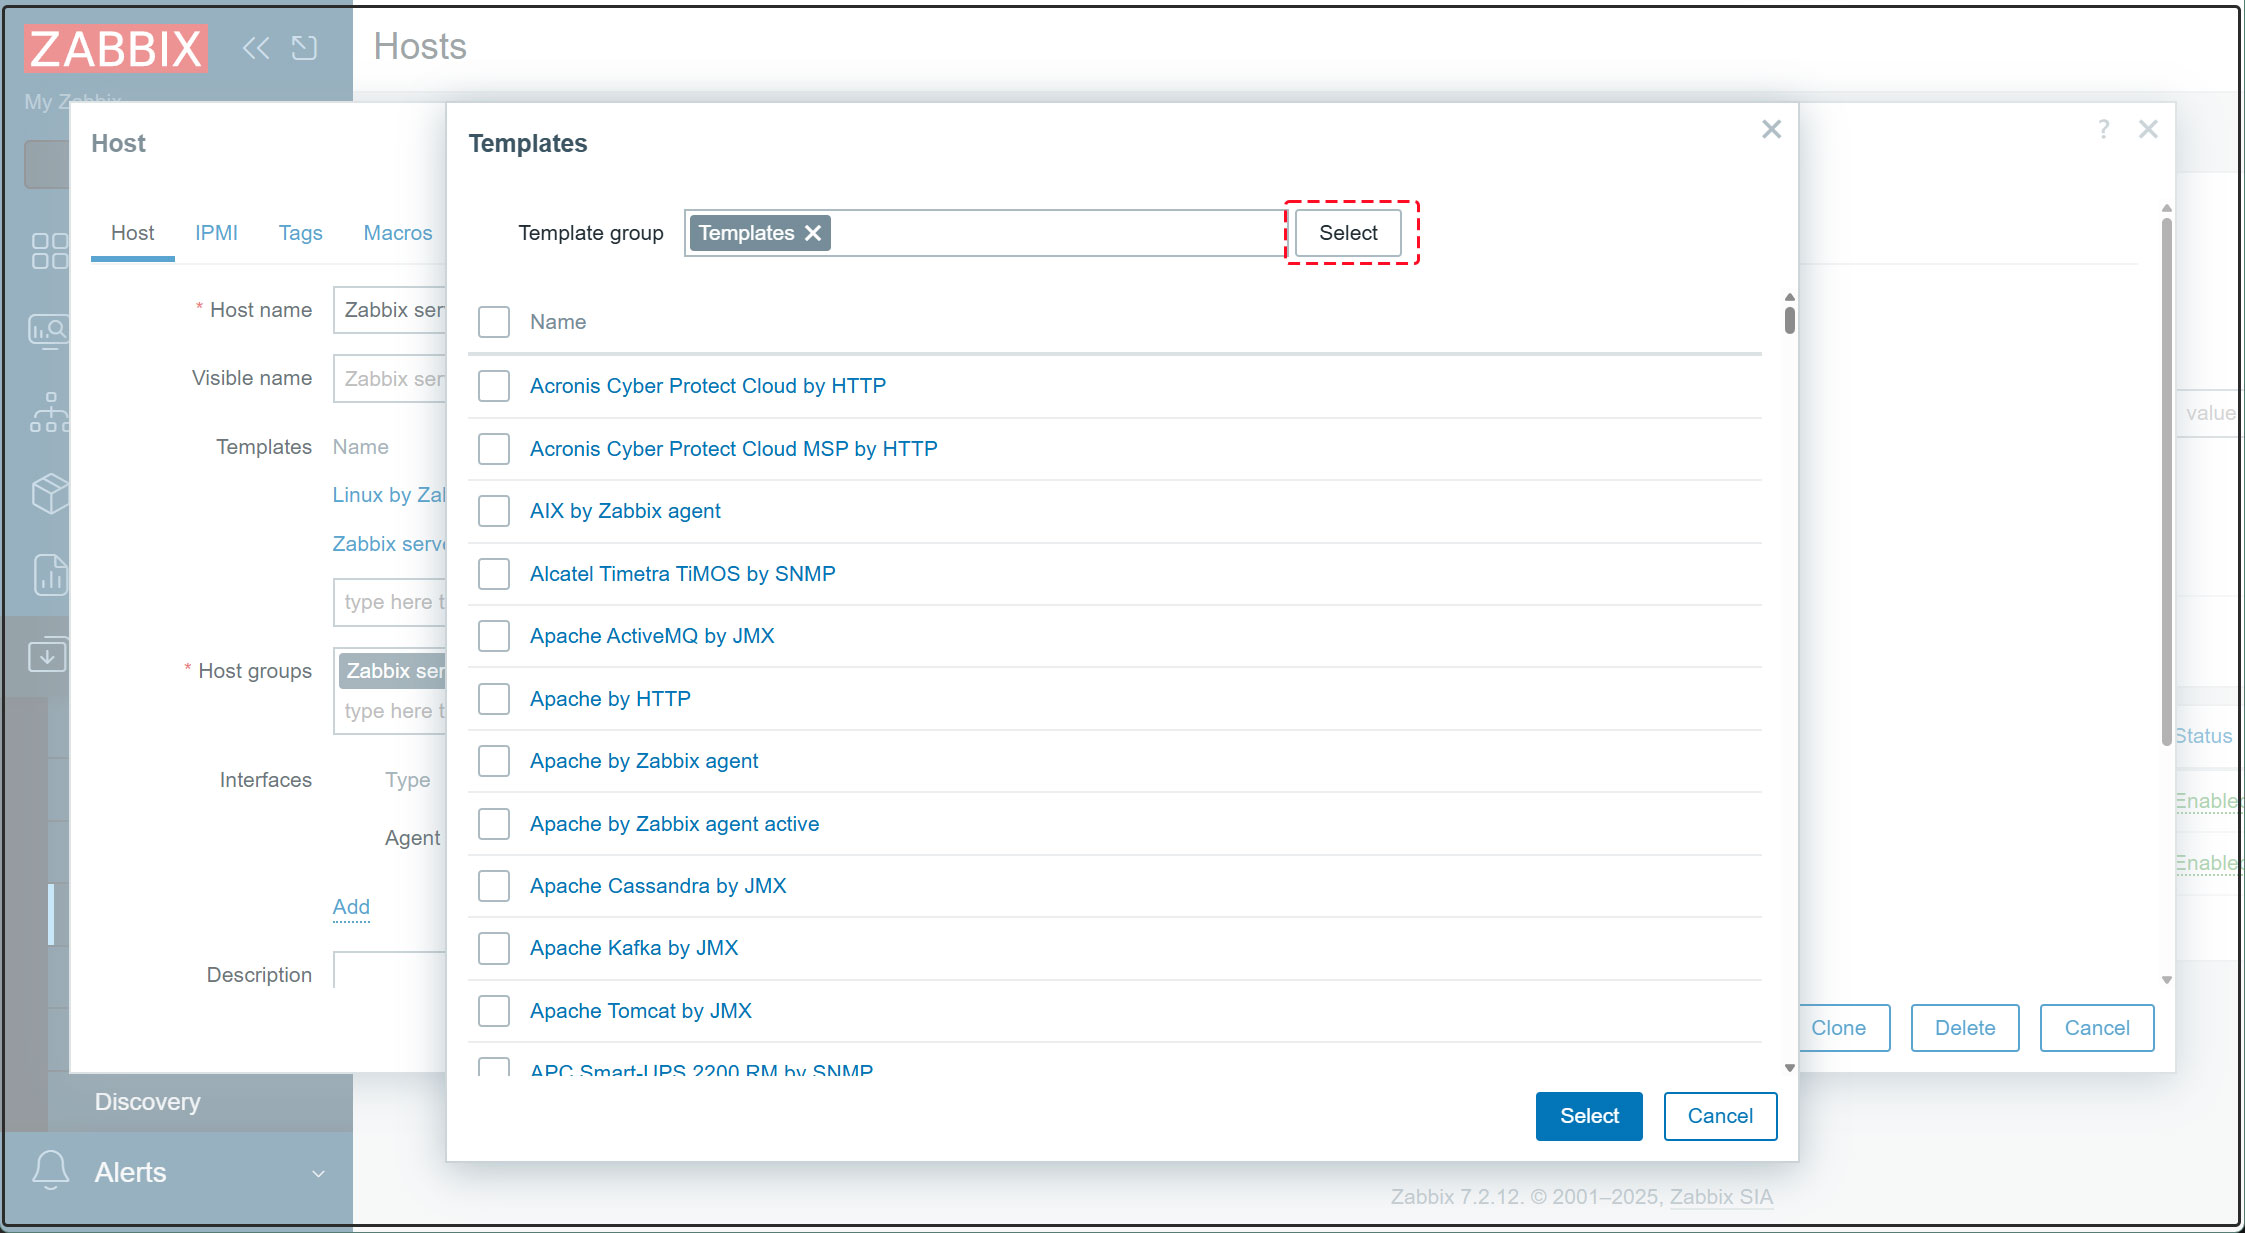
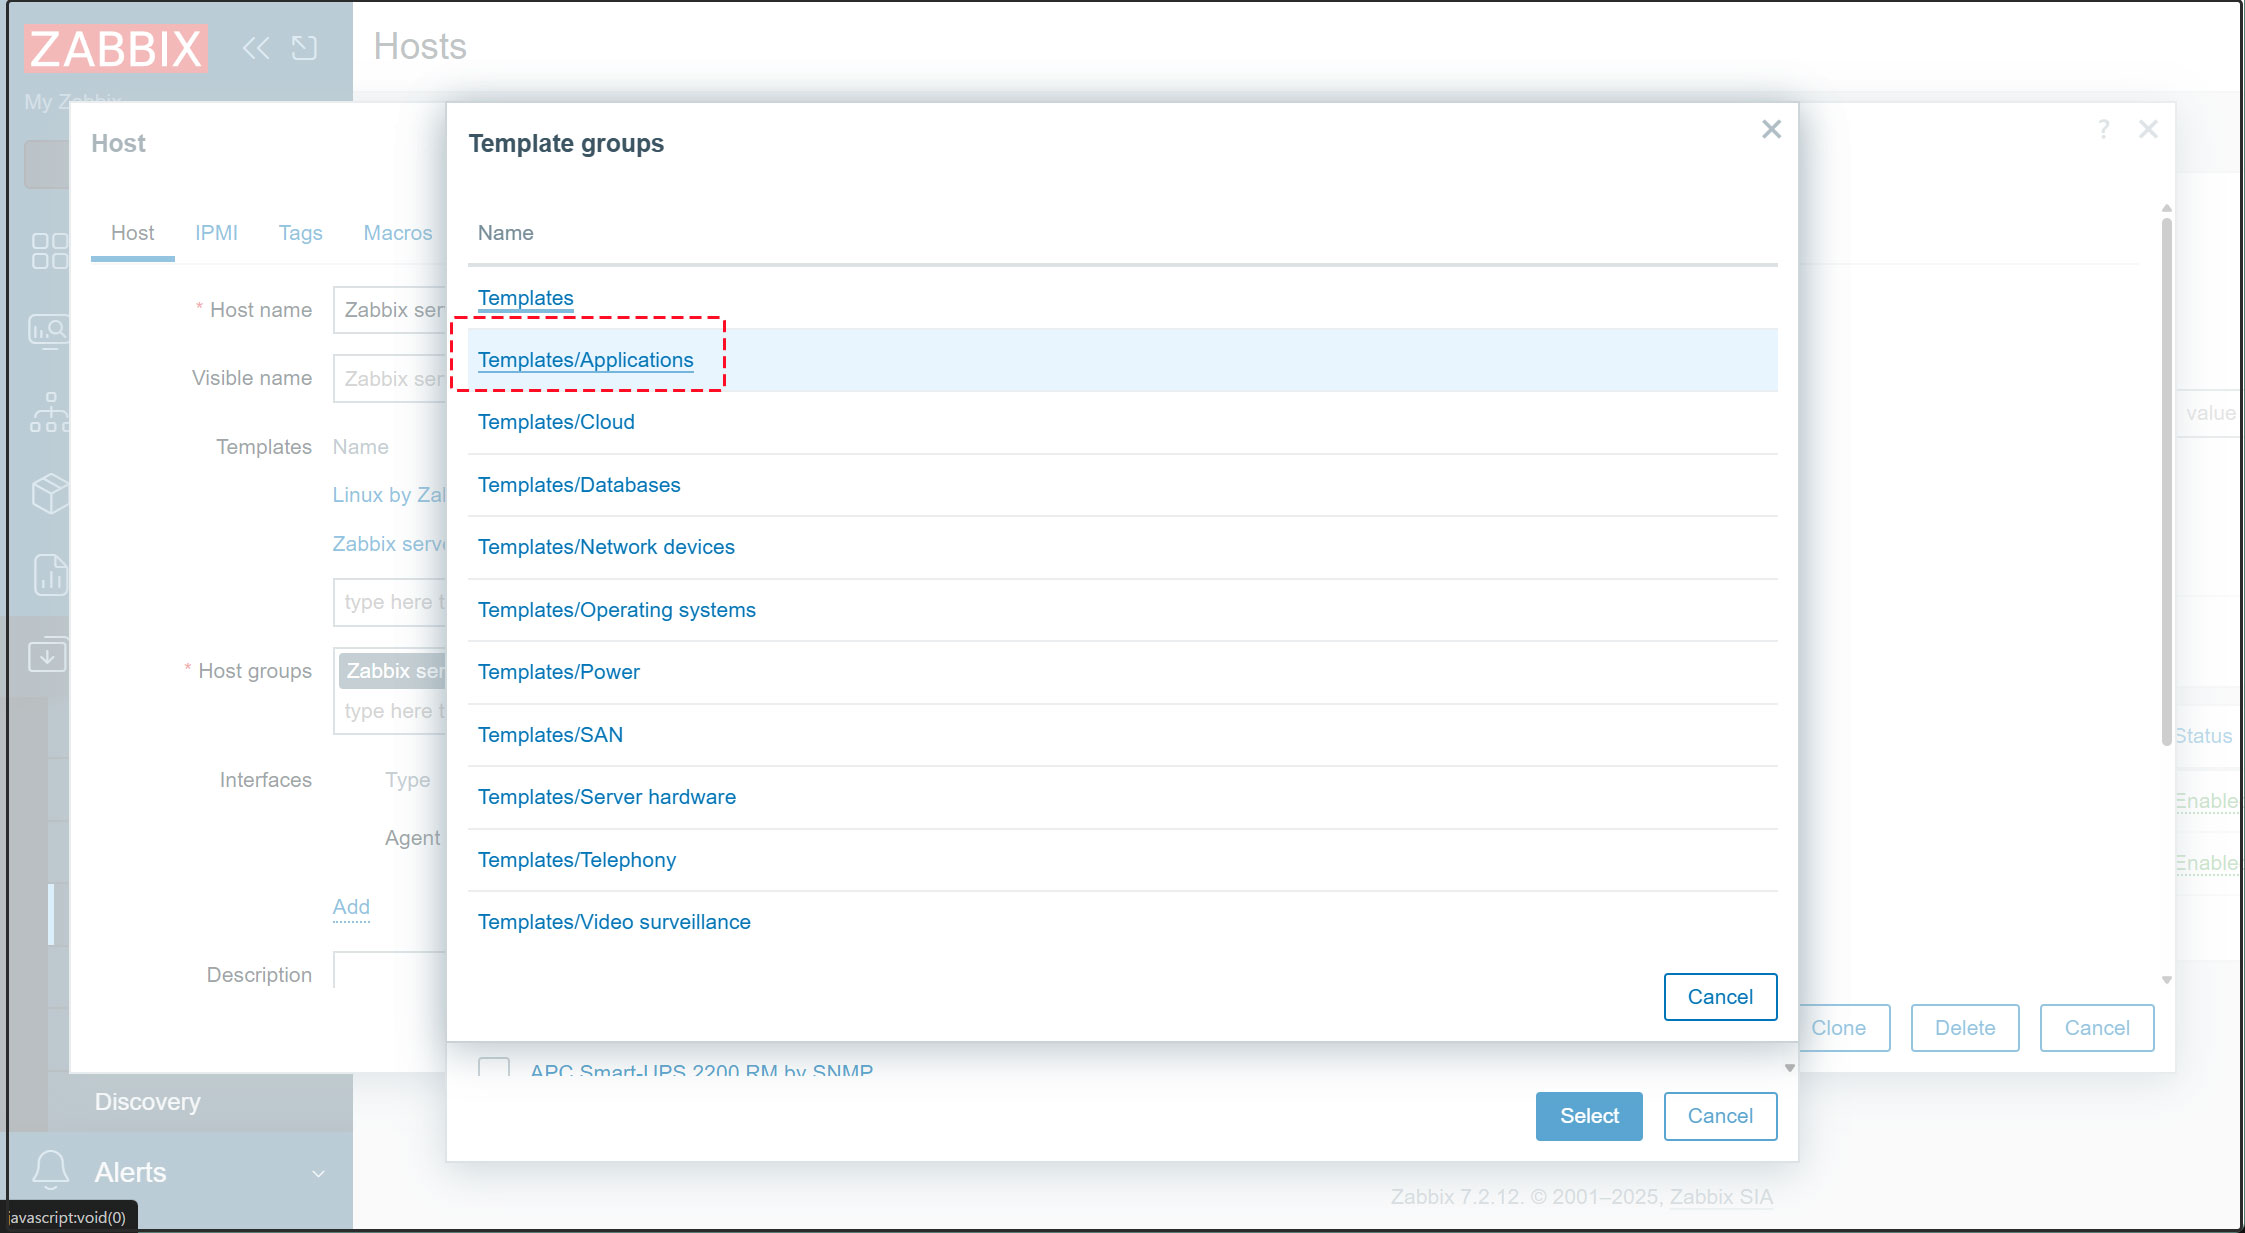
5. [Templates/Applications] をクリック
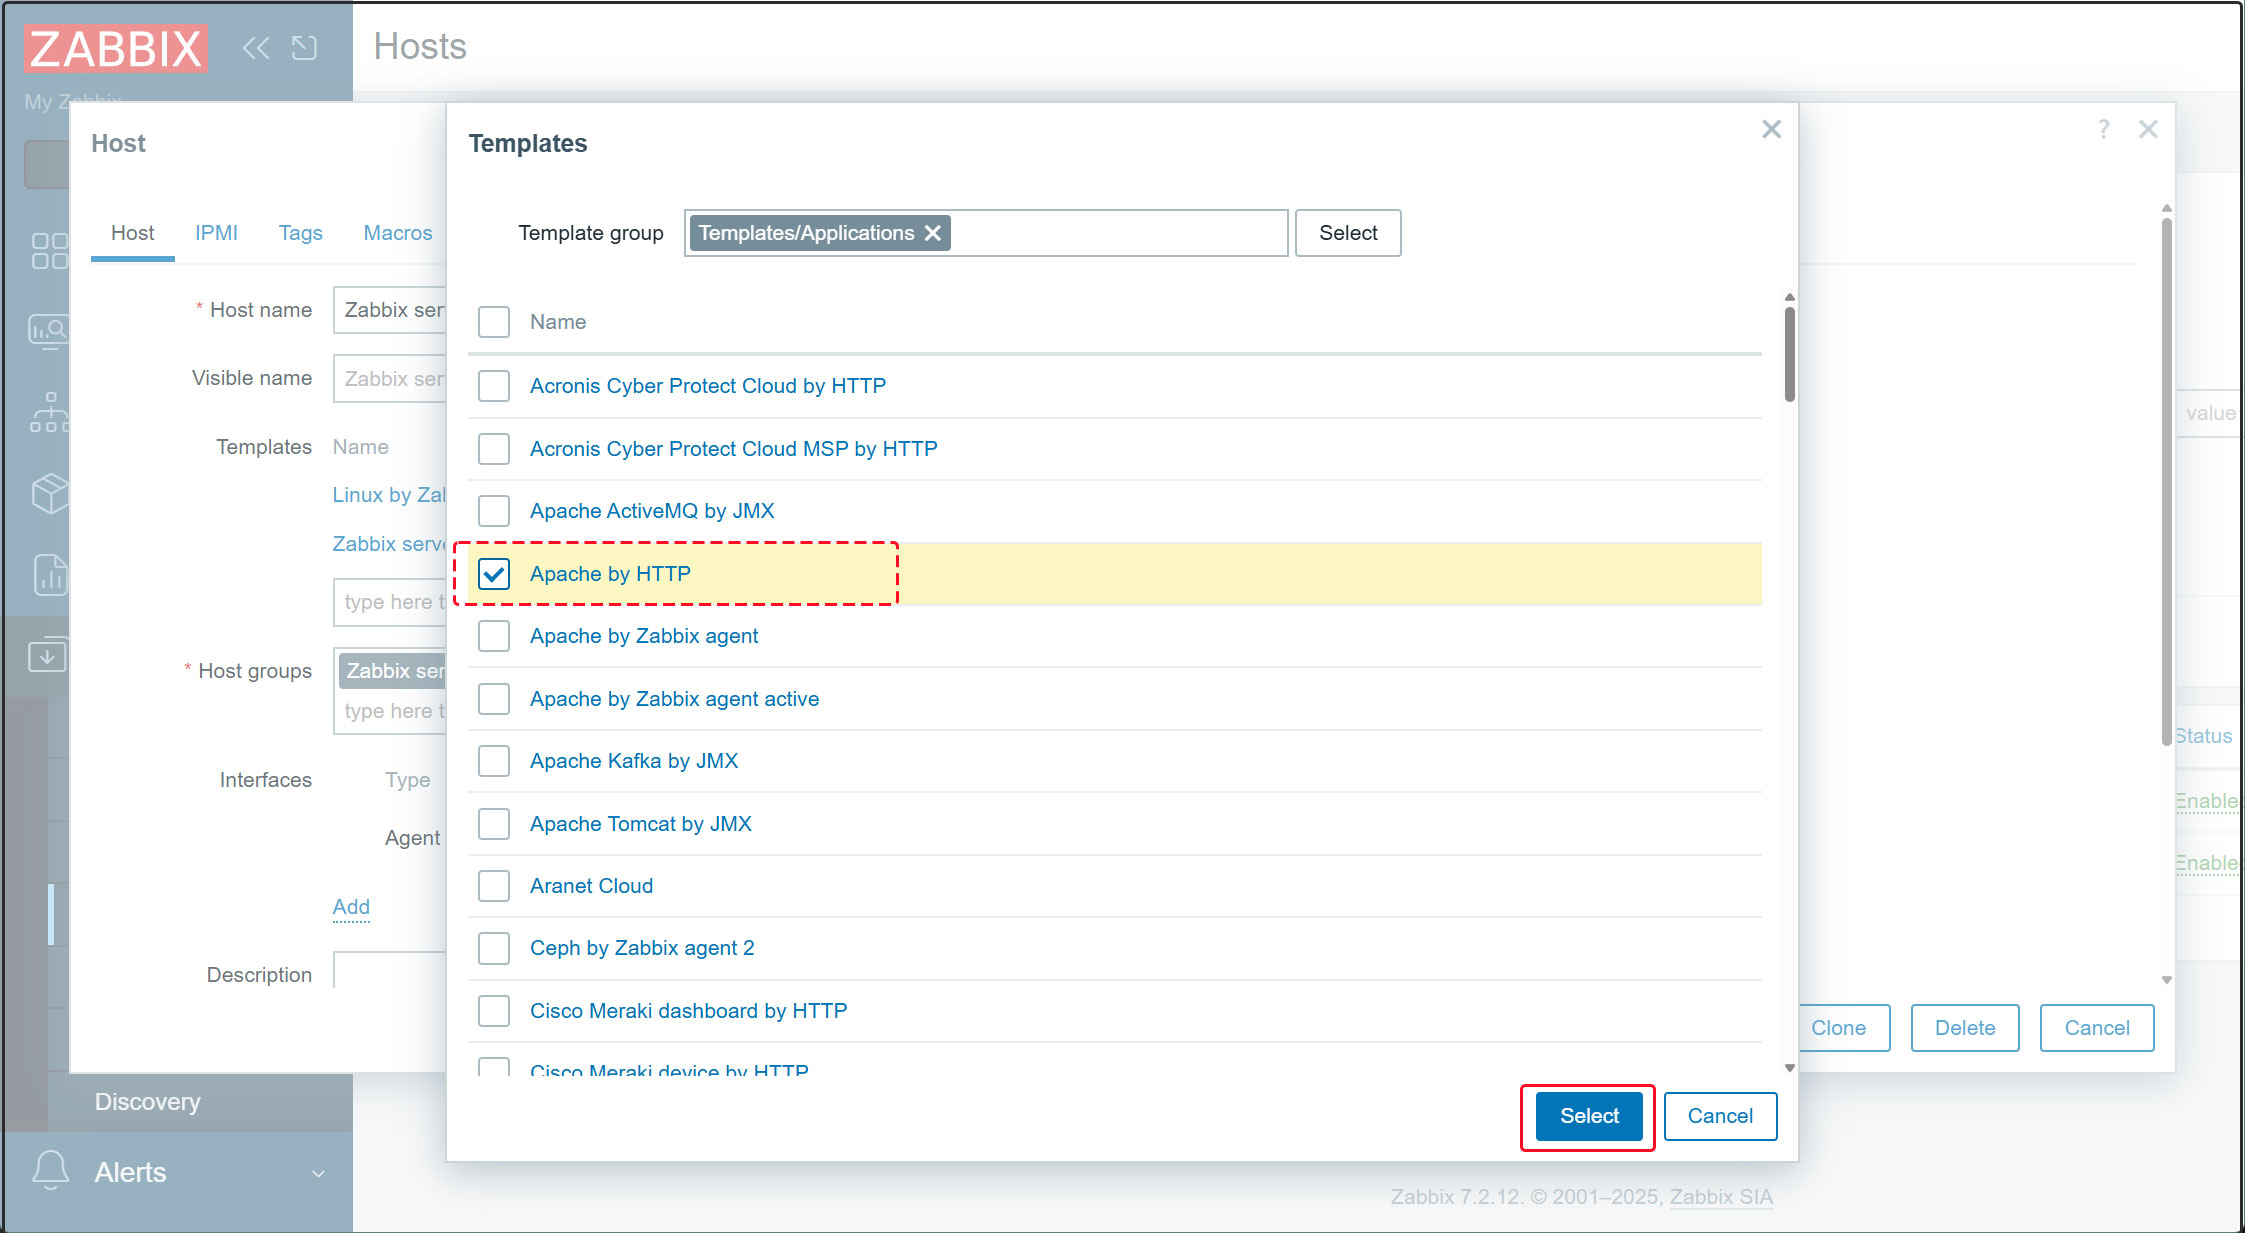
6. [Apache by HTTP] を選択し[Select]をクリック
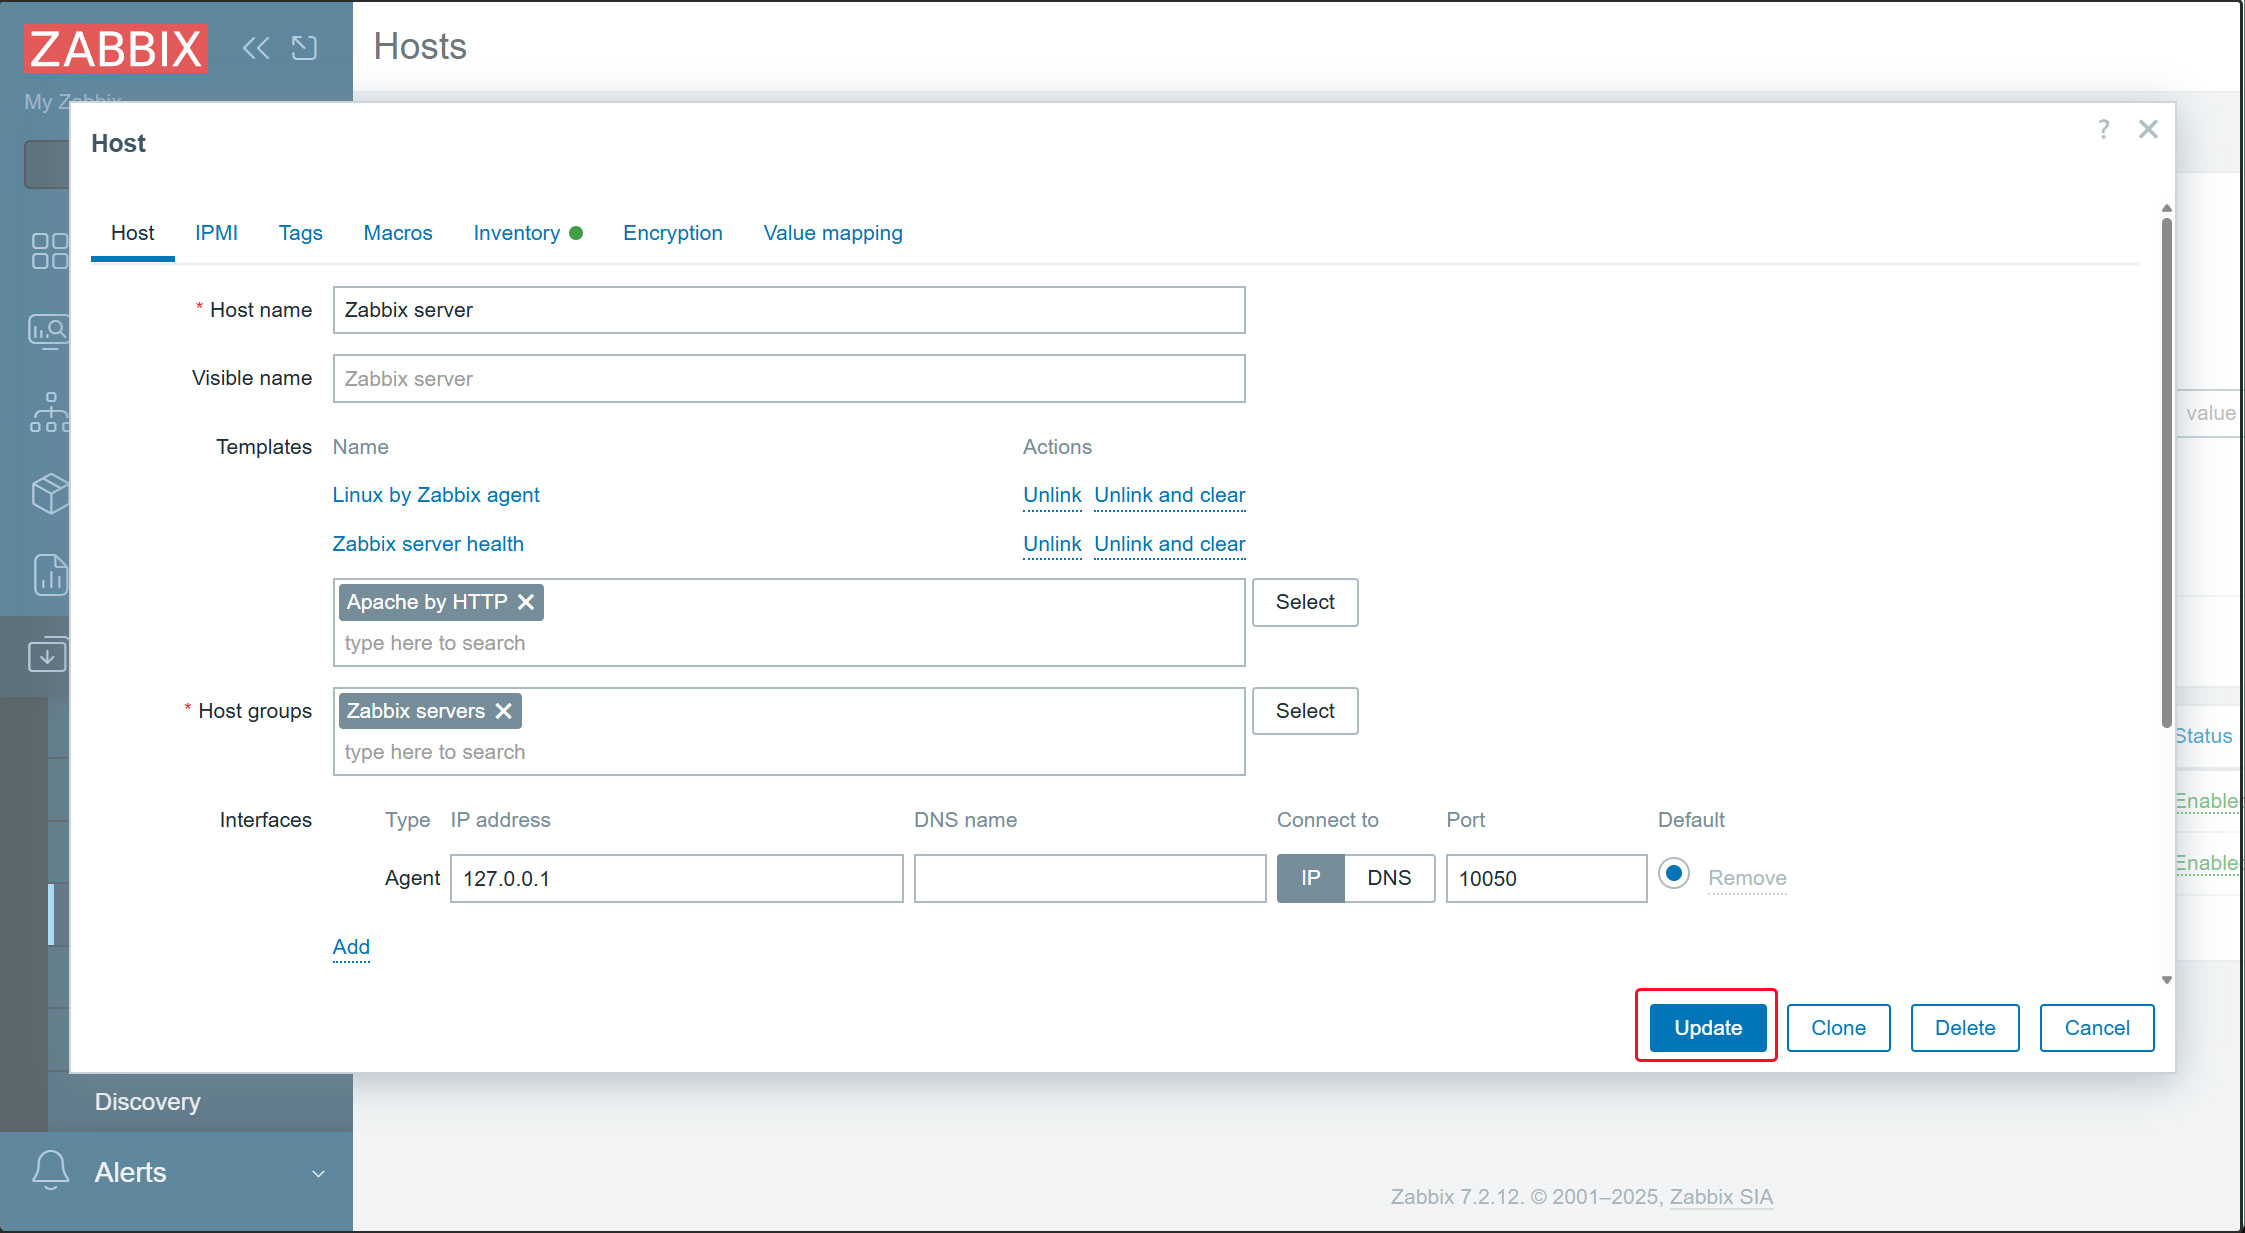
7. [Update] ボタンをクリックして設定を更新
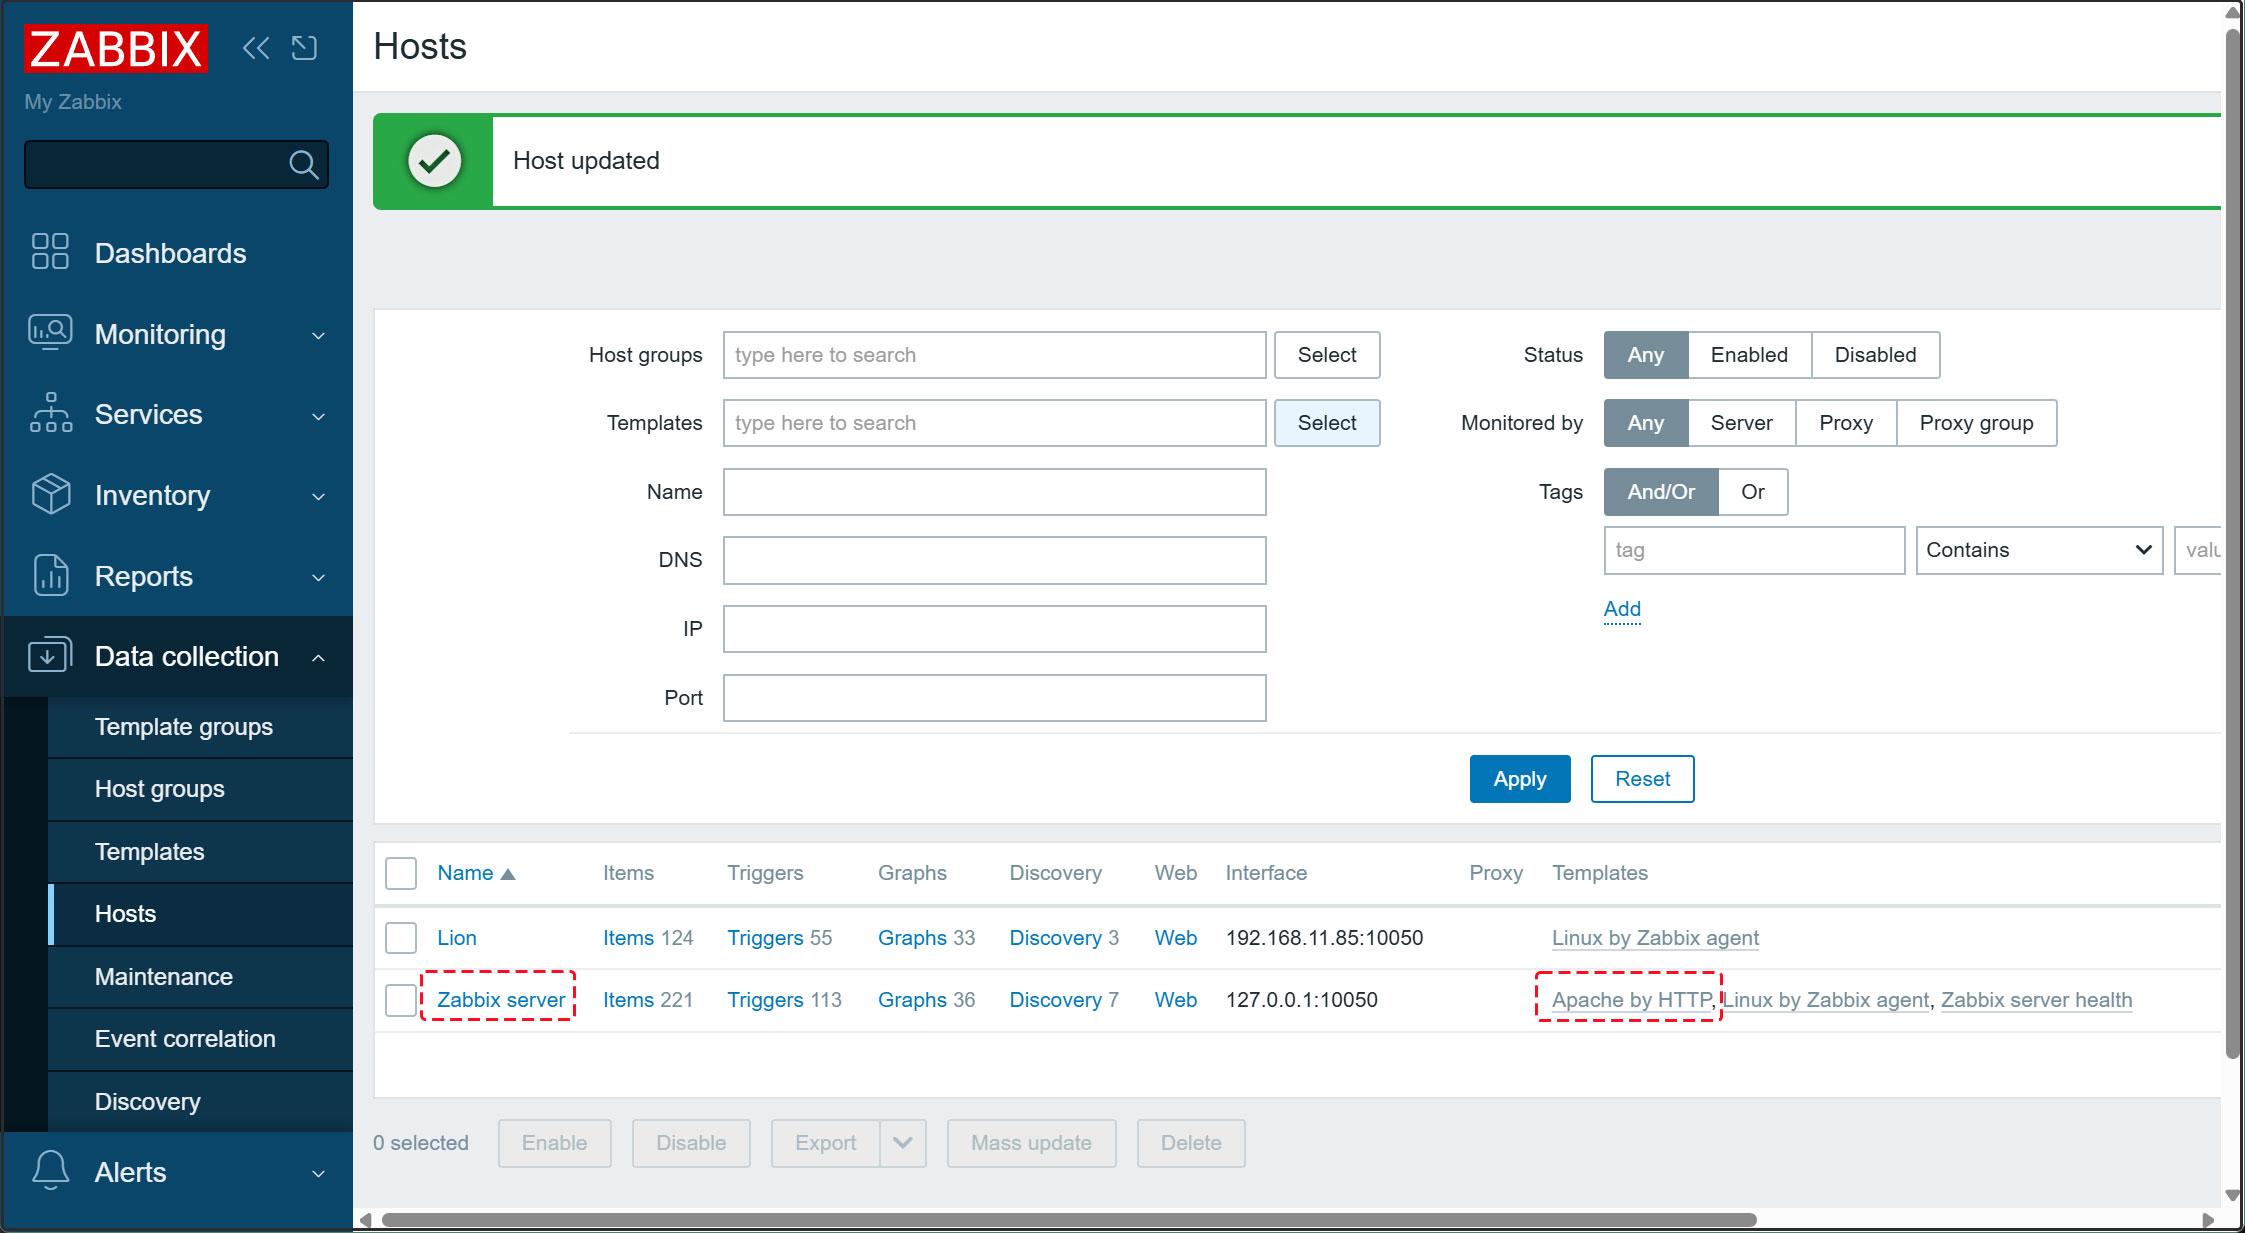
8. [Apache by HTTP] リンクをクリック
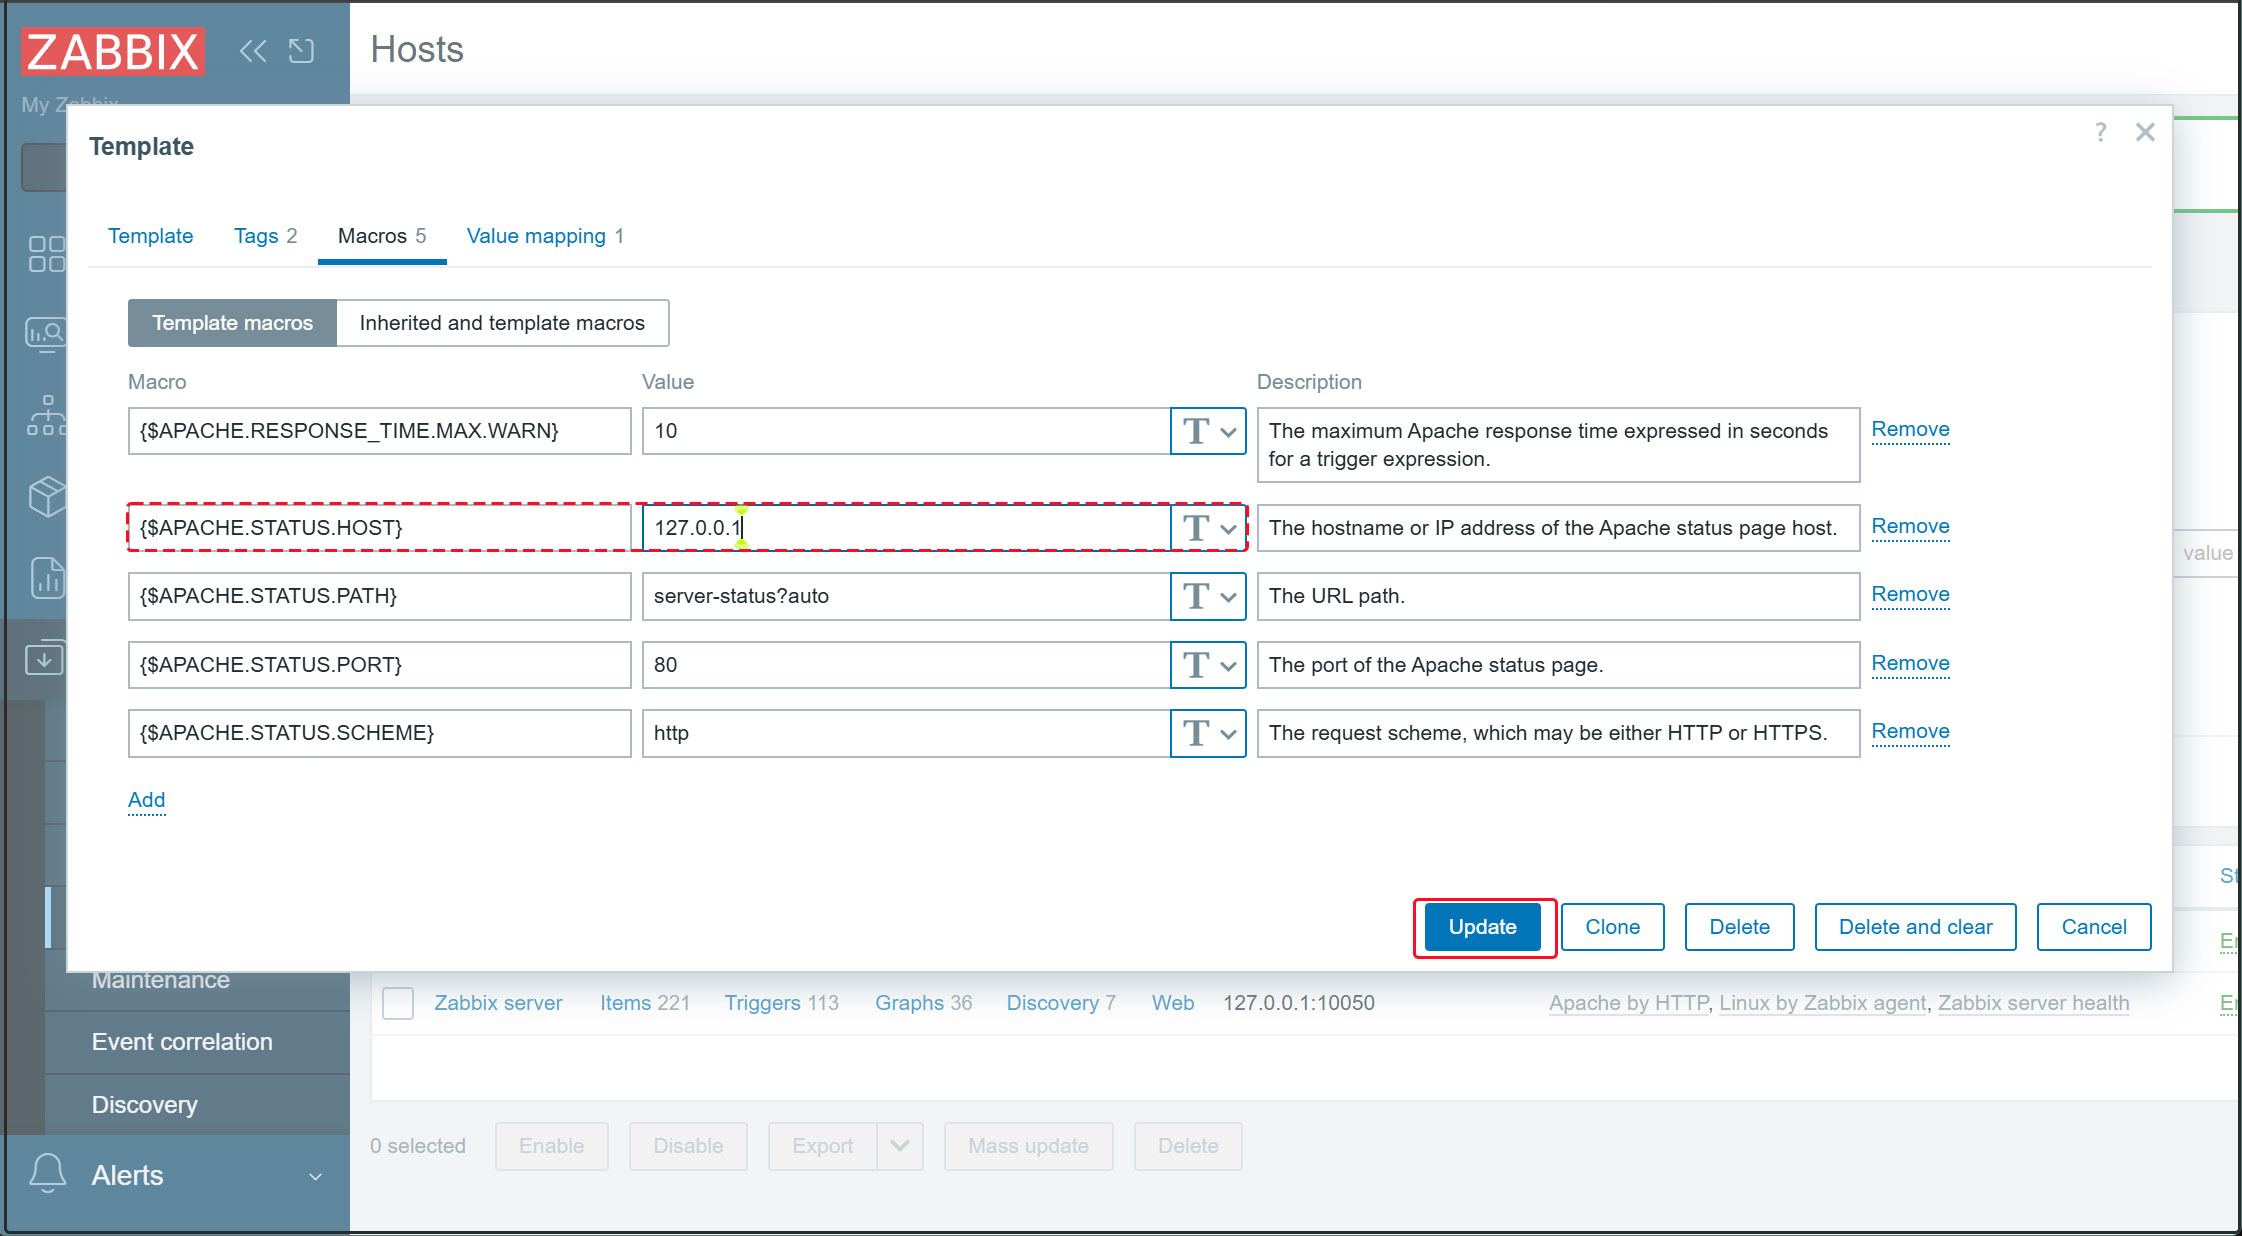
9. [Macros] タブを開き、{$APACHE.STATUS.HOST} に [127.0.0.1] を入力して [Update]
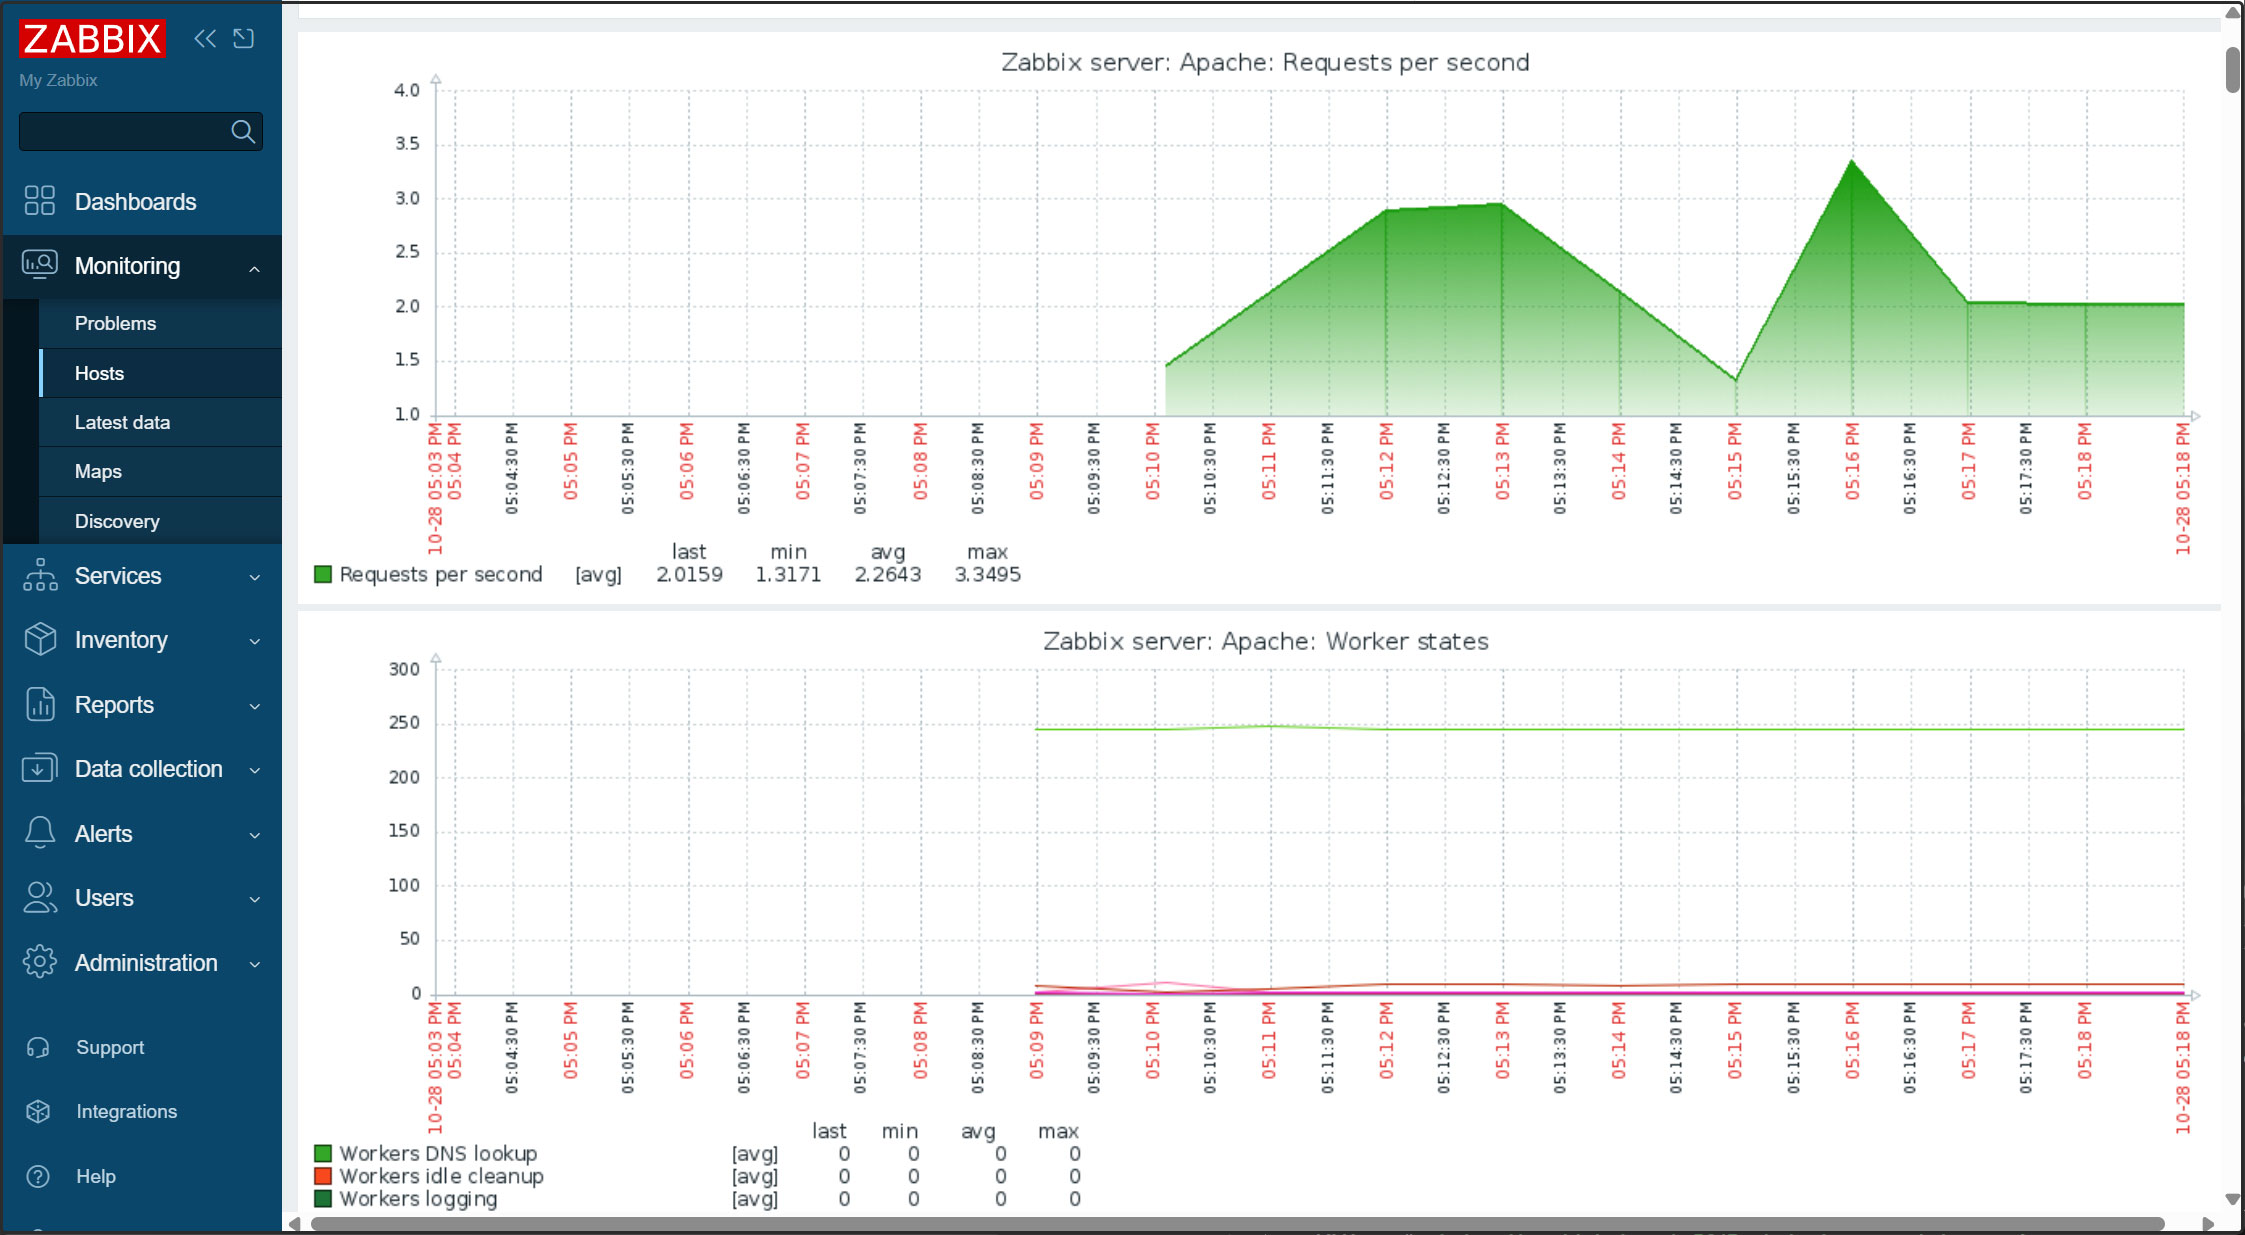
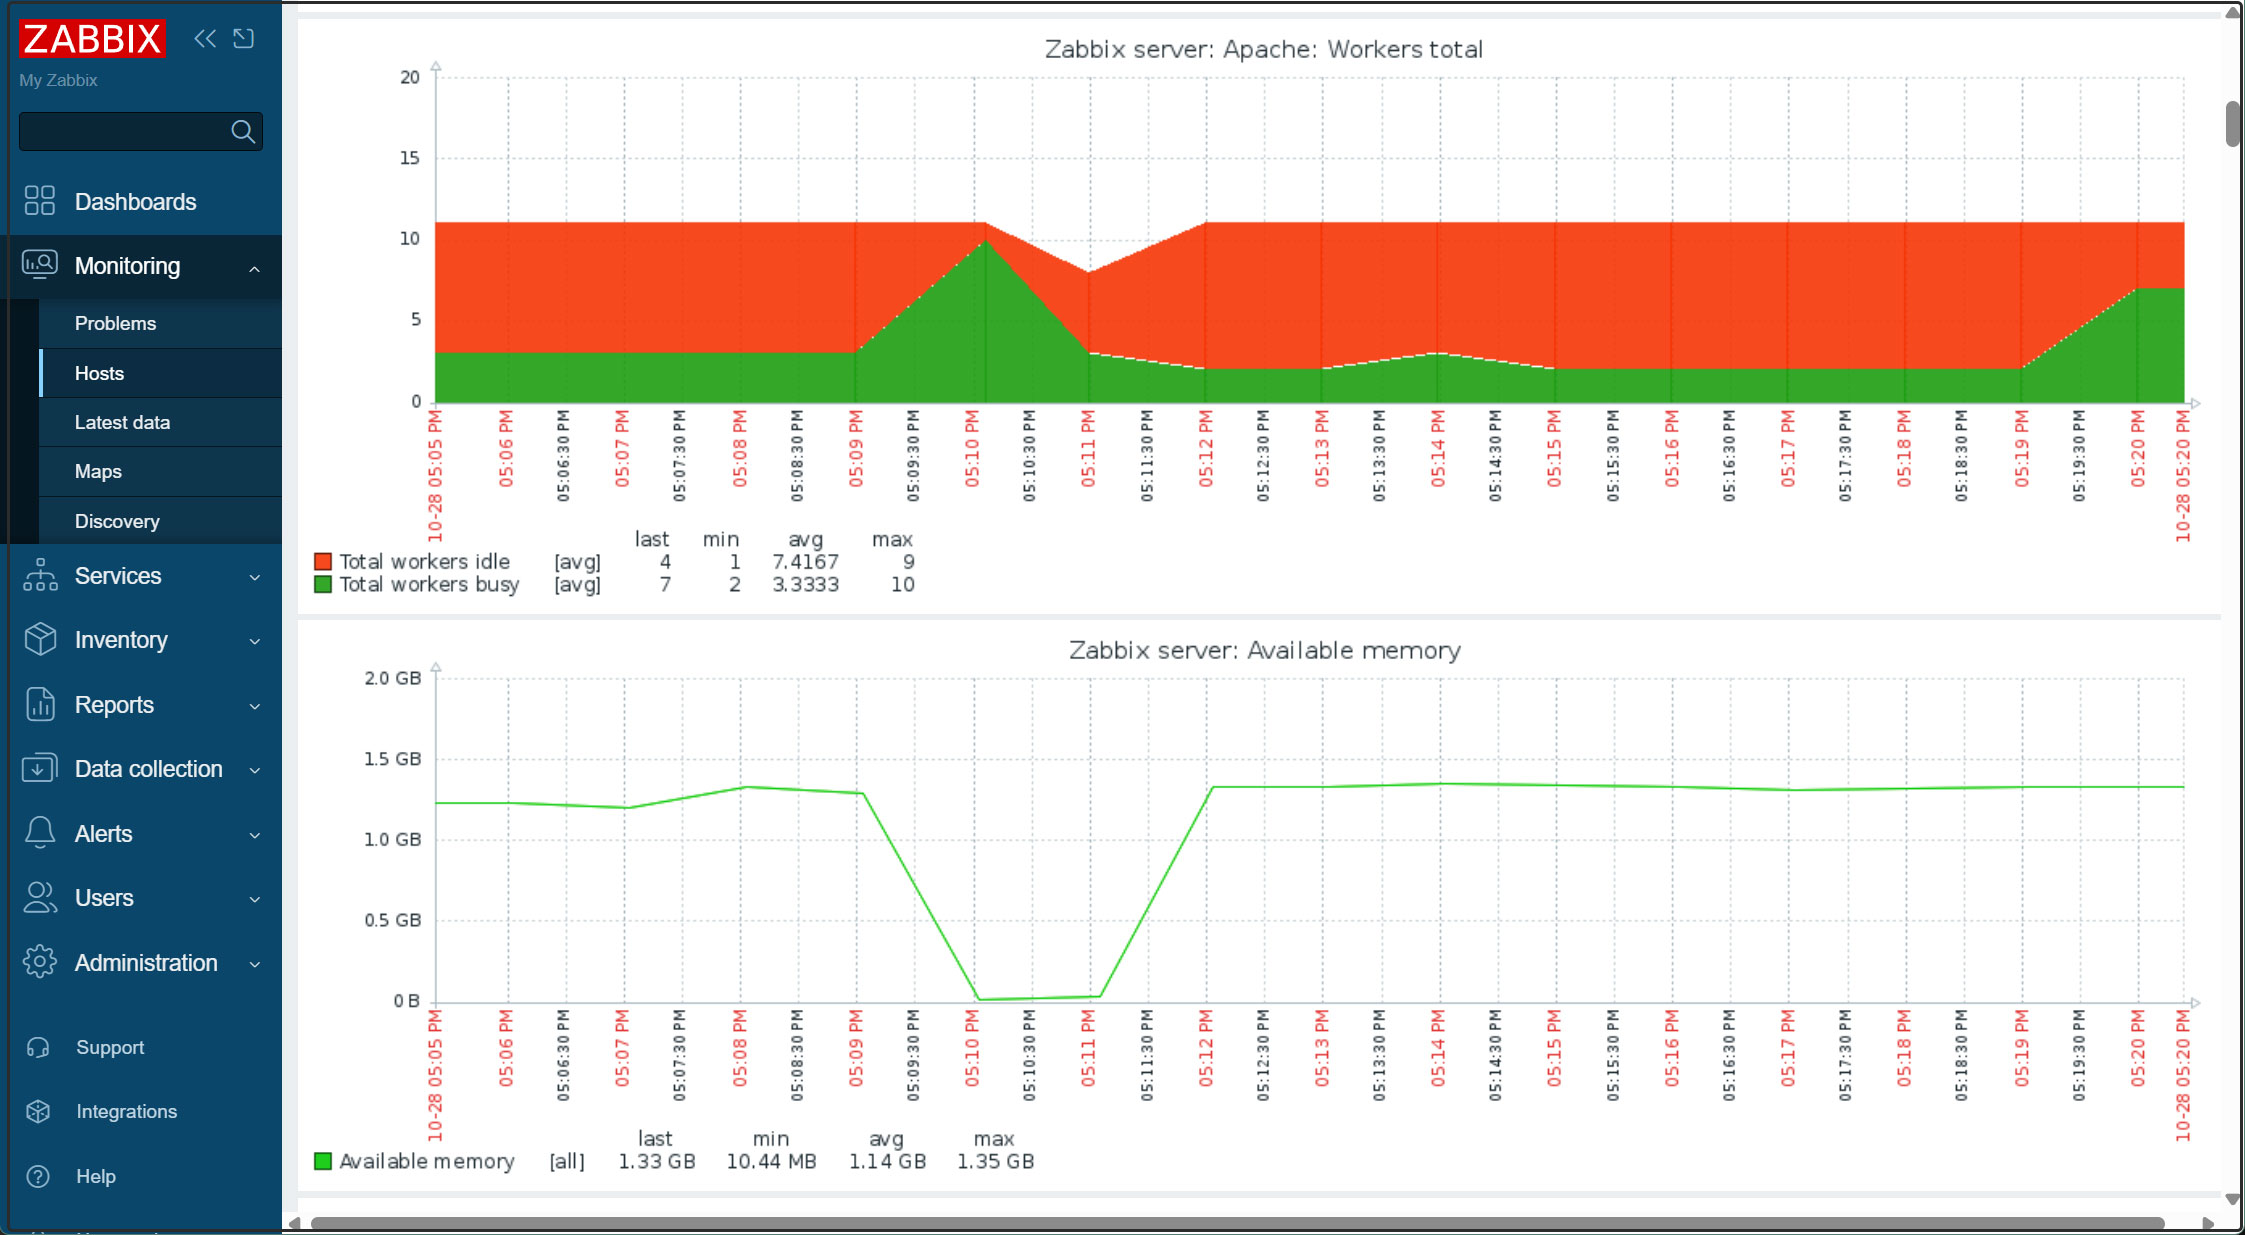
左ペインの[Monitoring][Hosts]、右ペインで[Zabbix server]をクリックし[Graphs]を選択する。
しばらくすると対象ホストのデータが表示されるようになる