

前提条件
今回はSuricata IDS と ElasticStack を 次のサーバーにインストールします
・1台目サーバー Suricata IDS & Filebeat : Debian13.7 IPアドレス(192.168.11.83)
・2台目サーバー Elasticsearch & kibana : Debian13.5 IPアドレス(192.168.11.85)
root以外のsudoユーザーで実行する
1台目サーバー Suricata インストール
SURICATA IDS/IPSはネットワーク上の通信を監視し、不審なトラフィックを検知するオープンソースのIDSです。基本的な仕組みはシグネチャ型であるため、あらかじめ設定した不正な通信を検知できます。また、Suricataは検知だけでなく防御も行えることが特徴です。
1.Suricata のインストール
①必須パッケージをインストール
# apt -y install wget curl dirmngr apt-transport-https gnupg2 ca-certificates lsb-release debian-archive-keyring unzip
➁Suricata のインストール
# apt update
# apt -y install suricata
バージョンの確認
# suricata -V
This is Suricata version 7.0.10 RELEASE
システムの再起動時に実行されるように suricata.service を有効にします
# systemctl enable suricata.service
Synchronizing state of suricata.service with SysV service script with /usr/lib/systemd/systemd-sysv-install.
Executing: /usr/lib/systemd/systemd-sysv-install enable suricata
Suricataサービスを最初に構成する必要があるため、サービスを停止します。
# systemctl stop suricata.service
2.Suricataを構成
①Suricataがネットワークパケットを検査するインターフェースとIPアドレスを決定
# ip --brief add
lo               UNKNOWN        127.0.0.1/8 ::1/128
ens33            UP             192.168.11.83/24 fe80::20c:29ff:fe8b:5daa/64
➁suricata.設定ファイル編集
# vi /etc/suricata/suricata.yaml

18行目 : 変更(自ネットワーク)
HOME_NET: "[192.168.11.0/24]"

136行目あたり : 変更
community-id: false → community-id: true

622行目あたり : 変更
af-packet:
  - interface: eth0
↓
af-packet:
  - interface: ens33 ←各自のインターフェース名に変更
➂ルールセットを追加
Suricata には suricata-update というツールがあり、外部プロバイダーからルールセットを取得することができます。以下のように実行すると、SURICATAサーバーの最新のルールセットをダウンロードできます
# suricata-update -o /var/lib/suricata/rules

-------------------------------------------------------------
17/9/2026 -- 12:19:44 - <Info> -- Ignoring file f625293e2432dbf07497d06349de6f0b/rules/emerging-deleted.rules
17/9/2026 -- 12:19:45 - <Info> -- Loaded 68724 rules.
17/9/2026 -- 12:19:46 - <Info> -- Disabled 15 rules.
17/9/2026 -- 12:19:46 - <Info> -- Enabled 0 rules.
17/9/2026 -- 12:19:46 - <Info> -- Modified 0 rules.
17/9/2026 -- 12:19:46 - <Info> -- Dropped 0 rules.
17/9/2026 -- 12:19:46 - <Info> -- Enabled 136 rules for flowbit dependencies.
17/9/2026 -- 12:19:46 - <Info> -- Backing up current rules.
17/9/2026 -- 12:19:46 - <Info> -- Writing rules to /var/lib/suricata/rules/suricata.rules: total: 68724; enabled: 52770; added: 68724; removed 0; modified: 0
17/9/2026 -- 12:19:46 - <Info> -- Writing /var/lib/suricata/rules/classification.config
17/9/2026 -- 12:19:46 - <Info> -- Testing with suricata -T.
17/9/2026 -- 12:20:15 - <Info> -- Done.
suricata-updateが無料のEmerging Threats ET Open Rulesを取得し、Suricataの/etc/suricata/rules/suricata.rulesファイルに保存したことを示しています。また、処理されたルールの数を示し、この例では68724が追加され、そのうち52770が有効になりました。
④ルール・セット・プロバイダーの追加
既定のプロバイダー リストを一覧表示
# suricata-update list-sources

Name: abuse.ch/feodotracker
  Vendor: Abuse.ch
  Summary: Abuse.ch Feodo Tracker Botnet C2 IP ruleset
  License: CC0-1.0
Name: abuse.ch/sslbl-blacklist
  Vendor: Abuse.ch
  Summary: Abuse.ch SSL Blacklist
  License: CC0-1.0
  Replaces: sslbl/ssl-fp-blacklist
Name: abuse.ch/sslbl-c2
  Vendor: Abuse.ch
  Summary: Abuse.ch Suricata Botnet C2 IP Ruleset
  License: CC0-1.0
Name: abuse.ch/sslbl-ja3
  Vendor: Abuse.ch
  Summary: Abuse.ch Suricata JA3 Fingerprint Ruleset
  License: CC0-1.0
  Replaces: sslbl/ja3-fingerprints
Name: abuse.ch/urlhaus
  Vendor: abuse.ch
  Summary: Abuse.ch URLhaus Suricata Rules
  License: CC0-1.0
Name: aleksibovellan/nmap
  Vendor: aleksibovellan
  Summary: Suricata IDS/IPS Detection Rules Against NMAP Scans
  License: MIT
Name: et/open
  Vendor: Proofpoint
  Summary: Emerging Threats Open Ruleset
  License: MIT
Name: et/pro
  Vendor: Proofpoint
  Summary: Emerging Threats Pro Ruleset
  License: Commercial
  Replaces: et/open
  Parameters: secret-code
  Subscription: https://www.proofpoint.com/us/threat-insight/et-pro-ruleset
Name: etnetera/aggressive
  Vendor: Etnetera a.s.
  Summary: Etnetera aggressive IP blacklist
  License: MIT
Name: oisf/trafficid
  Vendor: OISF
  Summary: Suricata Traffic ID ruleset
  License: MIT
Name: pawpatrules
  Vendor: pawpatrules
  Summary: PAW Patrules is a collection of rules for IDPS / NSM Suricata engine
  License: CC-BY-SA-4.0
Name: ptrules/open
  Vendor: Positive Technologies
  Summary: Positive Technologies Open Ruleset
  License: Custom
Name: scwx/enhanced
  Vendor: Secureworks
  Summary: Secureworks suricata-enhanced ruleset
  License: Commercial
  Parameters: secret-code
  Subscription: https://www.secureworks.com/contact/ (Please reference CTU Countermeasures)
Name: scwx/malware
  Vendor: Secureworks
  Summary: Secureworks suricata-malware ruleset
  License: Commercial
  Parameters: secret-code
  Subscription: https://www.secureworks.com/contact/ (Please reference CTU Countermeasures)
Name: scwx/security
  Vendor: Secureworks
  Summary: Secureworks suricata-security ruleset
  License: Commercial
  Parameters: secret-code
  Subscription: https://www.secureworks.com/contact/ (Please reference CTU Countermeasures)
Name: stamus/lateral
  Vendor: Stamus Networks
  Summary: Lateral movement rules
  License: GPL-3.0-only
Name: stamus/nrd-14-open
  Vendor: Stamus Networks
  Summary: Newly Registered Domains Open only - 14 day list, complete
  License: Commercial
  Parameters: secret-code
  Subscription: https://www.stamus-networks.com/stamus-labs/subscribe-to-threat-intel-feed
Name: stamus/nrd-30-open
  Vendor: Stamus Networks
  Summary: Newly Registered Domains Open only - 30 day list, complete
  License: Commercial
  Parameters: secret-code
  Subscription: https://www.stamus-networks.com/stamus-labs/subscribe-to-threat-intel-feed
Name: stamus/nrd-entropy-14-open
  Vendor: Stamus Networks
  Summary: Newly Registered Domains Open only - 14 day list, high entropy
  License: Commercial
  Parameters: secret-code
  Subscription: https://www.stamus-networks.com/stamus-labs/subscribe-to-threat-intel-feed
Name: stamus/nrd-entropy-30-open
  Vendor: Stamus Networks
  Summary: Newly Registered Domains Open only - 30 day list, high entropy
  License: Commercial
  Parameters: secret-code
  Subscription: https://www.stamus-networks.com/stamus-labs/subscribe-to-threat-intel-feed
Name: stamus/nrd-phishing-14-open
  Vendor: Stamus Networks
  Summary: Newly Registered Domains Open only - 14 day list, phishing
  License: Commercial
  Parameters: secret-code
  Subscription: https://www.stamus-networks.com/stamus-labs/subscribe-to-threat-intel-feed
Name: stamus/nrd-phishing-30-open
  Vendor: Stamus Networks
  Summary: Newly Registered Domains Open only - 30 day list, phishing
  License: Commercial
  Parameters: secret-code
  Subscription: https://www.stamus-networks.com/stamus-labs/subscribe-to-threat-intel-feed
Name: tgreen/hunting
  Vendor: tgreen
  Summary: Threat hunting rules
  License: GPLv3
例としてtgreen/hunting ルールセットを含める場合
# suricata-update enable-source tgreen/hunting

17/9/2026 -- 12:21:34 - <Info> -- Using data-directory /var/lib/suricata.
17/9/2026 -- 12:21:34 - <Info> -- Using Suricata configuration /etc/suricata/suricata.yaml
17/9/2026 -- 12:21:34 - <Info> -- Using /etc/suricata/rules for Suricata provided rules.
17/9/2026 -- 12:21:34 - <Info> -- Found Suricata version 7.0.10 at /usr/bin/suricata.
17/9/2026 -- 12:21:34 - <Warning> -- Source index does not exist, will use bundled one.
17/9/2026 -- 12:21:34 - <Warning> -- Please run suricata-update update-sources.
17/9/2026 -- 12:21:34 - <Info> -- Creating directory /var/lib/suricata/update/sources
17/9/2026 -- 12:21:34 - <Info> -- Enabling default source et/open
17/9/2026 -- 12:21:34 - <Info> -- Source tgreen/hunting enabled
アップデートを実行
# suricata-update update-sources
3.Suricata 構成のテスト
①設定ファイルのテスト
# suricata -T -c /etc/suricata/suricata.yaml -v

Notice: suricata: This is Suricata version 7.0.10 RELEASE running in SYSTEM mode
Info: cpu: CPUs/cores online: 2
Info: suricata: Running suricata under test mode
Info: suricata: Setting engine mode to IDS mode by default
Info: exception-policy: master exception-policy set to: auto
Info: logopenfile: fast output device (regular) initialized: fast.log
Info: logopenfile: eve-log output device (regular) initialized: eve.json
Info: logopenfile: stats output device (regular) initialized: stats.log
Info: detect: 1 rule files processed. 52770 rules successfully loaded, 0 rules failed, 0
Info: threshold-config: Threshold config parsed: 0 rule(s) found
Info: detect: 52775 signatures processed. 1228 are IP-only rules, 4534 are inspecting packet payload, 46778 inspect application layer, 109 are decoder event only
Notice: suricata: Configuration provided was successfully loaded. Exiting.
Suricata service起動
# systemctl start suricata
ステータス確認
# systemctl status suricata

● suricata.service - Suricata IDS/IDP daemon
     Loaded: loaded (/usr/lib/systemd/system/suricata.service; enabled; preset: enabled)
     Active: active (running) since Thu 2026-09-17 12:23:24 JST; 7s ago
 Invocation: d9bf19666dd24f7fac9554e6d8962bb1
       Docs: man:suricata(8)
             man:suricatasc(8)
             https://suricata.io/documentation/
    Process: 21345 ExecStart=/usr/bin/suricata -D --af-packet -c /etc/suricata/suricata.yaml --pidfile /run/suricata.pid (code=exited, status=0/SUCCESS)
   Main PID: 21346 (Suricata-Main)
      Tasks: 1 (limit: 4553)
     Memory: 194.7M (peak: 194.7M)
        CPU: 7.820s
     CGroup: /system.slice/suricata.service
             └─21346 /usr/bin/suricata -D --af-packet -c /etc/suricata/suricata.yaml --pidfile /run/suricata.pid

Sep 17 12:23:24 Lepard systemd[1]: Starting suricata.service - Suricata IDS/IDP daemon...
Sep 17 12:23:24 Lepard suricata[21345]: i: suricata: This is Suricata version 7.0.10 RELEASE running in SYSTEM mode
Sep 17 12:23:24 Lepard systemd[1]: Started suricata.service - Suricata IDS/IDP daemon.
ログファイルを確認
# tail -f /var/log/suricata/suricata.log

[21345 - Suricata-Main] 2026-09-17 12:23:24 Notice: suricata: This is Suricata version 7.0.10 RELEASE running in SYSTEM mode
[21345 - Suricata-Main] 2026-09-17 12:23:24 Info: cpu: CPUs/cores online: 2
[21345 - Suricata-Main] 2026-09-17 12:23:24 Info: suricata: Setting engine mode to IDS mode by default
[21345 - Suricata-Main] 2026-09-17 12:23:24 Info: exception-policy: master exception-policy set to: auto
[21346 - Suricata-Main] 2026-09-17 12:23:24 Info: logopenfile: fast output device (regular) initialized: fast.log
[21346 - Suricata-Main] 2026-09-17 12:23:24 Info: logopenfile: eve-log output device (regular) initialized: eve.json
[21346 - Suricata-Main] 2026-09-17 12:23:24 Info: logopenfile: stats output device (regular) initialized: stats.log
[21346 - Suricata-Main] 2026-09-17 12:23:41 Info: detect: 1 rule files processed. 52770 rules successfully loaded, 0 rules failed, 0
[21346 - Suricata-Main] 2026-09-17 12:23:41 Info: threshold-config: Threshold config parsed: 0 rule(s) found
[21346 - Suricata-Main] 2026-09-17 12:23:41 Info: detect: 52775 signatures processed. 1228 are IP-only rules, 4534 are inspecting packet payload, 46778 inspect application layer, 109 are decoder event only
[21346 - Suricata-Main] 2026-09-17 12:23:53 Warning: af-packet: ens33: AF_PACKET tpacket-v3 is recommended for non-inline operation
[21346 - Suricata-Main] 2026-09-17 12:23:53 Info: runmodes: ens33: creating 2 threads
[21346 - Suricata-Main] 2026-09-17 12:23:53 Info: unix-manager: unix socket '/var/run/suricata-command.socket'
[21346 - Suricata-Main] 2026-09-17 12:23:53 Notice: threads: Threads created -> W: 2 FM: 1 FR: 1   Engine started.
4.Suricata Custom Rulesを作成し、テストする
①カスタマールールを含むファイルを作成
# vi /var/lib/suricata/rules/local.rules
下記内容を記載
alert icmp any any -> any any (msg:"ICMP Ping"; sid:100000; rev:1;)
②設定ファイルを編集(新しいルールのパスを定義)
# vi /etc/suricata/suricata.yaml

# 2200行目あたりに追記
default-rule-path: /var/lib/suricata/rules

rule-files:
  - suricata.rules
  - local.rules
③設定ファイルのテスト
# suricata -T -c /etc/suricata/suricata.yaml -v

Info: cpu: CPUs/cores online: 2
Info: suricata: Running suricata under test mode
Info: suricata: Setting engine mode to IDS mode by default
Info: exception-policy: master exception-policy set to: auto
Info: logopenfile: fast output device (regular) initialized: fast.log
Info: logopenfile: eve-log output device (regular) initialized: eve.json
Info: logopenfile: stats output device (regular) initialized: stats.log
Info: detect: 2 rule files processed. 53026 rules successfully loaded, 0 rules failed, 0
Info: threshold-config: Threshold config parsed: 0 rule(s) found
Info: detect: 53031 signatures processed. 1229 are IP-only rules, 4651 are inspecting packet payload, 46916 inspect application layer, 109 are decoder event only
Notice: suricata: Configuration provided was successfully loaded. Exiting.
Suricat service再起動
# systemctl restart suricata
④Custom Rulesの適用テスト
同一ローカルネットワーク上の別のデバイスでpingを実行し、ログに記録されたかどうかを確認する
# cat /var/log/suricata/fast.log
09/18/2026-09:00:22.524168  [**] [1:100000:1] ICMP Ping [**] [Classification: (null)] [Priority: 3] {ICMP} 192.168.11.14:8 -> 192.168.11.83:0
09/18/2026-08:34:33.328174  [**] [1:100000:1] ICMP Ping [**] [Classification: (null)] [Priority: 3] {ICMP} 192.168.11.83:0 -> 192.168.11.14:0
JSON形式のログを取得するには、システムにjqをインストールする
# apt -y install jq
下記コマンドを実行し、同一ローカルネットワーク上の別のデバイスでpingを実行する
# tail -f /var/log/suricata/eve.json | jq 'select(.event_type=="alert")'
pingを実行するとコンソールに下記のように表示される
{
  "timestamp": "2026-09-18T09:00:22.524168+0900",
  "flow_id": 1969812594701091,
  "in_iface": "ens33",
  "event_type": "alert",
  "src_ip": "192.168.11.14",
  "dest_ip": "192.168.11.83",
  "proto": "ICMP",
  "icmp_type": 8,
  "icmp_code": 0,
  "pkt_src": "wire/pcap",
  "community_id": "1:K09ijpWpwrp7sSrxOGACqhHkilo=",
  "alert": {
    "action": "allowed",
    "gid": 1,
    "signature_id": 100000,
    "rev": 1,
    "signature": "ICMP Ping",
    "category": "",
    "severity": 3
  },
5.SURICATAを再設定し、IPSモードで再起動する
SURICATAはデフォルトではIDSモードで動作し、積極的にネットワークトラフィックをブロックすることはありません。IPSモードに切り替えるには、SURICATAのデフォルト設定を変更する必要がある。
5.1 nfqueueモードの有効化
# vi /usr/lib/systemd/system/suricata.service

下記のとおり変更する
[Service]
#ExecStart=/usr/bin/suricata -D --af-packet -c /etc/suricata/suricata.yaml - -pidfile /run/suricata.pid
ExecStart=/usr/bin/suricata -D -q 0 -c /etc/suricata/suricata.yaml --pidfile /run/suricata.pid
設定をリロードして、suricataを再起動
# systemctl daemon-reload
# systemctl restart suricata.service
5.2 Suricataにトラフィックを送信するためのUFWの設定
# vi /etc/ufw/before.rules

19行目に下記を追加
# Don't delete these required lines, otherwise there will be errors
*filter
:ufw-before-input - [0:0]
:ufw-before-output - [0:0]
:ufw-before-forward - [0:0]
:ufw-not-local - [0:0]
# End required lines

## Start Suricata NFQUEUE rules
-I INPUT 1 -p tcp --dport 2244 -j NFQUEUE --queue-bypass
-I OUTPUT 1 -p tcp --sport 2244 -j NFQUEUE --queue-bypass
-I FORWARD -j NFQUEUE
-I INPUT 2 -j NFQUEUE
-I OUTPUT 2 -j NFQUEUE
## End Suricata NFQUEUE rules
IPv6も同様に下記ファイルを編集する
# vi /etc/ufw/before6.rules
UFWサービスを再起動する
# systemctl restart ufw.service
Elastic stack 9.x インストール
Elastic Stackをインストール&設定して、SURICATAのログを可視化&検索できるようにする
本セクションは基本的には2台目のDebian13.5サーバーで行います
①Elastic stack 9.xのリポジトリ署名キーをインストール
# apt update
# apt -y install gnupg2
# wget -qO - https://artifacts.elastic.co/GPG-KEY-elasticsearch | \
gpg --dearmor -o /etc/apt/trusted.gpg.d/elastic.gpg
➁Elastic Stack 9.xのリポジトリをインストール
# echo "deb https://artifacts.elastic.co/packages/9.x/apt stable main" > /etc/apt/sources.list.d/elastic-9.x.list
update
# apt update
➂Elasticsearch 9.x をインストール
# apt install elasticsearch -y
インストール中、デフォルトでセキュリティ機能が有効になります;
--------------------------- Security autoconfiguration information ------------------------------

Authentication and authorization are enabled.
TLS for the transport and HTTP layers is enabled and configured.

The generated password for the elastic built-in superuser is : PLk-8MIiPy1VmyoSDLfh

If this node should join an existing cluster, you can reconfigure this with
'/usr/share/elasticsearch/bin/elasticsearch-reconfigure-node --enrollment-token <token-here>'
after creating an enrollment token on your existing cluster.

You can complete the following actions at any time:

Reset the password of the elastic built-in superuser with
'/usr/share/elasticsearch/bin/elasticsearch-reset-password -u elastic'.

Generate an enrollment token for Kibana instances with
 '/usr/share/elasticsearch/bin/elasticsearch-create-enrollment-token -s kibana'.

Generate an enrollment token for Elasticsearch nodes with
'/usr/share/elasticsearch/bin/elasticsearch-create-enrollment-token -s node'.

-------------------------------------------------------------------------------------------------
認証と認可が有効になっている。
トランスポート層とHTTP層のTLSが有効化され、設定されます。
Elasticスーパーユーザーアカウント(elastic)とそのパスワードが作成されます。
④Elasticsearch 9.x の設定
今回は基本的なシングルノードのクラスタなので、デフォルトの設定を使用します。
Elasticsearch の設定ファイル /etc/elasticsearch/elasticsearch.yml を確認すると、セキュリティの設定が有効になっていることがわかります
# cat /etc/elasticsearch/elasticsearch.yml

#----------------------- BEGIN SECURITY AUTO CONFIGURATION -----------------------
#
# The following settings, TLS certificates, and keys have been automatically
# generated to configure Elasticsearch security features on 17-09-2026 06:55:53
#
# --------------------------------------------------------------------------------

# Enable security features
xpack.security.enabled: true

xpack.security.enrollment.enabled: true

# Enable encryption for HTTP API client connections, such as Kibana, Logstash, and Agents
xpack.security.http.ssl:
  enabled: true
  keystore.path: certs/http.p12

# Enable encryption and mutual authentication between cluster nodes
xpack.security.transport.ssl:
  enabled: true
  verification_mode: certificate
  keystore.path: certs/transport.p12
  truststore.path: certs/transport.p12
# Create a new cluster with the current node only
# Additional nodes can still join the cluster later
cluster.initial_master_nodes: ["Lion"]

# Allow HTTP API connections from anywhere
# Connections are encrypted and require user authentication
http.host: 0.0.0.0

# Allow other nodes to join the cluster from anywhere
# Connections are encrypted and mutually authenticated
#transport.host: 0.0.0.0

#----------------------- END SECURITY AUTO CONFIGURATION -------------------------
⑤Elasticsearch起動
Elasticsearch を起動し、システム起動時に実行できるようにします
# systemctl daemon-reload
# systemctl enable --now elasticsearch
# systemctl start elasticsearch
ステータスを確認
# systemctl status elasticsearch

● elasticsearch.service - Elasticsearch
     Loaded: loaded (/usr/lib/systemd/system/elasticsearch.service; enabled; preset: enabled)
     Active: active (running) since Thu 2026-09-17 15:59:14 JST; 12s ago
 Invocation: 42f83b21e59f44b69f3bfa965766a021
       Docs: https://www.elastic.co
   Main PID: 1922 (server-launcher)
      Tasks: 100 (limit: 3421)
     Memory: 1.9G (peak: 1.9G)
        CPU: 49.755s
     CGroup: /system.slice/elasticsearch.service
             tq1922 /usr/share/elasticsearch/lib/tools/server-launcher/server-launcher -p /run/elasticsearch/elasticsearch.pid --quiet
             tq1972 /usr/share/elasticsearch/jdk/bin/java -Des.networkaddress.cache.ttl=60 -Des.networkaddress.cache.negative.ttl=10 -XX:+AlwaysPreTouch -Xss1m -Djava.awt.headless=true -Dfile.e>
             mq1995 /usr/share/elasticsearch/modules/x-pack-ml/platform/linux-x86_64/bin/controller

Sep 17 15:58:37 Lion systemd[1]: Starting elasticsearch.service - Elasticsearch...
Sep 17 15:58:40 Lion systemd-entrypoint[1922]: WARNING: Unknown module: org.apache.arrow.memory.core specified to --add-opens
Sep 17 15:59:06 Lion systemd-entrypoint[1922]: WARNING: A terminally deprecated method in sun.misc.Unsafe has been called
Sep 17 15:59:06 Lion systemd-entrypoint[1922]: WARNING: sun.misc.Unsafe::arrayBaseOffset has been called by com.google.protobuf.UnsafeUtil$MemoryAccessor (file:/usr/share/elasticsearch/modules/>
Sep 17 15:59:06 Lion systemd-entrypoint[1922]: WARNING: Please consider reporting this to the maintainers of class com.google.protobuf.UnsafeUtil$MemoryAccessor
Sep 17 15:59:06 Lion systemd-entrypoint[1922]: WARNING: sun.misc.Unsafe::arrayBaseOffset will be removed in a future release
Sep 17 15:59:14 Lion systemd[1]: Started elasticsearch.service - Elasticsearch.
curlコマンドを使用してESのステータスを確認することもできます。IPは適宜置き換えてください
# curl https://192.168.11.85:9200 --cacert /etc/elasticsearch/certs/http_ca.crt -u elastic
プロンプトが表示されたら、Elasticsearchのインストール時に生成されたElasticsearchパスワードを入力します
以下のように出力される
Enter host password for user 'elastic':  ←Password
{
  "name" : "Lion",
  "cluster_name" : "elasticsearch",
  "cluster_uuid" : "56bp6AXRRpC0AqJGw6Ov-g",
  "version" : {
    "number" : "9.5.4",
    "build_flavor" : "default",
    "build_type" : "deb",
    "build_hash" : "9170df19cae1adb107b7b489b4d82dec66d7a337",
    "build_date" : "2026-09-09T22:42:53.976833287Z",
    "build_snapshot" : false,
    "lucene_version" : "10.5.1",
    "minimum_wire_compatibility_version" : "8.19.0",
    "minimum_index_compatibility_version" : "8.0.0"
  },
  "tagline" : "You Know, for Search"
}
また、HTTPポートとトランスポートポートの両方が開いていることを確認する;
# ss -altnp | grep -E "9200|9300"

LISTEN 0      4096                    *:9200            *:*    users:(("java",pid=19343,fd=838))
LISTEN 0      4096   [::ffff:127.0.0.1]:9300            *:*    users:(("java",pid=19343,fd=836))
LISTEN 0      4096                [::1]:9300         [::]:*    users:(("java",pid=19343,fd=835))
⑥Elasticsearch パスワードのリセット
自動生成されたElasticユーザーパスワードが複雑すぎるので、/usr/share/elasticsearch/bin/elasticsearch-reset-passwordコマンドを使ってリセットする
パスワードをリセットするには、コマンドを実行する
# /usr/share/elasticsearch/bin/elasticsearch-reset-password -u elastic -i

This tool will reset the password of the [elastic] user.
You will be prompted to enter the password.
Please confirm that you would like to continue [y/N]y


Enter password for [elastic]:
Re-enter password for [elastic]:
Password for the [elastic] user successfully reset.
⑦Elasticsearch ログ
Elasticsearchは/var/log/elasticsearchパスにログを書き込みます。Elasticsearch インスタンスに問題がある場合に確認する必要があるログは /var/log/elasticsearch/CLUSTER_NAME.log です。
CLUSTER_NAME は elasticsearch.yaml ファイルの cluster.name オプションの値です。もしこの値を変更しなかった場合、デフォルトは elasticsearch となり、ログファイルは /var/log/elasticsearch/elasticsearch.log となります。
# tail -f /var/log/elasticsearch/elasticsearch.log

[2026-09-17T15:59:19,654][INFO ][o.e.x.i.IndexLifecycleTransition] [Lion] moving index [.ds-.logs-elasticsearch.deprecation-default-2026.09.17-000001] from [{"phase":"hot","action":"unfollow","name":"branch-check-unfollow-prerequisites"}] to [{"phase":"hot","action":"rollover","name":"check-rollover-ready"}] in policy [.deprecation-indexing-ilm-policy]
[2026-09-17T15:59:19,681][INFO ][o.e.c.m.MetadataMappingService] [Lion] [.ds-.logs-elasticsearch.deprecation-default-2026.09.17-000001/qVV3sQcqTT6syGQg-lzv7w] update_mapping [_doc]
[2026-09-17T15:59:24,591][INFO ][o.e.c.m.MetadataCreateIndexService] [Lion] creating index [.ds-ilm-history-7-2026.09.17-000001] in project [default], cause [initialize_data_stream], templates [provided in request], shards [1]/[1]
[2026-09-17T15:59:24,593][INFO ][o.e.c.m.MetadataCreateDataStreamService] [Lion] adding data stream [ilm-history-7] with write index [.ds-ilm-history-7-2026.09.17-000001], backing indices [], and aliases []
[2026-09-17T15:59:24,594][INFO ][o.e.c.r.a.AllocationService] [Lion] in project [default] updating number_of_replicas to [0] for indices [.ds-ilm-history-7-2026.09.17-000001]
[2026-09-17T15:59:24,682][INFO ][o.e.c.r.a.AllocationService] [Lion] current.health="GREEN" message="Cluster health status changed from [YELLOW] to [GREEN] (reason: [shards started [[.ds-ilm-history-7-2026.09.17-000001][0]]])." previous.health="YELLOW" reason="shards started [[.ds-ilm-history-7-2026.09.17-000001][0]]"
[2026-09-17T16:01:46,283][INFO ][o.e.x.s.a.f.FileUserPasswdStore] [Lion] users file [/etc/elasticsearch/users] changed. updating users...
[2026-09-17T16:01:46,288][INFO ][o.e.x.s.a.f.FileUserRolesStore] [Lion] users roles file [/etc/elasticsearch/users_roles] changed. updating users roles...
[2026-09-17T16:02:06,299][INFO ][o.e.x.s.a.f.FileUserPasswdStore] [Lion] users file [/etc/elasticsearch/users] changed. updating users...
[2026-09-17T16:02:06,302][INFO ][o.e.x.s.a.f.FileUserRolesStore] [Lion] users roles file [/etc/elasticsearch/users_roles] changed. updating users roles...
Kibana 9.x インストール
本セクションも2台目のDebian13.5サーバーで行います
①インストール
# apt -y install kibana

Installing:
  kibana

Summary:
  Upgrading: 0, Installing: 1, Removing: 0, Not Upgrading: 0
  Download size: 482 MB
  Space needed: 1,579 MB / 28.1 GB available

Get:1 https://artifacts.elastic.co/packages/9.x/apt stable/main amd64 kibana amd64 9.5.4 [482 MB]
Fetched 482 MB in 14s (34.2 MB/s)
Selecting previously unselected package kibana.
(Reading database ... 37543 files and directories currently installed.)
Preparing to unpack .../kibana_9.5.4_amd64.deb ...
Unpacking kibana (9.5.4) ...
Setting up kibana (9.5.4) ...
Creating kibana group... OK
Creating kibana user... OK
Created Kibana keystore in /etc/kibana/kibana.keystore
➁Kibana 9 を設定
Kibana はデフォルトで localhost:5601 で実行されるように設定されている。外部からのアクセスを許可するには、設定ファイルを編集し、server.hostの値をインターフェイスIPに置き換える。
# vi /etc/kibana/kibana.yml

6行目 : コメントを外す
server.port: 5601
12行目当たりに追加
# To allow connections from remote users, set this parameter to a non-loopback address.
#server.host: "localhost"
server.host: "192.168.11.85"
➂Kibana-Elasticsearch Enrollment Token の生成
Kibana インスタンスを、セキュリティ機能が有効になっている既存の Elasticsearch クラスタと通信するように設定するには、登録トークンが必要です。Kibana 用の Enrollment Token は以下のコマンドで生成できる
# /usr/share/elasticsearch/bin/elasticsearch-create-enrollment-token -s kibana

eyJ2ZXIiOiI4LjE0LjAiLCJhZHIiOlsiMTkyLjE2OC4xMS44NTo5MjAwIl0sImZnciI6ImNjMGFiYmZkM2NjZDIwMjI1OWE5YWVkNGJiZDg3MTliYjAwMjc3ZTU1YzJjYTQxNDliYTg0ZTcxNjA1YjJmYjUiLCJrZXkiOiI3bzk4cnFBQmFqOXRtcXBjQVpfbDpUZWY5andIZG9qUl9uUmgyN0dqQ05nIn0=
④Kibana 暗号化キーの生成
Kibana は、Kibana 関連インデックスのデータの暗号化からセッション情報の保存まで、いくつかの領域で暗号化キーを使用する。必要なキーは次のとおりです
xpack.encryptedSavedObjects.encryptionKey:ダッシュボードやビジュアライゼーションなどの保存されたオブジェクトを暗号化するために使用されます。xpack.reporting.encryptionKey: 保存されたレポートの暗号化に使用xpack.security.encryptionKey: セッション情報の暗号化に使用
これらは以下のコマンドで生成する
# /usr/share/kibana/bin/kibana-encryption-keys generate

Settings:
xpack.encryptedSavedObjects.encryptionKey: 910c507e0001c103cbc5ef7a90ca20e9c80bb94fad71607ac4730d713e605edd
xpack.reporting.encryptionKey: 8124bef4fa7733abb4a0e1bb889d72c2d667536d6d066866a98985c38d4d9834
xpack.security.encryptionKey: 9599dc2ef402656d062bbdd29285bb5f2a8888bc86aa940b2ec83fdf926b0d70
上記をKibanaの設定ファイルkibana.ymlに挿入する
# echo -e "xpack.encryptedSavedObjects.encryptionKey: 910c507e0001c103cbc5ef7a90ca20e9c80bb94fad71607ac4730d713e605edd
xpack.reporting.encryptionKey: 8124bef4fa7733abb4a0e1bb889d72c2d667536d6d066866a98985c38d4d9834
xpack.security.encryptionKey: 9599dc2ef402656d062bbdd29285bb5f2a8888bc86aa940b2ec83fdf926b0d70" >> /etc/kibana/kibana.yml
⑤Kibana の実行
Kibana 9 を起動し、システム起動時に実行できるようにする。
# systemctl enable --now kibana
# systemctl start kibana
ステータス確認
# systemctl status kibana

● kibana.service - Kibana
     Loaded: loaded (/usr/lib/systemd/system/kibana.service; enabled; preset: enabled)
     Active: active (running) since Thu 2026-09-17 17:31:01 JST; 48s ago
 Invocation: e6c92198e4a844c389700ce9f16d2b43
       Docs: https://www.elastic.co
   Main PID: 19184 (MainThread)
      Tasks: 11 (limit: 3957)
     Memory: 888M (peak: 888.4M)
        CPU: 16.827s
     CGroup: /system.slice/kibana.service
             mq19184 /usr/share/kibana/bin/../node/default/bin/node /usr/share/kibana/bin/../node_modules/@kbn/cli/kibana/dist

Sep 17 17:31:09 Lion kibana[19184]: Native global console methods have been overridden in production environment.
Sep 17 17:31:14 Lion kibana[19184]: [2026-09-17T17:31:14.051+09:00][INFO ][root] Kibana is starting
Sep 17 17:31:14 Lion kibana[19184]: [2026-09-17T17:31:14.273+09:00][INFO ][node] Kibana process configured with roles: [background_tasks, ui]
Sep 17 17:31:30 Lion kibana[19184]: [2026-09-17T17:31:30.903+09:00][INFO ][plugins-service] The following plugins are disabled: "cloudChat,cloudExp>
Sep 17 17:31:30 Lion kibana[19184]: [2026-09-17T17:31:30.991+09:00][INFO ][http.server.Preboot] http server running at http://192.168.11.85:5601
Sep 17 17:31:31 Lion kibana[19184]: [2026-09-17T17:31:31.356+09:00][INFO ][plugins-system.preboot] Setting up [1] plugins: [interactiveSetup]
Sep 17 17:31:31 Lion kibana[19184]: [2026-09-17T17:31:31.405+09:00][INFO ][preboot] "interactiveSetup" plugin is holding setup: Validating Elastics>
Sep 17 17:31:31 Lion kibana[19184]: [2026-09-17T17:31:31.453+09:00][INFO ][root] Holding setup until preboot stage is completed.
Sep 17 17:31:39 Lion kibana[19184]: i Kibana has not been configured.
Sep 17 17:31:39 Lion kibana[19184]: Go to http://192.168.11.85:5601/?code=062853 to get started.
出力の最後のほうに以下のように表示される
Go to http://192.168.11.85:5601/?code=062853
提供されたKibanaのURL(codeを含む)をコピーしてラウザで使用し、Kibanaにアクセスしてセットアップを完了する。
同様に、Kibanaのログは/var/log/kibana/kibana.logと/var/log/syslogで利用できる。
⑥Kibana9 ダッシュボードにアクセスする
UFWが起動している場合は、Kibanaポートを開く
# ufw allow 5601/tcp
Rule added
# ufw reload
Firewall reloaded
http://192.168.11.85:5601/?code=062853 にアクセスすると、ウェルカムページでElasticの設定を求められます。
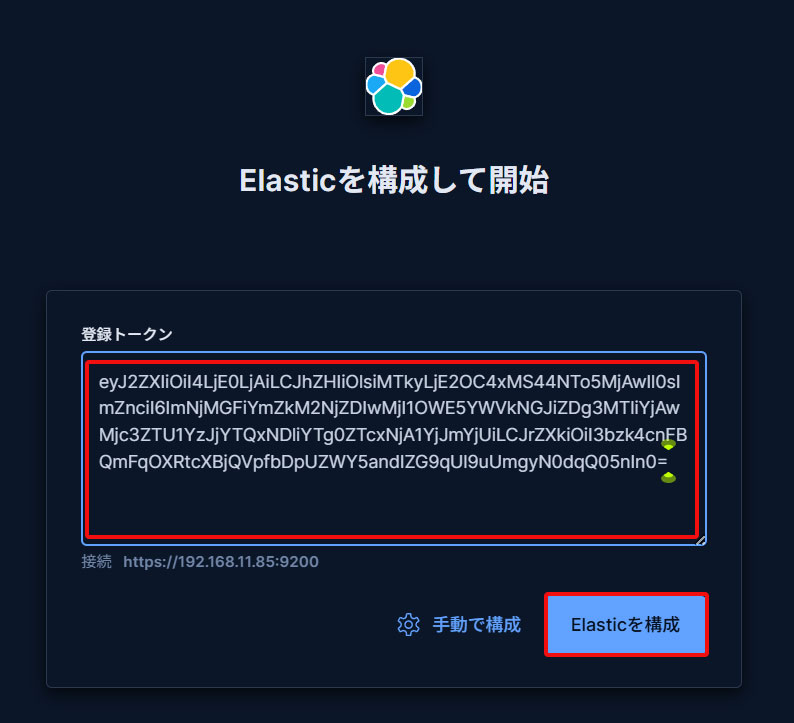
最初に、生成した登録トークンを入力する。
/usr/share/elasticsearch/bin/elasticsearch-create-enrollment-token -s kibana, コマンドを使用して生成された Kibana トークンをコピーし、ボックスに貼り付ける
[Elasticを構成]をクリックするとKibana が自動的に Elasticsearch に接続します。
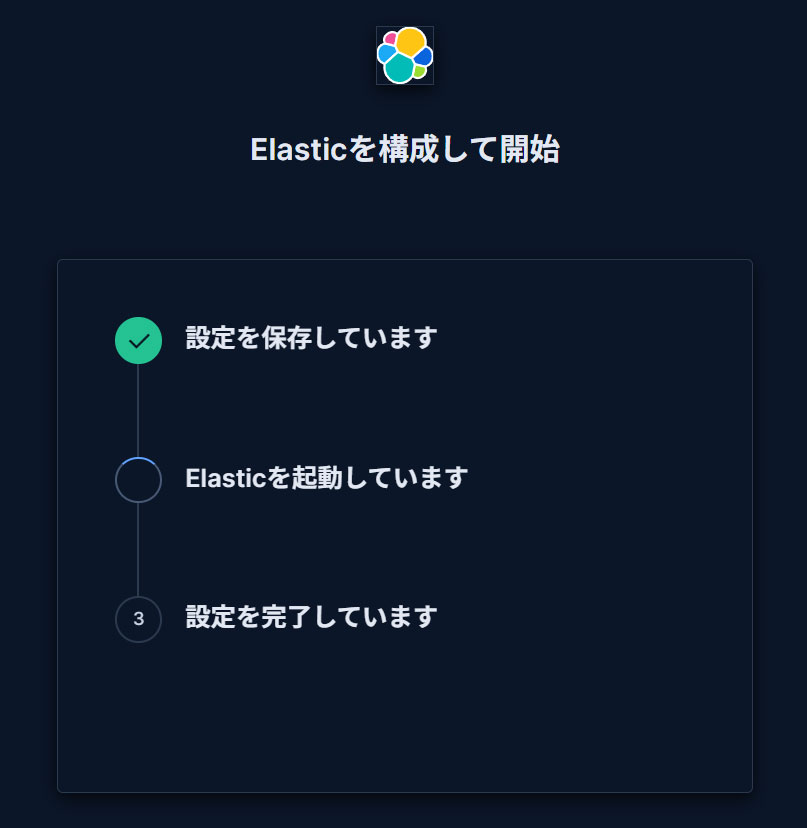
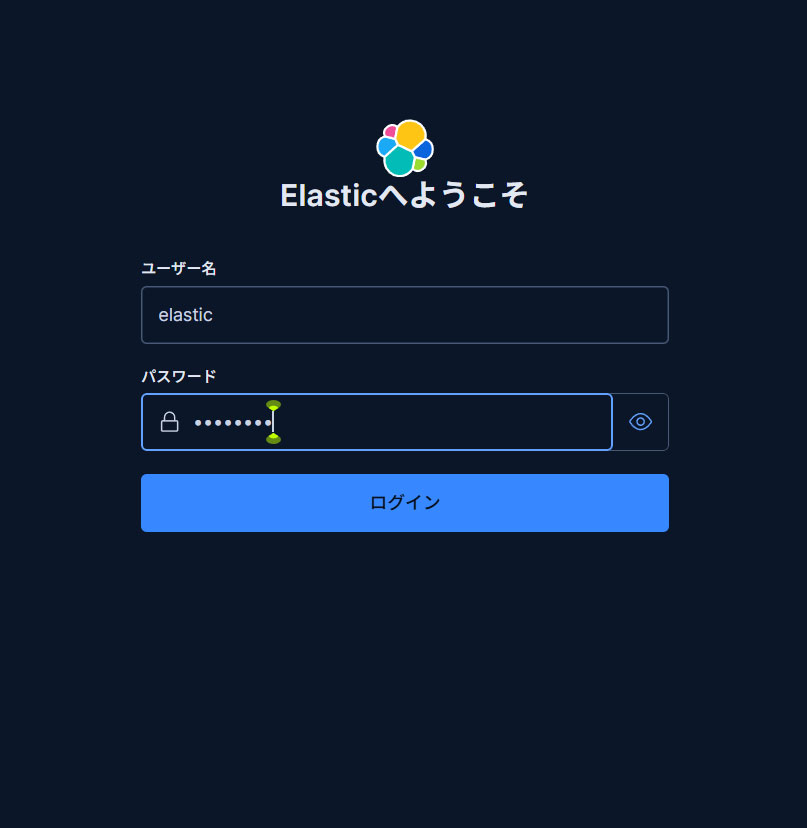
ログインページに移動します。生成されたElasticユーザー認証情報を使用してログインします。
ユーザー名 : elastic
パスワード : わかりやすく再生成したパスワード
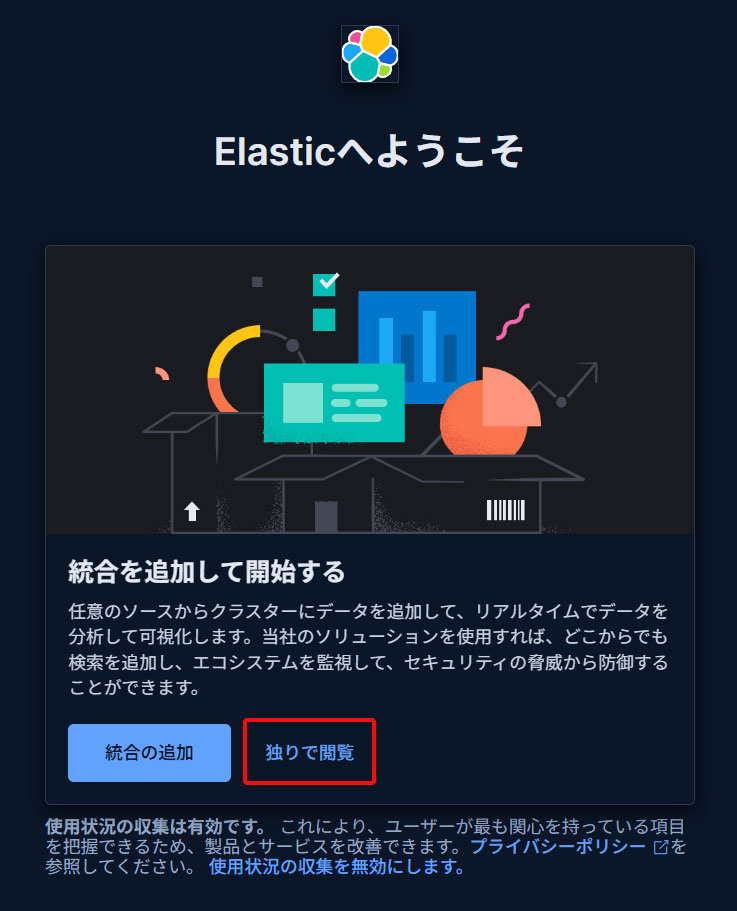
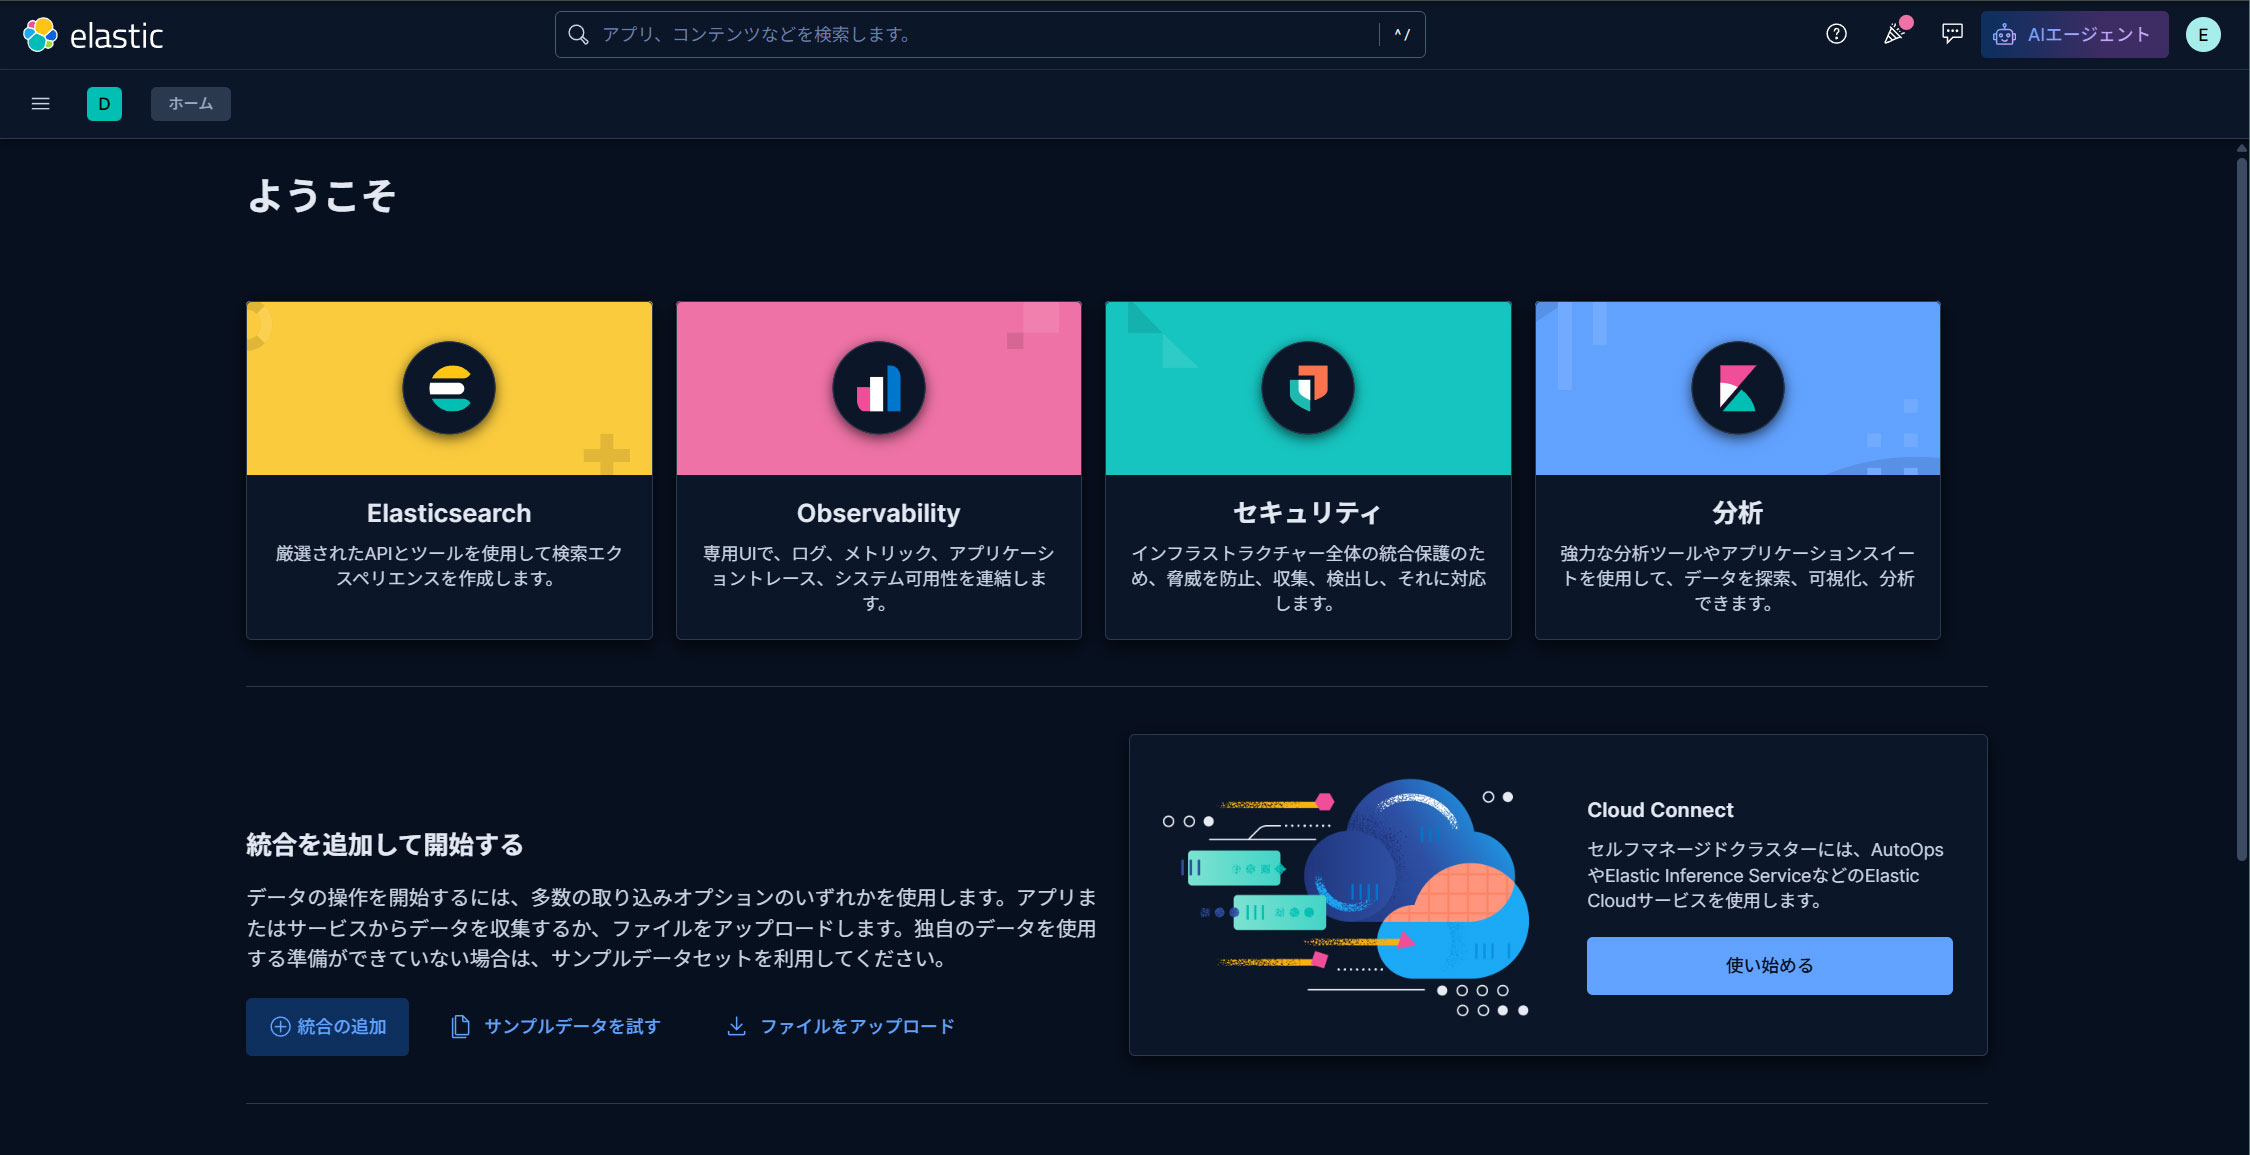
ウェルカムページで、今回は「独りで閲覧」をクリックしてKibana 9.xダッシュボードに進む。
Filebeat 9のインストール
ELKスタックを使用して1台目サーバーDebian13.7からログを収集して監視するには、Filebeatをインストールする必要があります。
本作業は1台目サーバー Debian13.7 IPアドレス(192.168.11.83)で行います。
①Elastic Reposをインストールする
Filebeat 9をインストールするには、Elastic 9.xリポジトリをインストールします
# wget -qO - https://artifacts.elastic.co/GPG-KEY-elasticsearch | \
gpg --dearmor > /etc/apt/trusted.gpg.d/elk.gpg

# echo "deb https://artifacts.elastic.co/packages/9.x/apt stable main" \
> /etc/apt/sources.list.d/elastic-9.list
update
# apt update
Filebeat 9をインストール
# apt -y install filebeat
➁Filebeat Loggingの設定
デフォルトのfilebeat設定ファイルは/etc/filebeat/filebeat.ymlです
Filebeatがログを独自のログファイルに書き込むようにするには、設定ファイルに以下の設定を入力する
# cat >> /etc/filebeat/filebeat.yml << 'EOL'
logging.level: info
logging.to_files: true
logging.files:
  path: /var/log/filebeat
  name: filebeat
  keepfiles: 7
  permissions: 0640
EOL
➂Filebeatをデータ処理系に接続する
Filebeatをデータ処理系に接続するように設定します。今回はElasticsearchです。
ログを直接Elasticsearchに送信するには、Filebeat設定ファイルを編集し、出力設定セクションを更新します。
Elasticsearch 9への接続にはSSLと認証が必要です。
Elasticsearchのポート9200/tcpに接続できることを確認する(事前に2台目サーバーの9200ポートを開放しておく)
# telnet 192.168.11.85 9200

Trying 192.168.11.85...
Connected to 192.168.11.85.
Escape character is '^]'.
④Elasticsearch CA証明書作成
Elasticsearch CA証明書をダウンロードし、任意のディレクトリに保存します(今回は/etc/filebeat/elastic-ca.crtとして保存します)
# openssl s_client -connect 192.168.11.85:9200 \
-showcerts </dev/null 2>/dev/null | \
openssl x509 -outform PEM > /etc/filebeat/elastic-ca.crt
FilebeatがElasticsearchの認証に使用する認証情報を取得します。今回は、デフォルトのスーパー管理者、Elasticユーザの認証情報を使用します。
# vi /etc/filebeat/filebeat.yml

138行目当たり Kibanaセクションを下記のように追記
#host: "localhost:5601"
host: "192.168.11.85:5601"

164行目当たりコメントにして、 その下にElasticsearch Output セクションを下記のように追記
output.elasticsearch:
  # Array of hosts to connect to.
  #hosts: ["localhost:9200"]
  hosts: ["192.168.11.85:9200"]

171行目当たりコメント解除し、Elasticsearch CA証明書の場所を追記
  # Protocol - either `http` (default) or `https`.
  protocol: "https"
  ssl.certificate_authorities: ["/etc/filebeat/elastic-ca.crt"]

175,76行目当たりコメント解除しパスワード記入
  # Authentication credentials - either API key or username/password.
  #api_key: "id:api_key"
  username: "elastic"
  password: "Password"   ←2台目サーバーで作成したelasticのパスワード
⑤設定ファイルテスト
# filebeat test config
Config OK
⑥Filebeatの出力接続をテスト
# filebeat test output

elasticsearch: https://192.168.11.85:9200...
  parse url... OK
  connection...
    parse host... OK
    dns lookup... OK
    addresses: 192.168.11.85
    dial up... OK
  TLS...
    security: server's certificate chain verification is enabled
    handshake... OK
    TLS version: TLSv1.3
    dial up... OK
  talk to server... OK
  version: 9.5.4
⑦FilebeatのSuricataモジュールを有効にする
Suricataモジュールを有効にすると/etc/filebeat/modules.d/suricata.yml.disabledが/etc/filebeat/modules.d/suricata.ymlになりますがその中身は変更されませんので次のように変更する
# filebeat modules enable suricata

# vi /etc/filebeat/modules.d/suricata.yml
7-8行目を下記の通り変更
- module: suricata
  # All logs
  eve:
    enabled: true
    var.paths: ["/var/log/suricata/eve.json"]
⑧初期環境をセットアップ
SIEMダッシュボードをElasticsearchにロードします
# filebeat setup -e

{"log.level":"info","@timestamp":"2026-09-17T18:36:54.024+0900","log.logger":"modules","log.origin":{"function":"github.com/elastic/beats/v7/filebeat/fileset.LoadPipeline","file.name":"fileset/pipelines.go","file.line":134},"message":"Elasticsearch pipeline loaded.","service.name":"filebeat","pipeline":"filebeat-9.5.4-suricata-eve-pipeline","ecs.version":"1.6.0"}
{"log.level":"info","@timestamp":"2026-09-17T18:36:54.093+0900","log.logger":"modules","log.origin":{"function":"github.com/elastic/beats/v7/filebeat/fileset.LoadPipeline","file.name":"fileset/pipelines.go","file.line":134},"message":"Elasticsearch pipeline loaded.","service.name":"filebeat","pipeline":"filebeat-9.5.4-suricata-eve-dns","ecs.version":"1.6.0"}
{"log.level":"info","@timestamp":"2026-09-17T18:36:54.142+0900","log.logger":"modules","log.origin":{"function":"github.com/elastic/beats/v7/filebeat/fileset.LoadPipeline","file.name":"fileset/pipelines.go","file.line":134},"message":"Elasticsearch pipeline loaded.","service.name":"filebeat","pipeline":"filebeat-9.5.4-suricata-eve-dns-answer-v1","ecs.version":"1.6.0"}
{"log.level":"info","@timestamp":"2026-09-17T18:36:54.209+0900","log.logger":"modules","log.origin":{"function":"github.com/elastic/beats/v7/filebeat/fileset.LoadPipeline","file.name":"fileset/pipelines.go","file.line":134},"message":"Elasticsearch pipeline loaded.","service.name":"filebeat","pipeline":"filebeat-9.5.4-suricata-eve-dns-answer-v2","ecs.version":"1.6.0"}
{"log.level":"info","@timestamp":"2026-09-17T18:36:54.277+0900","log.logger":"modules","log.origin":{"function":"github.com/elastic/beats/v7/filebeat/fileset.LoadPipeline","file.name":"fileset/pipelines.go","file.line":134},"message":"Elasticsearch pipeline loaded.","service.name":"filebeat","pipeline":"filebeat-9.5.4-suricata-eve-tls","ecs.version":"1.6.0"}
{"log.level":"info","@timestamp":"2026-09-17T18:36:54.324+0900","log.logger":"modules","log.origin":{"function":"github.com/elastic/beats/v7/filebeat/fileset.LoadPipeline","file.name":"fileset/pipelines.go","file.line":134},"message":"Elasticsearch pipeline loaded.","service.name":"filebeat","pipeline":"filebeat-9.5.4-suricata-eve-http","ecs.version":"1.6.0"}
⑨Filebeatサービスを開始
# systemctl start filebeat.service
# systemctl enable filebeat.service
⑩Kibanaで確認
Kibanaにログインし直します。http://192.168.11.85:5601にアクセスします。
一番上の検索フィールドに「Suricata Events Overview」と入力し、[Filebeat Suricata]Events Overviewをクリック
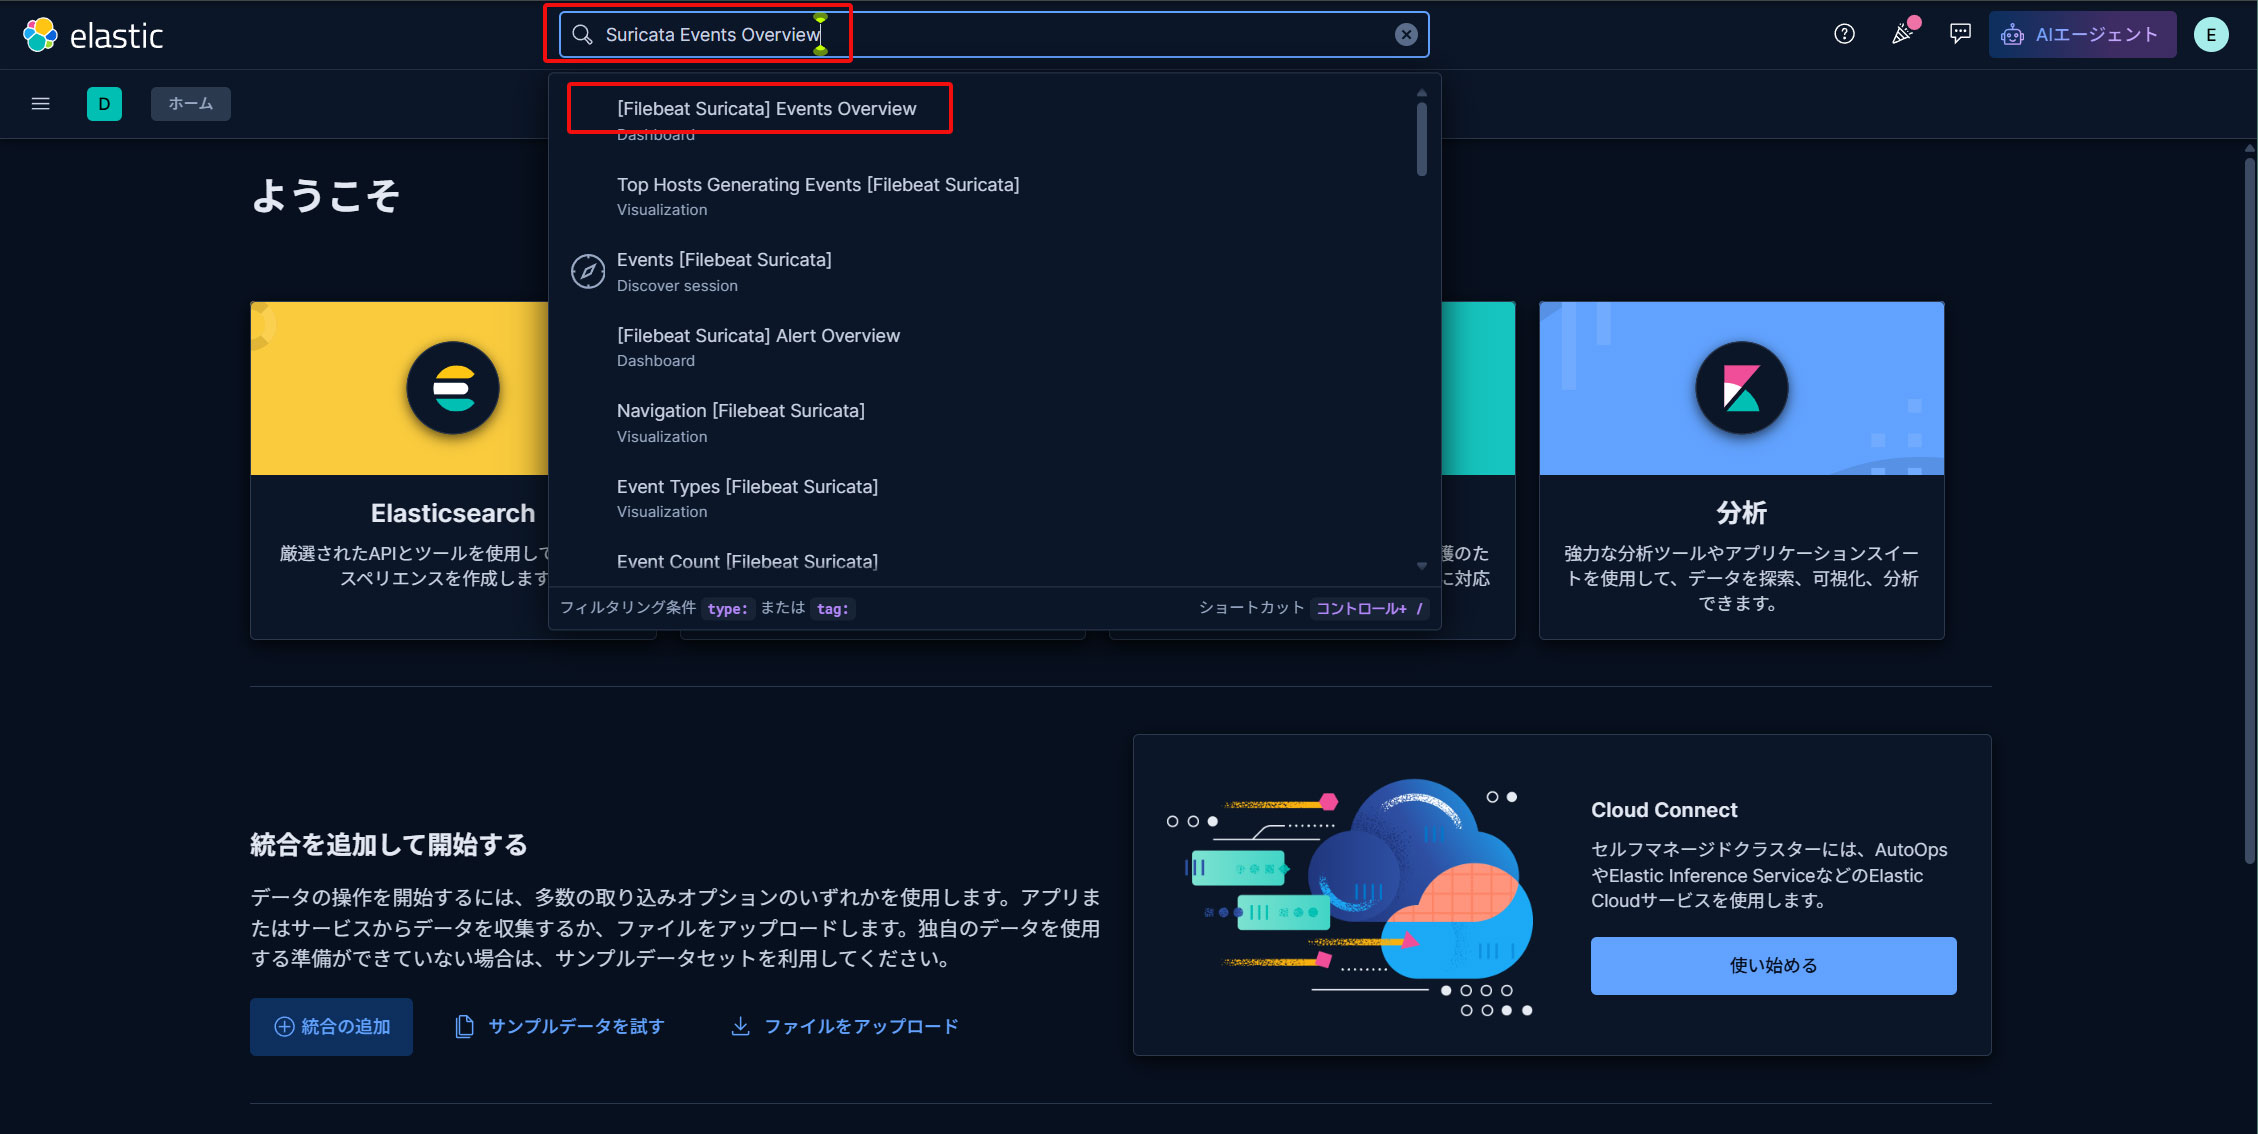
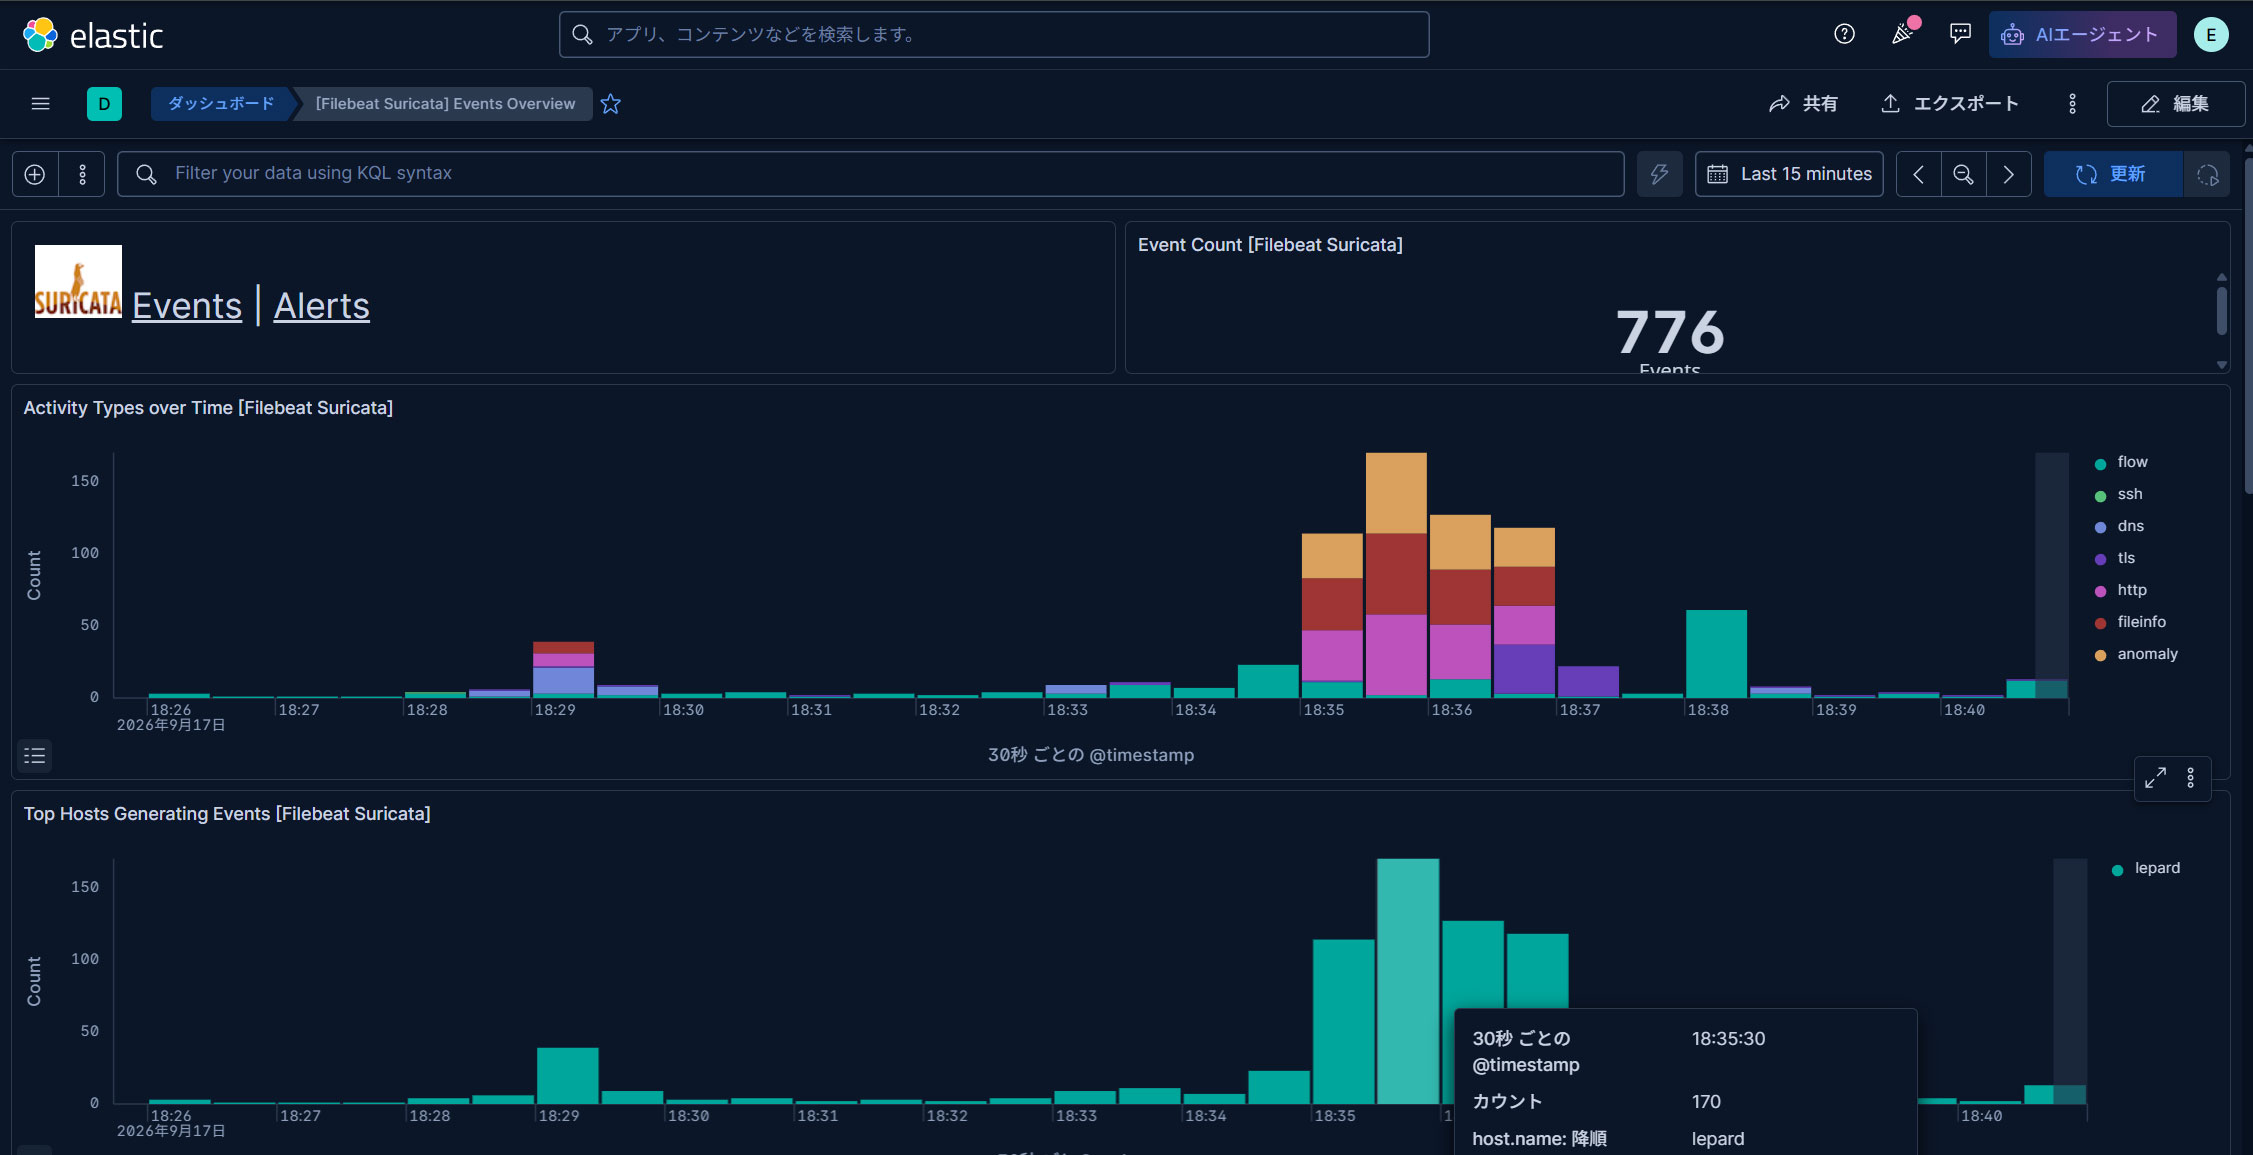
過去 15 分間のすべての Suricata イベントが表示されます
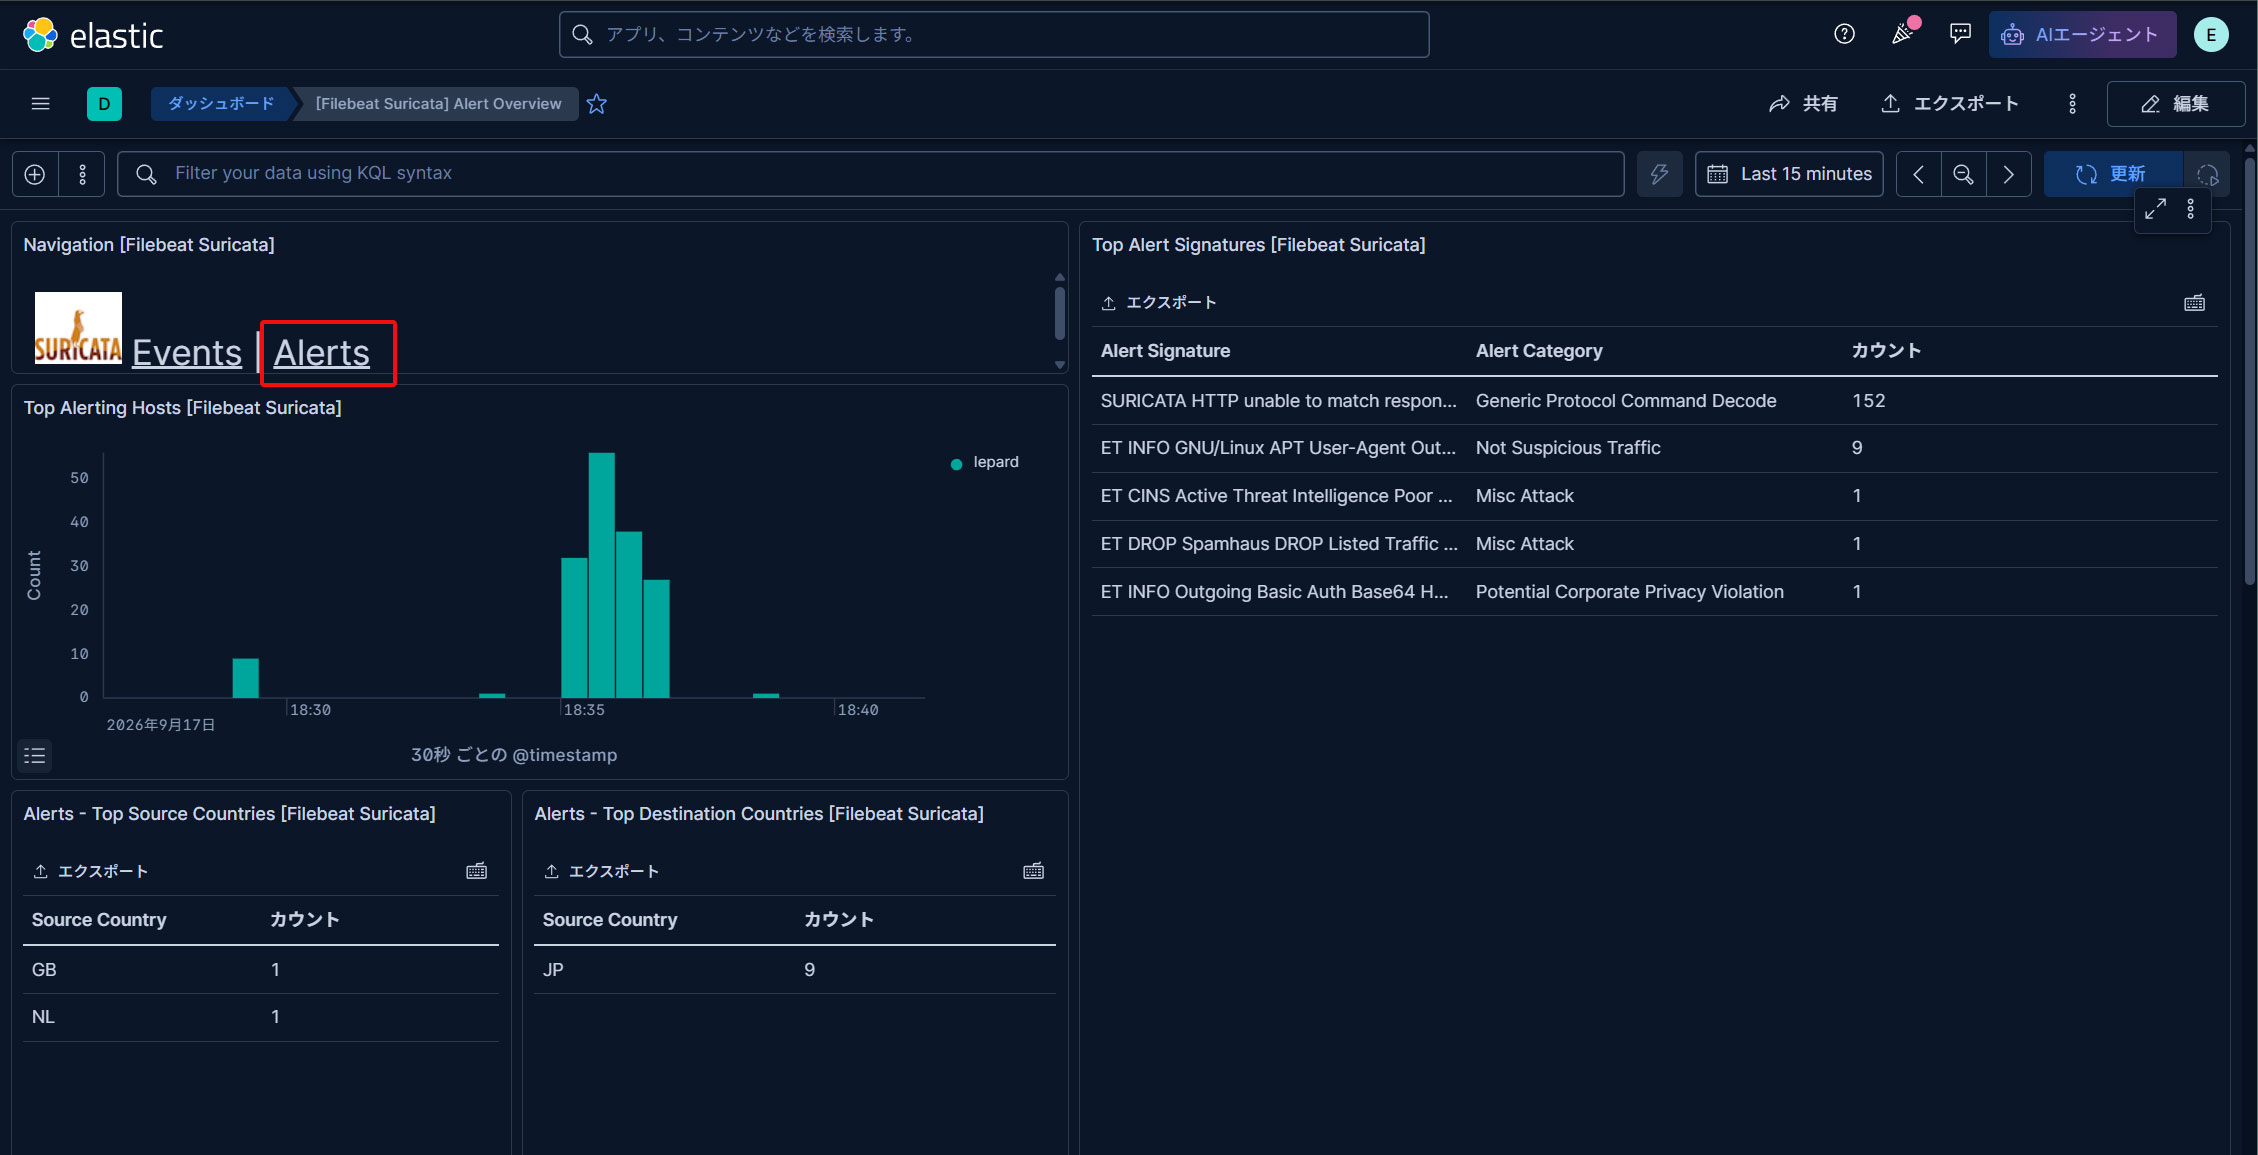
悪質なトラフィックのアラートを表示するにはSuricataロゴの横にあるAlertsテキストをクリック
elasticスーパーユーザーアカウントを使う必要がないように、新しいユーザーアカウントを作成します。
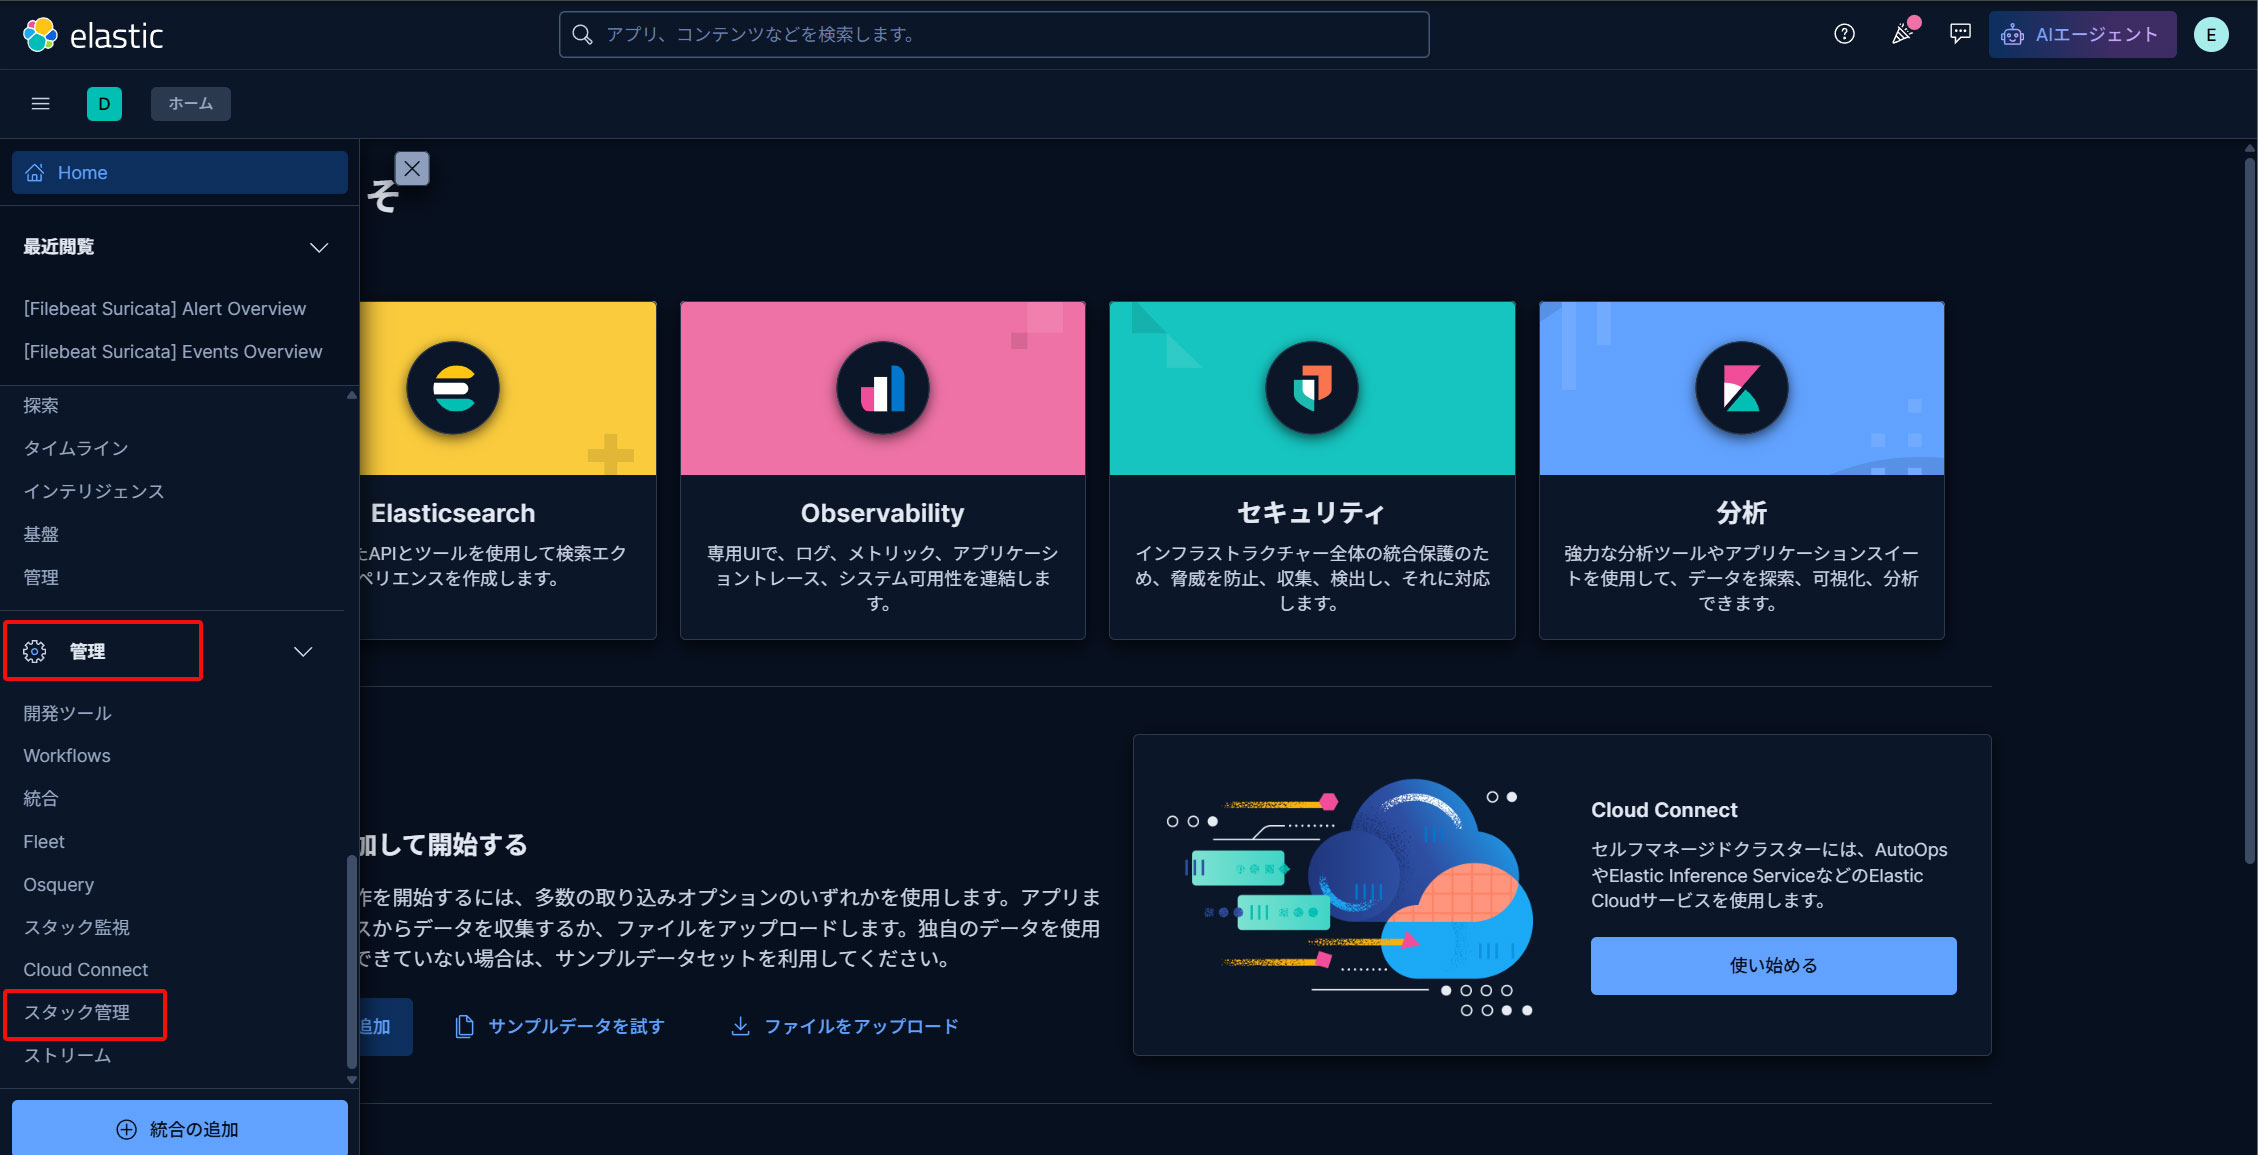
左上三本線マークをクリックし、[管理]の[スタック管理] を選択
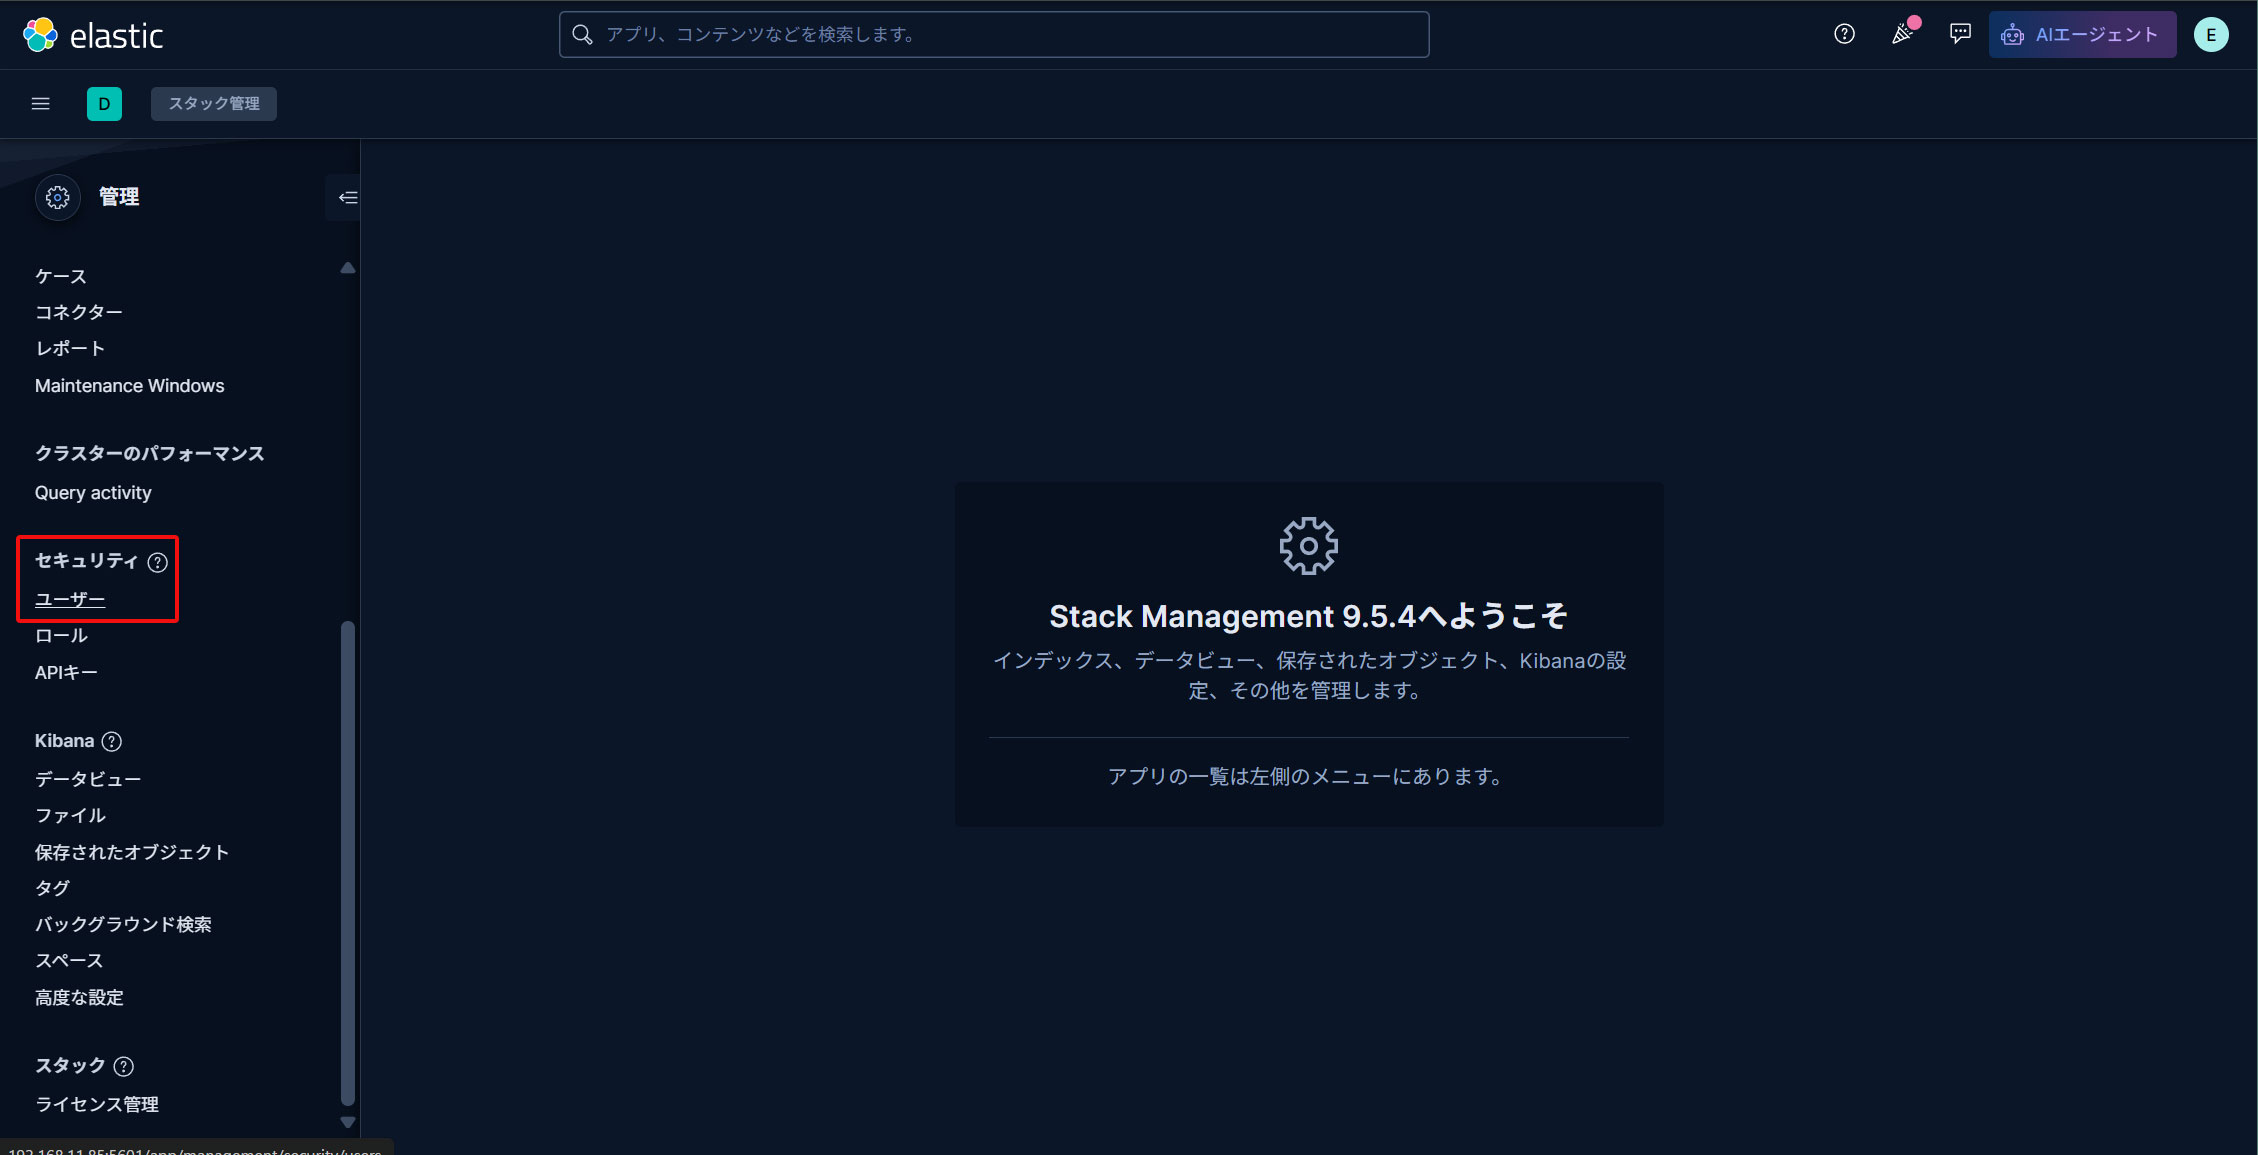
「セキュリティ」「ユーザー」を選択
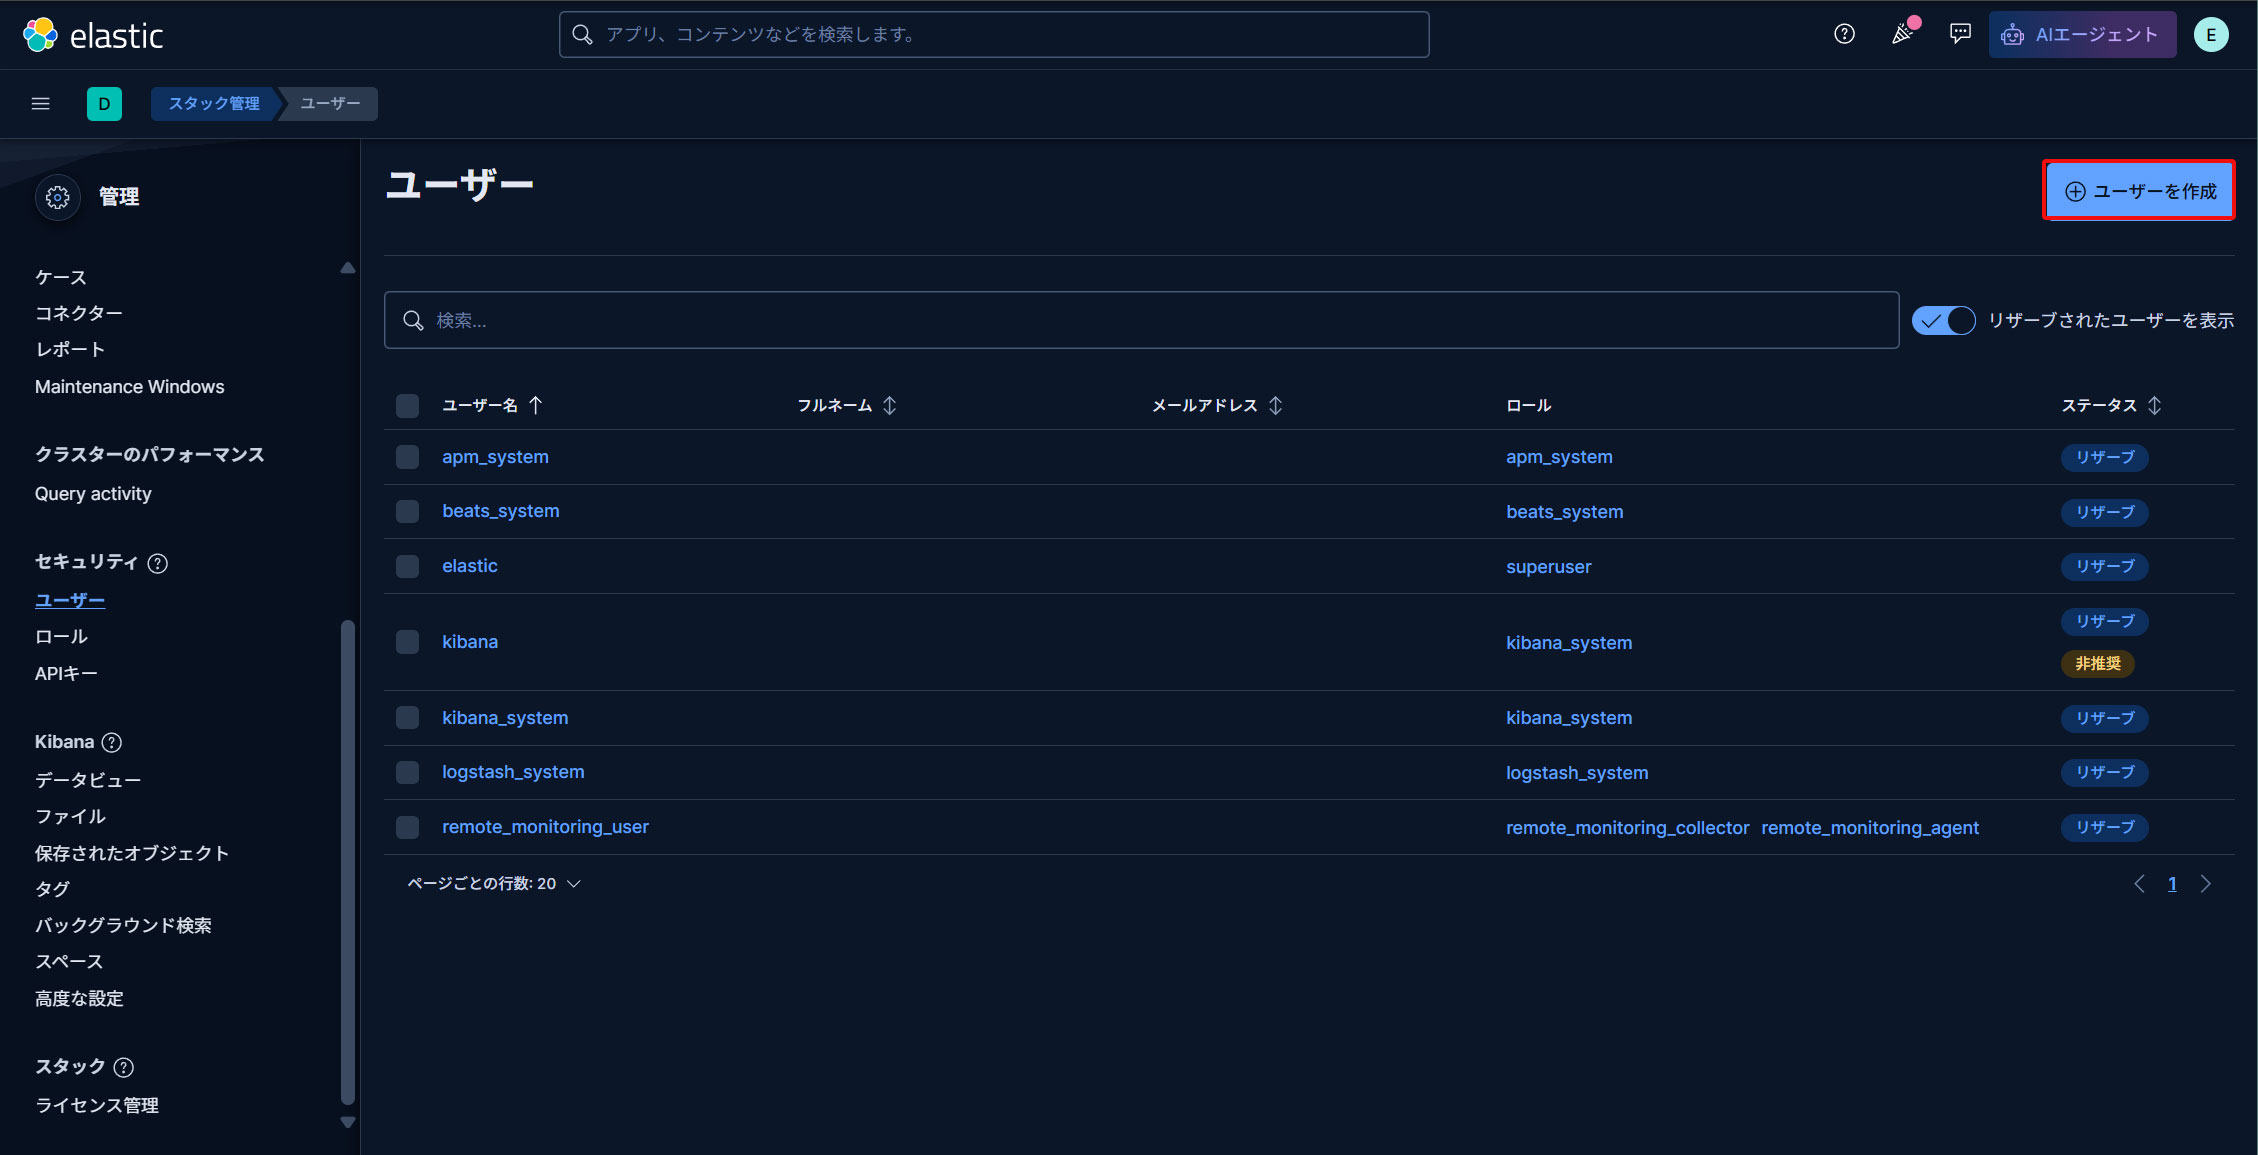
右上の"ユーザーを作成"ボタンをクリック
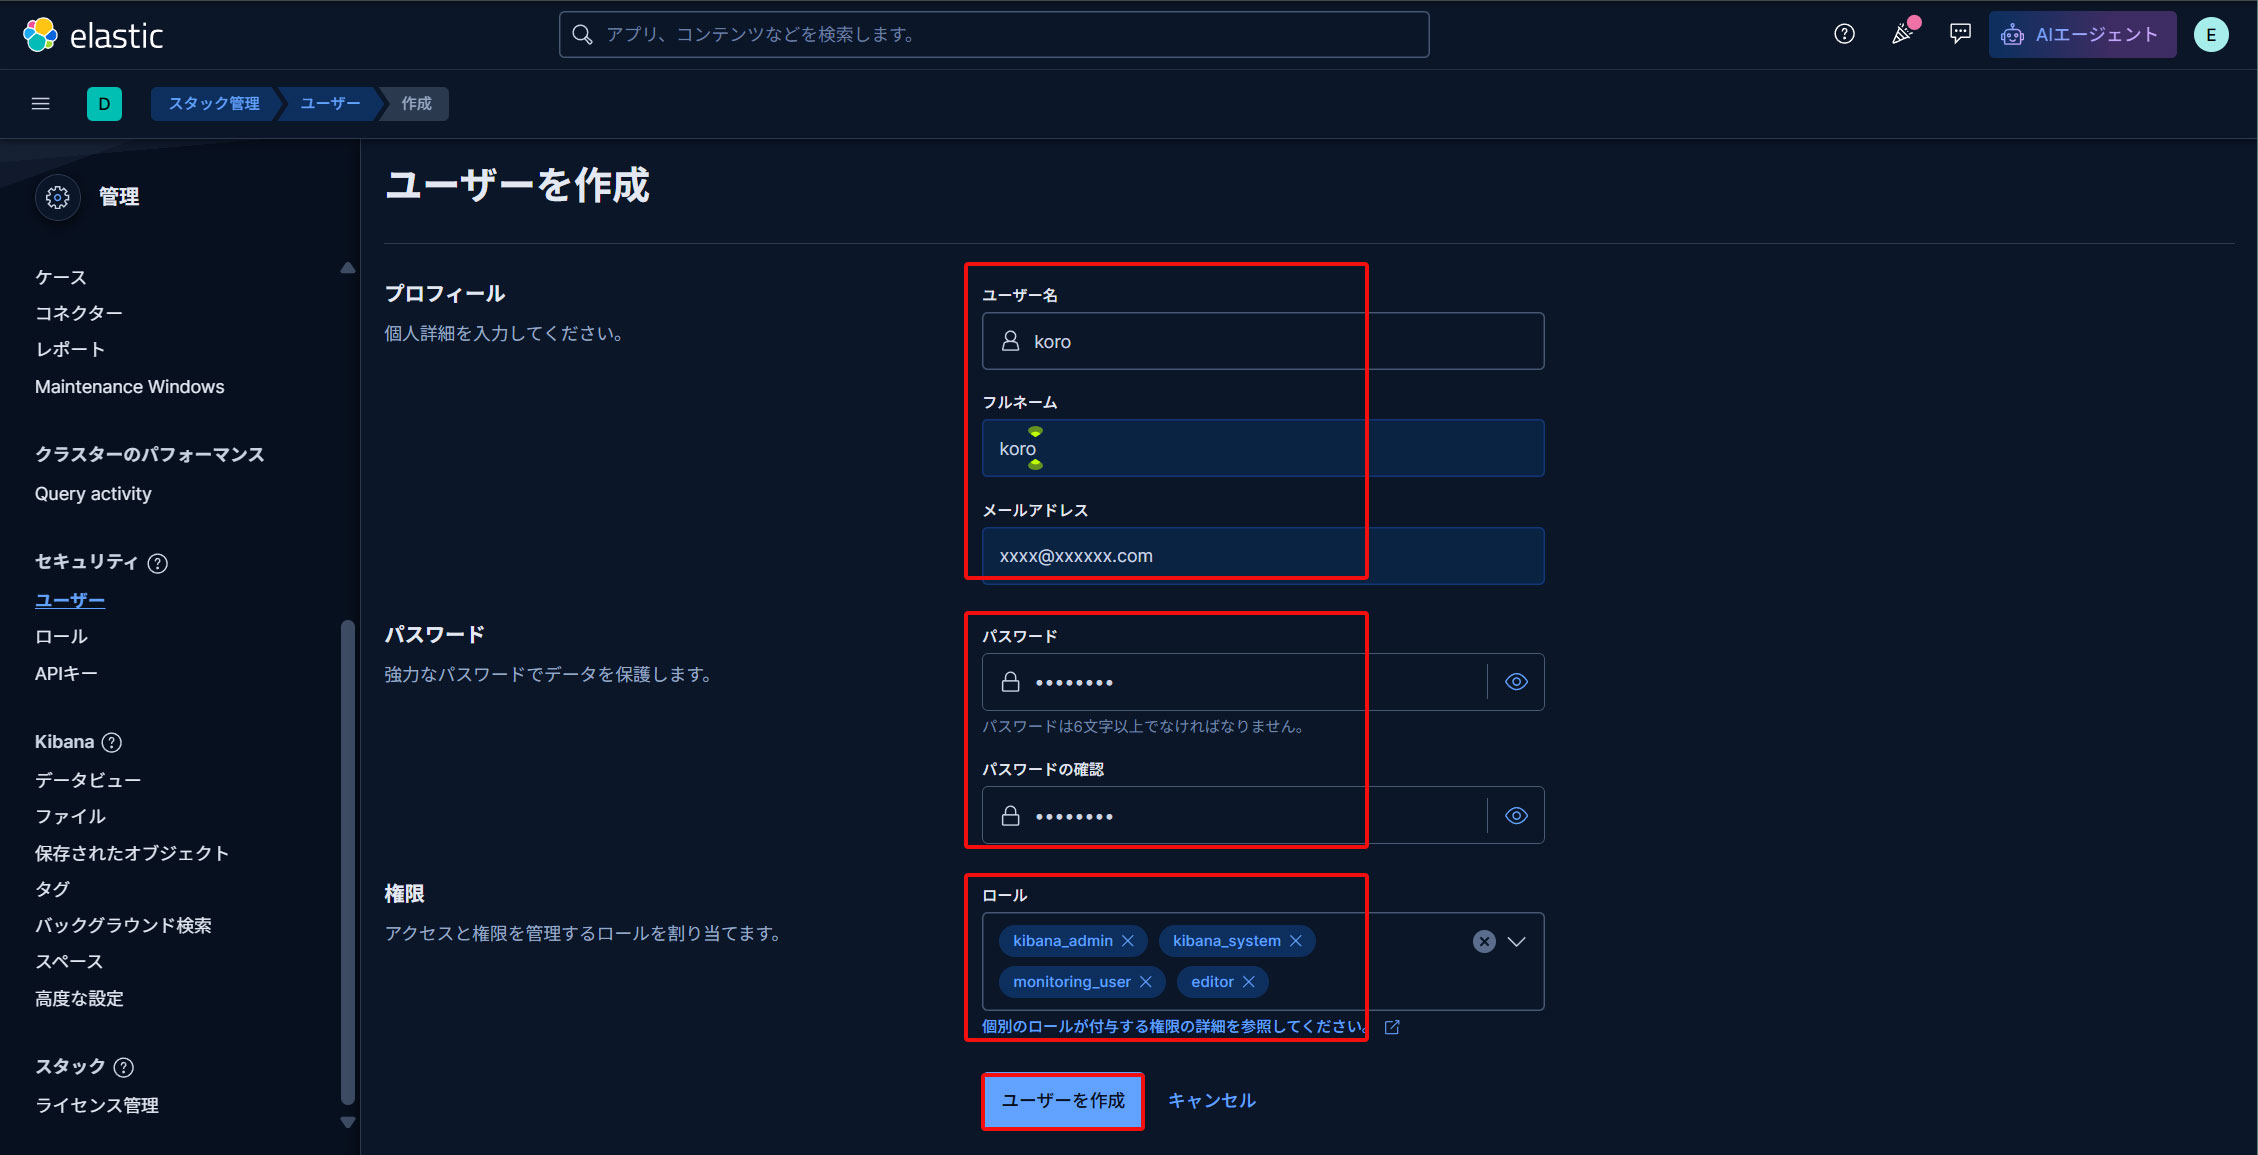
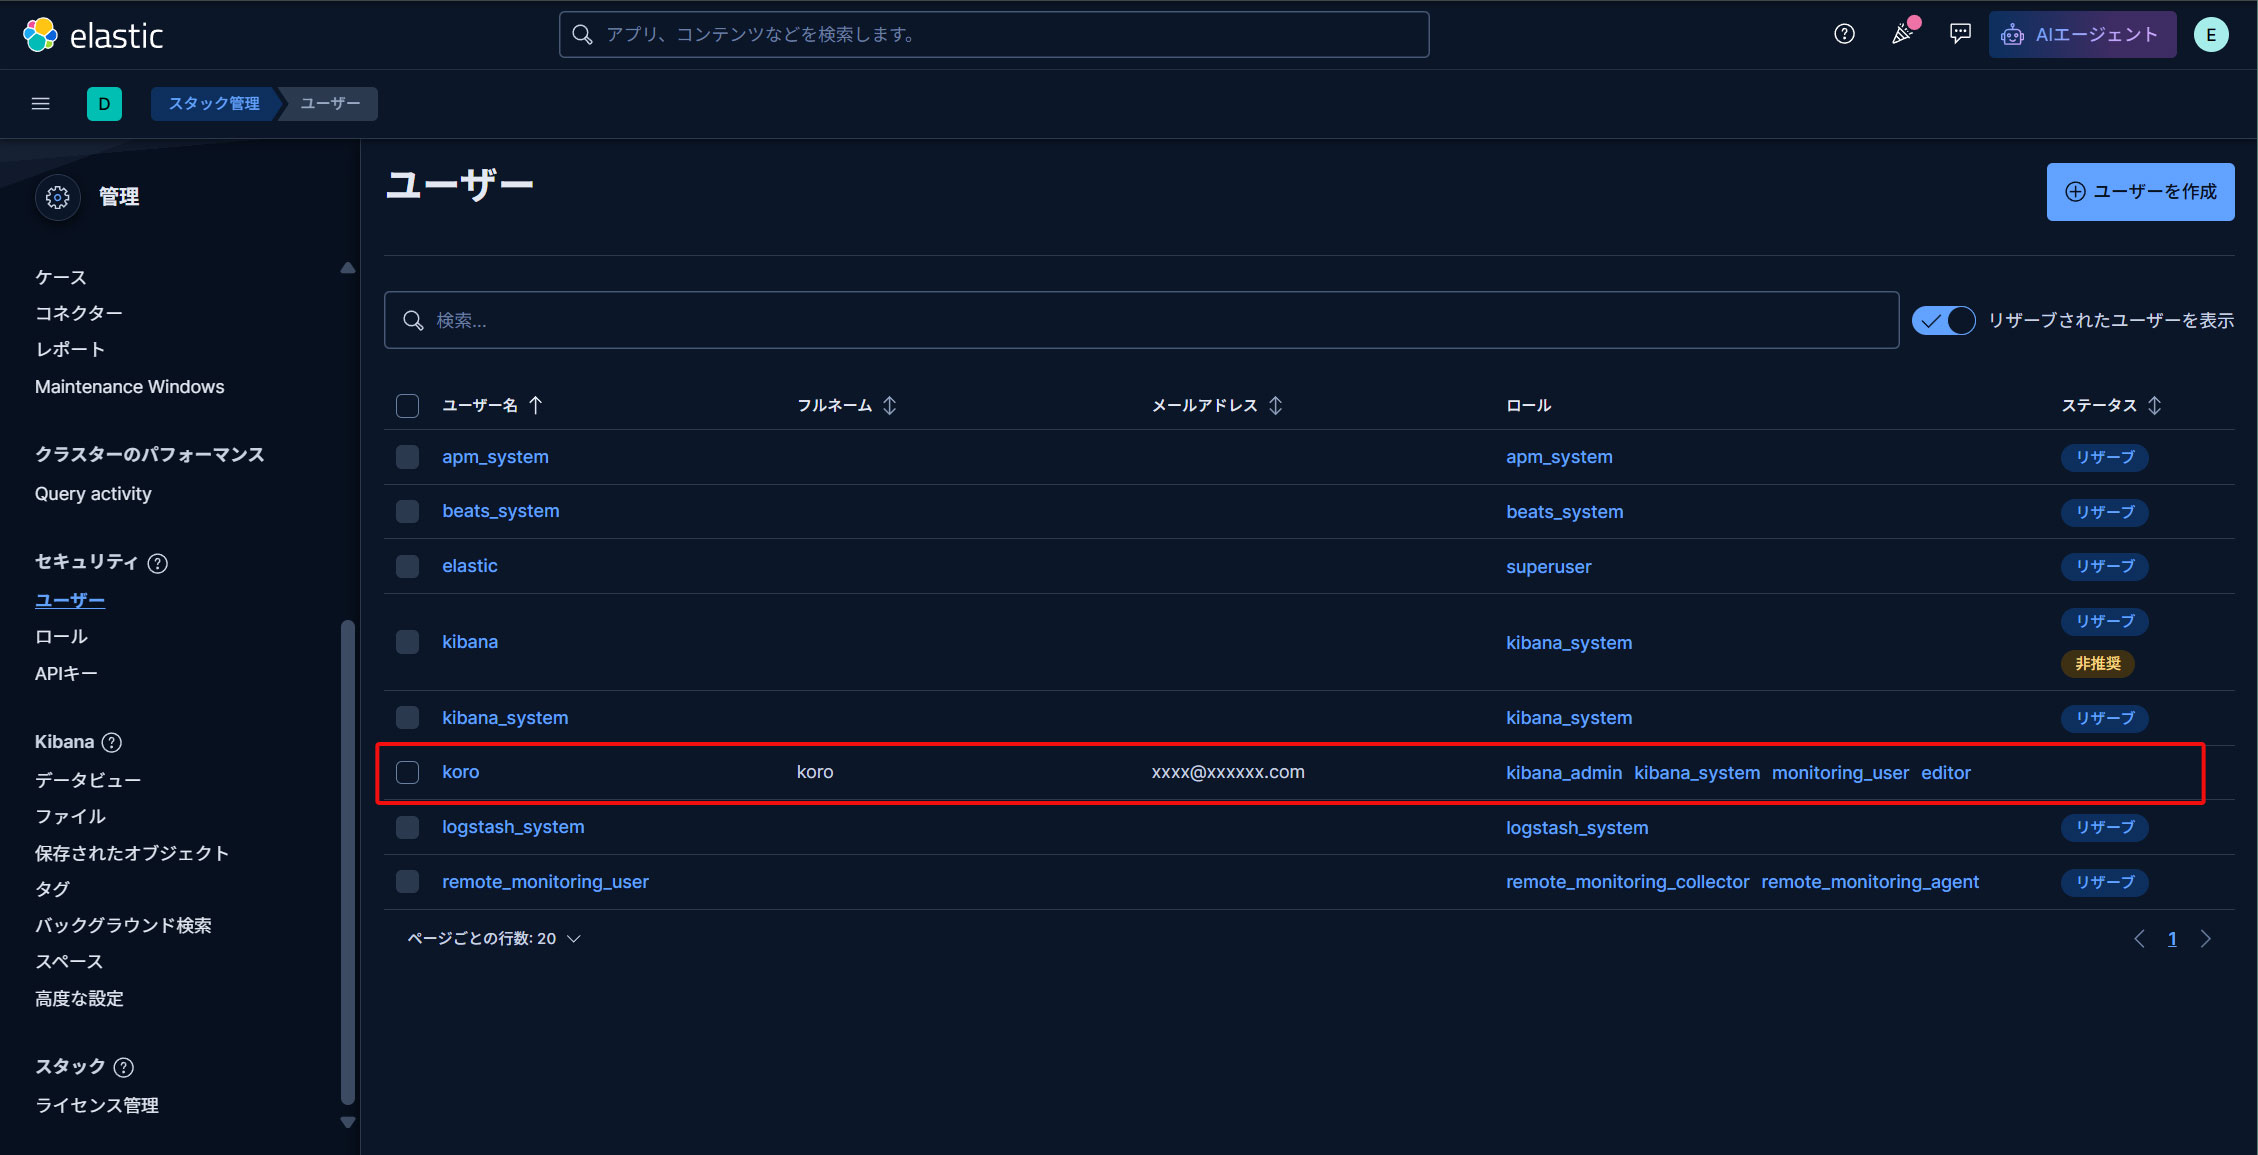
新規ユーザー情報を入力し、[権限]でkibana_admin、kibana_system、monitoring_user、editorのロールを割り当て、最後に[ユーザーを作成]をクリック
作成したユーザーが表示されている
現在のプロファイルからログアウトし、新しく作成したユーザーアカウントでログインできることを確認する。
Kibana には、ログを視覚化するためのさまざまな機能とツールがありますのでいろいろと試してください。