

前提条件
1.Suricata
SURICATA IDS/IPSはネットワーク上の通信を監視し、不審なトラフィックを検知するオープンソースのIDSです。基本的な仕組みはシグネチャ型であるため、あらかじめ設定した不正な通信を検知できます。また、Suricataは検知だけでなく防御も行えることが特徴です。
2.Elasticsearch,Kibana,Filebeat
Elasticsearchをインストール&設定して、Kibana,Filebeatを使用してSURICATAのログを可視化&検索できるようにする
今回はSuricata IDS と Elasticsearch,Kibana,Filebeat を 次のサーバーにインストールします
・1台目サーバー Suricata IDS & Filebeat : AlmaLinux9.8 IPアドレス(192.168.11.83)
・2台目サーバー Elasticsearch & kibana : AlmaLinux10.2 IPアドレス(192.168.11.85)
1台目サーバー Suricata インストール
1.Suricata のインストールと設定
①Suricata のインストール
# dnf install epel-release dnf-plugins-core
# dnf copr enable @oisf/suricata-8.0
# dnf -y install suricata

バージョンチェック
# suricata -V
This is Suricata version 8.0.5 RELEASE
②Suricataがネットワークパケットを検査するインターフェースとIPアドレスを決定
# ip --brief add
lo               UNKNOWN        127.0.0.1/8 ::1/128
ens160           UP             192.168.11.83/24 fe80::20c:29ff:fe55:a867/64
③設定ファイルを編集
# vi /etc/suricata/suricata.yaml
●18行目 : コメントアウトしてその下に追加(varsセクションで、ネットワークを定義する)
#HOME_NET: "[192.168.0.0/16,10.0.0.0/8,172.16.0.0/12]"
HOME_NET: "[192.168.11.0/24]"
●158行目あたり : 変更
community-id: false → community-id: true
●661行目あたり : af-packetセクションのインターフェース名を設定
af-packet:
- interface: ens160
# vi /etc/sysconfig/suricata
●8行目 :インターフェイスを指定
#Add options to be passed to the daemon
OPTIONS="-i ens160 --user suricata "
④Suricataのルール更新
# suricata-update
⑤Suricataの起動
# systemctl enable --now suricata
Created symlink /etc/systemd/system/multi-user.target.wants/suricata.service → /usr/lib/systemd/system/suricata.service.
⑥Suricataの起動確認
# systemctl status suricata
● suricata.service - Suricata Intrusion Detection Service
     Loaded: loaded (/usr/lib/systemd/system/suricata.service; enabled; preset: disabled)
     Active: active (running) since Thu 2026-07-02 10:54:23 JST; 37s ago
       Docs: man:suricata(1)
    Process: 19629 ExecStartPre=/bin/rm -f /var/run/suricata.pid (code=exited, status=0/SUCCESS)
   Main PID: 19630 (Suricata-Main)
      Tasks: 8 (limit: 22900)
     Memory: 405.8M (peak: 406.0M)
        CPU: 18.338s
     CGroup: /system.slice/suricata.service
             └─19630 /sbin/suricata -c /etc/suricata/suricata.yaml --pidfile /var/run/suricata.pid -i ens160 --user suricata

Jul 02 10:54:23 Lepard systemd[1]: Starting Suricata Intrusion Detection Service...
Jul 02 10:54:23 Lepard systemd[1]: Started Suricata Intrusion Detection Service.
Jul 02 10:54:23 Lepard suricata[19630]: i: suricata: This is Suricata version 8.0.5 RELEASE running in SYSTEM mode
Jul 02 10:54:41 Lepard suricata[19630]: i: threads: Threads created -> W: 2 FM: 1 FR: 1   Engine started.
ログを確認
# tail /var/log/suricata/suricata.log

[19630 - Suricata-Main] 2026-07-02 10:54:23 Info: logopenfile: fast output device (regular) initialized: fast.log
[19630 - Suricata-Main] 2026-07-02 10:54:23 Info: logopenfile: eve-log output device (regular) initialized: eve.json
[19630 - Suricata-Main] 2026-07-02 10:54:23 Info: logopenfile: stats output device (regular) initialized: stats.log
[19630 - Suricata-Main] 2026-07-02 10:54:40 Info: detect: 1 rule files processed. 50944 rules successfully loaded, 0 rules failed, 0 rules skipped
[19630 - Suricata-Main] 2026-07-02 10:54:40 Info: threshold-config: Threshold config parsed: 0 rule(s) found
[19630 - Suricata-Main] 2026-07-02 10:54:40 Info: detect: 50949 signatures processed. 1283 are IP-only rules, 4505 are inspecting packet payload, 44925 inspect application layer, 110 are decoder event only
[19630 - Suricata-Main] 2026-07-02 10:54:41 Info: unix-manager: unix socket '/var/run/suricata/suricata-command.socket'
[19630 - Suricata-Main] 2026-07-02 10:54:41 Info: runmodes: ens160: creating 2 threads
[19632 - W#01-ens160] 2026-07-02 10:54:41 Info: ioctl: ens160: MTU 1500
[19630 - Suricata-Main] 2026-07-02 10:54:41 Notice: threads: Threads created -> W: 2 FM: 1 FR: 1   Engine started.
統計情報を確認するには、stats.log ファイルを確認します(デフォルトで8秒ごとに更新)
# tail -f /var/log/suricata/stats.log
より高度な出力であるEVE JSONは、以下のコマンドで生成することができる
# tail -f /var/log/suricata/eve.json
2.Suricata のテスト
①curl ユーティリティで ping テストを実行
# curl http://testmynids.org/uid/index.html
uid=0(root) gid=0(root) groups=0(root)
②指定されたルール番号を使用してログファイルを確認する
Suricataには、デフォルトで有効になっている次の2つのログファイルが付属しています。
/var/log/suricata/fast.log
/var/log/suricata/eve.log
curlリクエストに対応するログエントリーを確認するために、/var/log/suricata/fast.log ログファイルをgrepコマンドを使用してチェックします。2100498 ルール識別子を使用してログエントリーを検索します。(IPv4の場合)
# grep 2100498 /var/log/suricata/fast.log
07/02/2026-10:57:53.490590  [**] [1:2100498:7] GPL ATTACK_RESPONSE id check returned root [**] [Classification: Potentially Bad Traffic] [Priority: 2] {TCP} 13.227.50.46:80 -> 192.168.11.83:40550
③/var/log/suricata/eve.log のイベント確認
jq をインストール
# dnf -y install jq
2100498シグネチャを検索して、EVEログのイベントをフィルタリング
2100498の値と一致するsignature_idキーを持つalertオブジェクトを表示
# jq 'select(.alert .signature_id==2100498)' /var/log/suricata/eve.json

{
  "timestamp": "2026-07-02T10:57:53.490590+0900",
  "flow_id": 347417018387019,
  "in_iface": "ens160",
  "event_type": "alert",
  "src_ip": "13.227.50.46",
  "src_port": 80,
  "dest_ip": "192.168.11.83",
  "dest_port": 40550,
  "proto": "TCP",
  "ip_v": 4,
  "pkt_src": "wire/pcap",
  "community_id": "1:F28PbR/waQ1ciQPcWaWAgzDFhE8=",
  "alert": {
    "action": "allowed",
    "gid": 1,
    "signature_id": 2100498,
    "rev": 7,
    "signature": "GPL ATTACK_RESPONSE id check returned root",
    "category": "Potentially Bad Traffic",
    "severity": 2,
    "metadata": {
      "confidence": [
        "Medium"
      ],
      "created_at": [
        "2010_09_23"
      ],
      "signature_severity": [
        "Informational"
      ],
      "updated_at": [
        "2019_07_26"
      ]
    }
  },
  "app_proto": "http",
  "direction": "to_client",
  "flow": {
    "pkts_toserver": 5,
    "pkts_toclient": 4,
    "bytes_toserver": 430,
    "bytes_toclient": 810,
    "start": "2026-07-02T10:57:53.474105+0900",
    "src_ip": "192.168.11.83",
    "dest_ip": "13.227.50.46",
    "src_port": 40550,
    "dest_port": 80
  }
}
3.Suricata Rulesの設定
①Suricataにパッケージされているルールセットの表示
# ls -al /var/lib/suricata/rules/
total 43212
drwxr-s--- 2 root     suricata       57 Jul  2 10:53 .
drwxrws--- 5 suricata suricata       46 Jul  2 10:54 ..
-rw-r--r-- 1 root     suricata     3228 Jul  2 10:53 classification.config
-rw-r--r-- 1 root     suricata 44244508 Jul  2 10:53 suricata.rules
②ルールセットを提供するソースのインデックス一覧
# suricata-update list-sources

Name: abuse.ch/feodotracker
  Vendor: Abuse.ch
  Summary: Abuse.ch Feodo Tracker Botnet C2 IP ruleset
  License: CC0-1.0
Name: abuse.ch/sslbl-blacklist
  Vendor: Abuse.ch
  Summary: Abuse.ch SSL Blacklist
  License: CC0-1.0
  Replaces: sslbl/ssl-fp-blacklist
Name: abuse.ch/sslbl-c2
  Vendor: Abuse.ch
  Summary: Abuse.ch Suricata Botnet C2 IP Ruleset
  License: CC0-1.0
Name: abuse.ch/sslbl-ja3
  Vendor: Abuse.ch
  Summary: Abuse.ch Suricata JA3 Fingerprint Ruleset
  License: CC0-1.0
  Replaces: sslbl/ja3-fingerprints
Name: abuse.ch/urlhaus
  Vendor: abuse.ch
  Summary: Abuse.ch URLhaus Suricata Rules
  License: CC0-1.0
Name: aleksibovellan/nmap
  Vendor: aleksibovellan
  Summary: Suricata IDS/IPS Detection Rules Against NMAP Scans
  License: MIT
Name: et/open
  Vendor: Proofpoint
  Summary: Emerging Threats Open Ruleset
  License: MIT
Name: et/pro
  Vendor: Proofpoint
  Summary: Emerging Threats Pro Ruleset
  License: Commercial
  Replaces: et/open
  Parameters: secret-code
  Subscription: https://www.proofpoint.com/us/threat-insight/et-pro-ruleset
Name: etnetera/aggressive
  Vendor: Etnetera a.s.
  Summary: Etnetera aggressive IP blacklist
  License: MIT
Name: oisf/trafficid
  Vendor: OISF
  Summary: Suricata Traffic ID ruleset
  License: MIT
Name: pawpatrules
  Vendor: pawpatrules
  Summary: PAW Patrules is a collection of rules for IDPS / NSM Suricata engine
  License: CC-BY-SA-4.0
Name: ptrules/open
  Vendor: Positive Technologies
  Summary: Positive Technologies Open Ruleset
  License: Custom
Name: scwx/enhanced
  Vendor: Secureworks
  Summary: Secureworks suricata-enhanced ruleset
  License: Commercial
  Parameters: secret-code
  Subscription: https://www.secureworks.com/contact/ (Please reference CTU Countermeasures)
Name: scwx/malware
  Vendor: Secureworks
  Summary: Secureworks suricata-malware ruleset
  License: Commercial
  Parameters: secret-code
  Subscription: https://www.secureworks.com/contact/ (Please reference CTU Countermeasures)
Name: scwx/security
  Vendor: Secureworks
  Summary: Secureworks suricata-security ruleset
  License: Commercial
  Parameters: secret-code
  Subscription: https://www.secureworks.com/contact/ (Please reference CTU Countermeasures)
Name: stamus/lateral
  Vendor: Stamus Networks
  Summary: Lateral movement rules
  License: GPL-3.0-only
Name: stamus/nrd-14-open
  Vendor: Stamus Networks
  Summary: Newly Registered Domains Open only - 14 day list, complete
  License: Commercial
  Parameters: secret-code
  Subscription: https://www.stamus-networks.com/stamus-labs/subscribe-to-threat-intel-feed
Name: stamus/nrd-30-open
  Vendor: Stamus Networks
  Summary: Newly Registered Domains Open only - 30 day list, complete
  License: Commercial
  Parameters: secret-code
  Subscription: https://www.stamus-networks.com/stamus-labs/subscribe-to-threat-intel-feed
Name: stamus/nrd-entropy-14-open
  Vendor: Stamus Networks
  Summary: Newly Registered Domains Open only - 14 day list, high entropy
  License: Commercial
  Parameters: secret-code
  Subscription: https://www.stamus-networks.com/stamus-labs/subscribe-to-threat-intel-feed
Name: stamus/nrd-entropy-30-open
  Vendor: Stamus Networks
  Summary: Newly Registered Domains Open only - 30 day list, high entropy
  License: Commercial
  Parameters: secret-code
  Subscription: https://www.stamus-networks.com/stamus-labs/subscribe-to-threat-intel-feed
Name: stamus/nrd-phishing-14-open
  Vendor: Stamus Networks
  Summary: Newly Registered Domains Open only - 14 day list, phishing
  License: Commercial
  Parameters: secret-code
  Subscription: https://www.stamus-networks.com/stamus-labs/subscribe-to-threat-intel-feed
Name: stamus/nrd-phishing-30-open
  Vendor: Stamus Networks
  Summary: Newly Registered Domains Open only - 30 day list, phishing
  License: Commercial
  Parameters: secret-code
  Subscription: https://www.stamus-networks.com/stamus-labs/subscribe-to-threat-intel-feed
Name: tgreen/hunting
  Vendor: tgreen
  Summary: Threat hunting rules
  License: GPLv3
③ソースを有効にする(tgreen/huntingを有効にする場合)
# suricata-update enable-source tgreen/hunting

2/7/2026 -- 11:03:00 - <Info> -- Using data-directory /var/lib/suricata.
2/7/2026 -- 11:03:00 - <Info> -- Using Suricata configuration /etc/suricata/suricata.yaml
2/7/2026 -- 11:03:00 - <Info> -- Using /usr/share/suricata/rules for Suricata provided rules.
2/7/2026 -- 11:03:00 - <Info> -- Found Suricata version 8.0.5 at /usr/sbin/suricata.
2/7/2026 -- 11:03:00 - <Warning> -- Source index does not exist, will use bundled one.
2/7/2026 -- 11:03:00 - <Warning> -- Please run suricata-update update-sources.
2/7/2026 -- 11:03:00 - <Info> -- Creating directory /var/lib/suricata/update/sources
2/7/2026 -- 11:03:00 - <Info> -- Enabling default source et/open
2/7/2026 -- 11:03:00 - <Info> -- Source tgreen/hunting enabled
アップデートを実行
# suricata-update update-sources
Suricata service再起動
# systemctl restart suricata
4. SuricataをIPSに設定する
悪意のあるネットワーク・トラフィックをドロップするようにSuricataをIPSモードで起動するように設定する
非SSHポートへのSSHトラフィックをスキャンする以下のカスタム署名を作成し、/var/lib/suricata/rules/local.rulesというファイルにインクルードする(SSHポートは22と仮定する)
# vi /var/lib/suricata/rules/local.rules
alert ssh any any -> 192.168.11.83 !22 (msg:"SSH TRAFFIC on non-SSH port"; flow:to_client, not_established; classtype: misc-attack; target: dest_ip; sid:1000000;)
/etc/suricata/suricata.yaml設定ファイルを編集し、local.rulesをインクルードする
# vi /etc/suricata/suricata.yaml
2326行目あたりに追加
rule-files:
  - suricata.rules
  - local.rules
SURICATAの設定を検証
# suricata -T -c /etc/suricata/suricata.yaml -v
--------------------------------------------------
Info: threshold-config: Threshold config parsed: 0 rule(s) found
Info: detect: 50950 signatures processed. 1283 are IP-only rules, 4505 are inspecting packet payload, 44926 inspect application layer, 110 are decoder event only
Notice: suricata: Configuration provided was successfully loaded. Exiting.
SURICATAの/etc/sysconfig/suricata設定ファイルを編集する
# vi /etc/sysconfig/suricata

8行目 : コメントアウトし、下記を追加する
# OPTIONS="-i ens160 --user suricata"
OPTIONS="-q 0 -vvv --user suricata"
Suricataを再起動
# systemctl restart suricata.service
ステータス確認
# systemctl status suricata.service

● suricata.service - Suricata Intrusion Detection Service
     Loaded: loaded (/usr/lib/systemd/system/suricata.service; enabled; preset: disabled)
     Active: active (running) since Thu 2026-07-02 11:11:00 JST; 28s ago
       Docs: man:suricata(1)
    Process: 20459 ExecStartPre=/bin/rm -f /var/run/suricata.pid (code=exited, status=0/SUCCESS)
   Main PID: 20461 (Suricata-Main)
      Tasks: 10 (limit: 22900)
     Memory: 446.5M (peak: 446.7M)
        CPU: 18.179s
     CGroup: /system.slice/suricata.service
             └─20461 /sbin/suricata -c /etc/suricata/suricata.yaml --pidfile /var/run/suricata.pid -q 0 -vvv --user suricata

Jul 02 11:11:18 Lepard suricata[20461]: [20461] Perf: mpm-hs-cache: rule group caching - loaded: 115 newly cached: 0 total cacheable: 115
Jul 02 11:11:18 Lepard suricata[20461]: [20461] Info: unix-manager: unix socket '/var/run/suricata/suricata-command.socket'
Jul 02 11:11:18 Lepard suricata[20461]: [20461] Config: tmqh-flow: AutoFP mode using "Hash" flow load balancer
Jul 02 11:11:19 Lepard suricata[20461]: [20463] Info: nfq: binding this thread 0 to queue '0'
Jul 02 11:11:19 Lepard suricata[20461]: [20463] Info: nfq: setting queue length to 4096
Jul 02 11:11:19 Lepard suricata[20461]: [20463] Info: nfq: setting nfnl bufsize to 6144000
Jul 02 11:11:19 Lepard suricata[20461]: [20461] Config: flow-manager: using 1 flow manager threads
Jul 02 11:11:19 Lepard suricata[20461]: [20461] Config: flow-manager: using 1 flow recycler threads
Jul 02 11:11:19 Lepard suricata[20461]: [20461] Config: log-flush: log flusher thread not used with heartbeat.output-flush-interval of 0
Jul 02 11:11:19 Lepard suricata[20461]: [20461] Notice: threads: Threads created -> RX: 1 W: 2 TX: 1 FM: 1 FR: 1   Engine started.
入ってくるネットワーク・トラフィックをSuricataのNFQUEUEに向ける
Firewalld がインストールされ、有効になっているのでSuricataに必要なルールをFirewalldに追加する(SSHポートは22と仮定する)
# firewall-cmd --permanent --direct --add-rule ipv4 filter INPUT 0 -p tcp --dport 22 -j NFQUEUE --queue-bypass
# firewall-cmd --permanent --direct --add-rule ipv4 filter OUTPUT 0 -p tcp --sport 22 -j NFQUEUE --queue-bypass

IPv6用の同じルールを追加する:
# firewall-cmd --permanent --direct --add-rule ipv6 filter INPUT 0 -p tcp --dport 22 -j NFQUEUE --queue-bypass
# firewall-cmd --permanent --direct --add-rule ipv6 filter OUTPUT 0 -p tcp --sport 22 -j NFQUEUE --queue-bypas

FORWARDルールを追加して、サーバーが他のシステムのゲートウェイとして動作している場合、そのトラフィックもすべてSURICATAに行って処理されるようにします。
# firewall-cmd --permanent --direct --add-rule ipv4 filter FORWARD 0 -j NFQUEUE
# firewall-cmd --permanent --direct --add-rule ipv6 filter FORWARD 0 -j NFQUEUE

最後の2つのINPUTとOUTPUTルールは、SSHトラフィックでない残りのトラフィックをすべてSuricataに送って処理させる。
# firewall-cmd --permanent --direct --add-rule ipv4 filter INPUT 1 -j NFQUEUE
# firewall-cmd --permanent --direct --add-rule ipv4 filter OUTPUT 1 -j NFQUEUE

IPv6も同様にする
# firewall-cmd --permanent --direct --add-rule ipv6 filter INPUT 1 -j NFQUEUE
# firewall-cmd --permanent --direct --add-rule ipv6 filter OUTPUT 1 -j NFQUEUE

Firewalldをリロード
# firewall-cmd --reload
SURICATA がトラフィックを正しくドロップしていることを確認
シグネチャのデフォルトアクションをalertやlogからactive dropping trafficに切り替える
/var/lib/suricata/rules/suricata.rulesファイルを開き、sid:2100498に該当するものがあれば コメントアウトする
# vi /var/lib/suricata/rules/suricata.rules
#alert ip any any -> any any (msg:"GPL ATTACK_RESPONSE id check returned root"; content:"uid=0|28|root|29|"; classtype:bad-unknown; sid:2100498; rev:7; metadata:created_at 2010_09_23, confidence Medium, signature_severity Informational, updated_at 2019_07_26;)
/var/lib/suricata/rules/local.rulesにsid:2100498として新規作成する
# vi /var/lib/suricata/rules/local.rules

drop ip any any -> any any (msg:"GPL ATTACK_RESPONSE id check returned root"; content:"uid=0|28|root|29|"; classtype:bad-unknown; sid:2100498; rev:7; metadata:created_at 2010_09_23, confidence Medium, signature_severity Informational, updated_at 2019_07_26;)
suricata再起動
# systemctl restart suricata
curlを使ってこのルールをテスト
# curl --max-time 5 http://testmynids.org/uid/index.html
curl: (28) Operation timed out after 5000 milliseconds with 0 out of 39 bytes received
jqを使ってeve.logファイルを調べる
# jq 'select(.alert .signature_id==2100498)' /var/log/suricata/eve.json

{
  "timestamp": "2026-07-02T11:21:24.968360+0900",
  "flow_id": 1262192912178245,
  "event_type": "alert",
  "src_ip": "13.227.50.120",
  "src_port": 80,
  "dest_ip": "192.168.11.83",
  "dest_port": 59104,
  "proto": "TCP",
  "ip_v": 4,
  "pkt_src": "wire/pcap",
  "community_id": "1:HuBVOVnle1g8K/DQerxTp0WJjkI=",
  "alert": {
    "action": "blocked",
    "gid": 1,
    "signature_id": 2100498,
    "rev": 7,
    "signature": "GPL ATTACK_RESPONSE id check returned root",
    "category": "Potentially Bad Traffic",
    "severity": 2,
    "metadata": {
      "confidence": [
        "Medium"
      ],
      "created_at": [
        "2010_09_23"
      ],
      "signature_severity": [
        "Informational"
      ],
      "updated_at": [
        "2019_07_26"
      ]
    }
  },
  "app_proto": "http",
  "direction": "to_client",
  "flow": {
    "pkts_toserver": 3,
    "pkts_toclient": 4,
    "bytes_toserver": 256,
    "bytes_toclient": 754,
    "start": "2026-07-02T11:21:24.949237+0900",
    "src_ip": "192.168.11.83",
    "dest_ip": "13.227.50.120",
    "src_port": 59104,
    "dest_port": 80
  }
}
"action": "blocked",になっている
ELK StackとSURICATAの統合
Elastic Stackをインストール&設定して、SURICATAのログをより効率的に可視化&検索できるようにする
本セクションは基本的には2台目のAlmaLinux10.2サーバーで行います
1. Elasticsearchのインストール
1.1 公開署名キーをダウンロードしてインストール
# rpm --import https://artifacts.elastic.co/GPG-KEY-elasticsearch
1.2 リポジトリ定義を/etc/yum/yum.repos.d ディレクトリに作成
#  vi /etc/yum.repos.d/elasticsearch.repo

下記内容記述
[elasticsearch]
name=Elasticsearch repository for 9.x packages
baseurl=https://artifacts.elastic.co/packages/9.x/yum
gpgcheck=1
gpgkey=https://artifacts.elastic.co/GPG-KEY-elasticsearch
enabled=0
autorefresh=1
type=rpm-md
1.3 Elasticsearch インストール
# dnf -y install --enablerepo=elasticsearch elasticsearch
2. Elasticsearch 設定
Elasticsearchはデフォルトでローカル接続のみを受け付けるように設定されています。また、認証が有効になっていないため、Filebeatなどのツールはログを送信できません。今回は、Elasticsearchのネットワーク設定を行い、Elasticsearchに組み込まれているxpackセキュリティモジュールを有効にします。
2.1 Elasticsearchネットワークの設定
ElasticsearchとSURICATAのサーバは別々なので、Elasticsearchがプライベートネットワークインターフェースで接続をリッスンするように設定する必要がある
# vi /etc/elasticsearch/elasticsearch.yml
●57行目 : Elasticsearch serverのローカルアドレス追加
#network.host: 192.168.0.1
network.host: 192.168.11.85
●62行目コメント解除
http.port: 9200
2.2 Elasticsearch を起動
# systemctl daemon-reload
# systemctl enable elasticsearch.service
# systemctl start elasticsearch.service
2.3 elasticとkibana_systemのパスワードを作成
elasticユーザとkibana_systemユーザのパスワードは後で使用するので必ずコピーしておく
kibana_systemユーザはKibanaの設定に使用する
elasticユーザはFilebeat、Auditbeatの設定およびKibanaへのログインに使用する
パスワードを忘れた場合は、再度コマンドを使用してパスワードをリセットできます。
[elastic] userのパスワード作成
# cd /usr/share/elasticsearch/bin

# ./elasticsearch-reset-password -u elastic
This tool will reset the password of the [elastic] user to an autogenerated value.
The password will be printed in the console.
Please confirm that you would like to continue [y/N]y


Password for the [elastic] user successfully reset.
New value: wGC6NB9NN2gmmE9E4yKG
※Elasticsearch パスワードのリセット
自動生成されたElasticユーザーパスワードが複雑すぎるので、/usr/share/elasticsearch/bin/elasticsearch-reset-passwordコマンドを使ってリセットできます
パスワードをリセットするには、コマンドを実行する
# /usr/share/elasticsearch/bin/elasticsearch-reset-password -u elastic -i

This tool will reset the password of the [elastic] user.
You will be prompted to enter the password.
Please confirm that you would like to continue [y/N]y


Enter password for [elastic]:
Re-enter password for [elastic]:
Password for the [elastic] user successfully reset.
[kibana_system]userのパスワード作成
# cd /usr/share/elasticsearch/bin

# ./elasticsearch-reset-password -u kibana_system
This tool will reset the password of the [kibana_system] user to an autogenerated value.
The password will be printed in the console.
Please confirm that you would like to continue [y/N]y


Password for the [kibana_system] user successfully reset.
New value: 49uvSB5bJLKQDvkLiBz-
3. Kibana のインストールと設定
本セクションは基本的には2台目のAlmaLinux10.2サーバーで行います
3.1 Kibanaインストール
# dnf -y install --enablerepo=elasticsearch kibana

Installed:
  kibana-9.4.3-1.x86_64

Complete!
3.2 xpackセキュリティモジュールの設定
Kibana の xpack セキュリティ機能を有効にして、Kibana が Elasticsearch にデータを保存するために使用するいくつかの暗号化キーを作成する。
暗号化キーは、/usr/share/kibana/bin ディレクトリに含まれる kibana-encryption-keys ユーティリティを使用して作成する。
作成した3つのキーを安全な場所に保存しておく
# cd /usr/share/kibana/bin/
# ./kibana-encryption-keys generate -q --force
xpack.encryptedSavedObjects.encryptionKey: 875996761d860896c09b8d1a2b7a028a8894eb82e8890295372c2523f837994d
xpack.reporting.encryptionKey: 82f0eea9a9aff32b3e45e2b9ea26068d4a4e72b733302bf97a5d479b6d9295a8
xpack.security.encryptionKey: 28caf225c9d9e42f87e9918792d94fe16d2d9489b971b56d25b7dd433bdea743
これらのキーをKibanaの/etc/kibana/kibana.yml設定ファイルに追加する
# vi /etc/kibana/kibana.yml

最終行に記述
xpack.encryptedSavedObjects.encryptionKey: 875996761d860896c09b8d1a2b7a028a8894eb82e8890295372c2523f837994d
xpack.reporting.encryptionKey: 82f0eea9a9aff32b3e45e2b9ea26068d4a4e72b733302bf97a5d479b6d9295a8
xpack.security.encryptionKey: 28caf225c9d9e42f87e9918792d94fe16d2d9489b971b56d25b7dd433bdea743
3.2 Kibana ネットワークの設定
# vi /etc/kibana/kibana.yml

6行目 : コメント解除
server.port: 5601

12行目サーバーのプライベートIPアドレス(192.168.11.85)を追加
#server.host: "localhost"
server.host: "192.168.11.85"
3.3 Kibana-Elasticsearch Enrollment Token の生成
Kibana インスタンスを、セキュリティ機能が有効になっている既存の Elasticsearch クラスタと通信するように設定するには、登録トークンが必要です。Kibana 用の Enrollment Token は以下のコマンドで生成できる
# /usr/share/elasticsearch/bin/elasticsearch-create-enrollment-token -s kibana
eyJ2ZXIiOiI4LjE0LjAiLCJhZHIiOlsiMTkyLjE2OC4xMS44NTo5MjAwIl0sImZnciI6ImUyMjMwYzg1NTc4OTMyMTI1ZWEzNWJhYmJhMTdjZmI2ODZjYWI0NGQ3MDJjZjM1NTRkNjU2NTgyODcwZjdmZWQiLCJrZXkiOiJpWEh0SUo4QkpyX29RNWdOZkF4YTpQSGVoa1IyOXg3OWFGVmlhSWJqSlNBIn0=
3.4 Kibanaの起動
Kibana 9 を有効化し、起動
# systemctl enable --now kibana
# systemctl start kibana
ステータス確認
# systemctl status kibana

● kibana.service - Kibana
     Loaded: loaded (/usr/lib/systemd/system/kibana.service; enabled; preset: disabled)
     Active: active (running) since Thu 2026-07-02 12:45:37 JST; 42s ago
 Invocation: a8395407bf8f47f28b577975f7b73758
       Docs: https://www.elastic.co
   Main PID: 9591 (MainThread)
      Tasks: 11 (limit: 16781)
     Memory: 744.1M (peak: 744.6M)
        CPU: 13.545s
     CGroup: /system.slice/kibana.service
             mq9591 /usr/share/kibana/bin/../node/default/bin/node /usr/share/kibana/bin/../src/cli/kibana/dist

Jul 02 12:45:39 Lion kibana[9591]: Native global console methods have been overridden in production environment.
Jul 02 12:45:42 Lion kibana[9591]: [2026-07-02T12:45:42.292+09:00][INFO ][root] Kibana is starting
Jul 02 12:45:42 Lion kibana[9591]: [2026-07-02T12:45:42.330+09:00][INFO ][node] Kibana process configured with roles: [>
Jul 02 12:45:53 Lion kibana[9591]: [2026-07-02T12:45:53.405+09:00][INFO ][plugins-service] The following plugins are di>
Jul 02 12:45:53 Lion kibana[9591]: [2026-07-02T12:45:53.492+09:00][INFO ][http.server.Preboot] http server running at h>
Jul 02 12:45:53 Lion kibana[9591]: [2026-07-02T12:45:53.589+09:00][INFO ][plugins-system.preboot] Setting up [1] plugin>
Jul 02 12:45:53 Lion kibana[9591]: [2026-07-02T12:45:53.612+09:00][INFO ][preboot] "interactiveSetup" plugin is holding>
Jul 02 12:45:53 Lion kibana[9591]: [2026-07-02T12:45:53.649+09:00][INFO ][root] Holding setup until preboot stage is co>
Jul 02 12:46:02 Lion kibana[9591]: i Kibana has not been configured.
Jul 02 12:46:02 Lion kibana[9591]: Go to http://192.168.11.85:5601/?code=723859 to get started.
出力の最後のほうに以下のように表示される
Go to http://192.168.11.85:5601/?code=723859 to get started.
提供されたKibanaのURL(codeを含む)をコピーしてブラウザで使用し、Kibanaにアクセスしてセットアップを完了する。
4. Kibana9 ダッシュボードにアクセスする
Firewallが起動している場合は、Kibanaポートを開く
# firewall-cmd --add-port=5601/tcp --permanent
# firewall-cmd --reload
http://192.168.11.85:5601/?code=723859にアクセスする
(各自の適切なアドレスをコピー)
Kibana 9にアクセスすると、ウェルカムページでElasticの設定を求められます。
最初に、生成した登録トークンを入力する。
/usr/share/elasticsearch/bin/elasticsearch-create-enrollment-token -s kibana, コマンドを使用して生成された Kibana トークンをコピーし、ボックスに貼り付ける
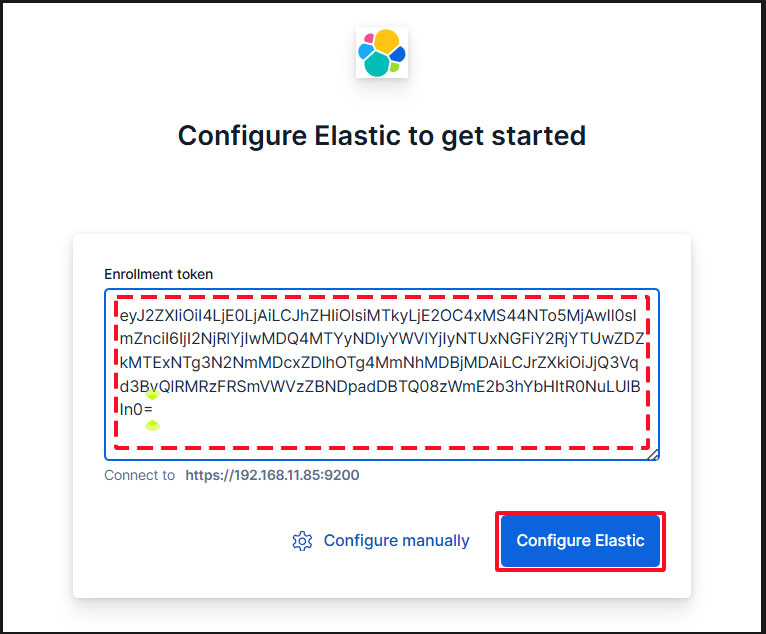
トークンをペーストすると、Kibana が自動的に Elasticsearch に接続します。
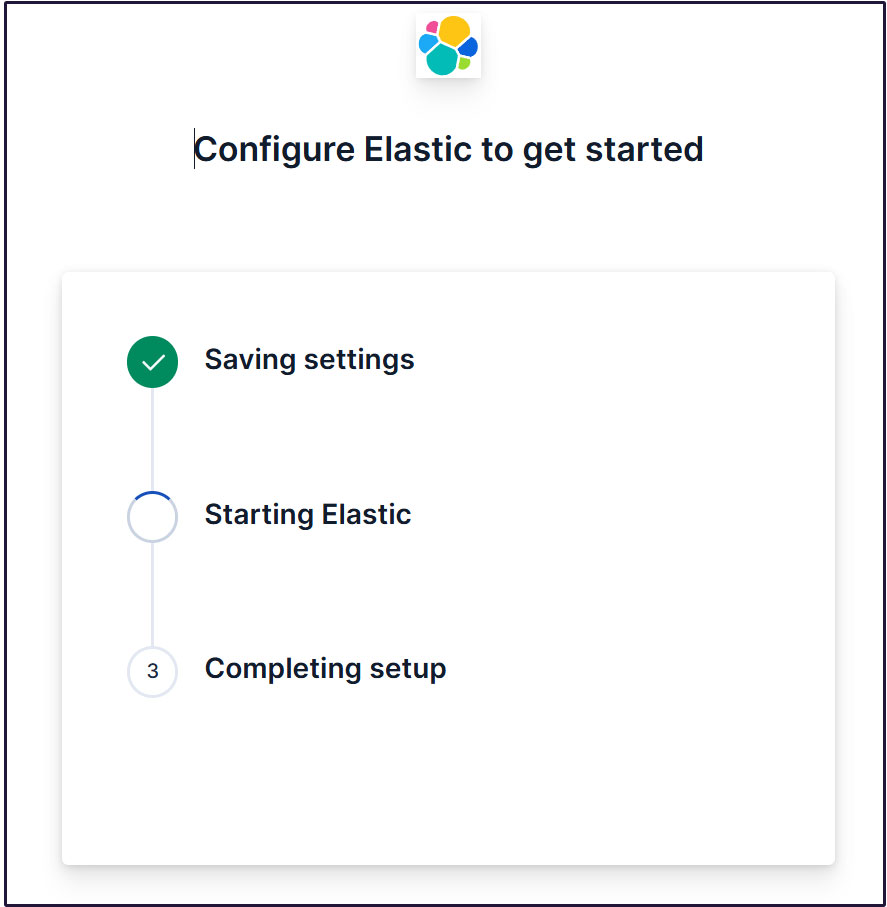
Configure Elastic をクリックします。設定が保存され、Elasticsearch が設定、再起動されます。
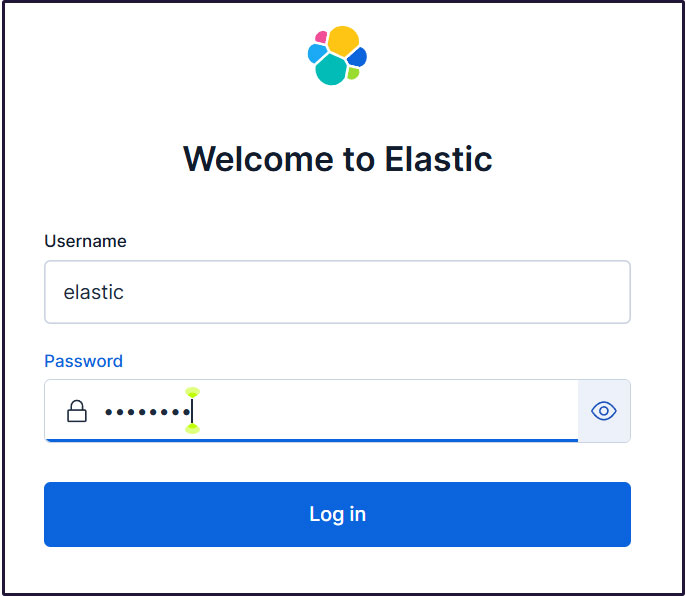
ログインページに移動します。生成されたElasticユーザー認証情報を使用してログインします。
Username : elastic
Password : わかりやすく再生成したパスワード
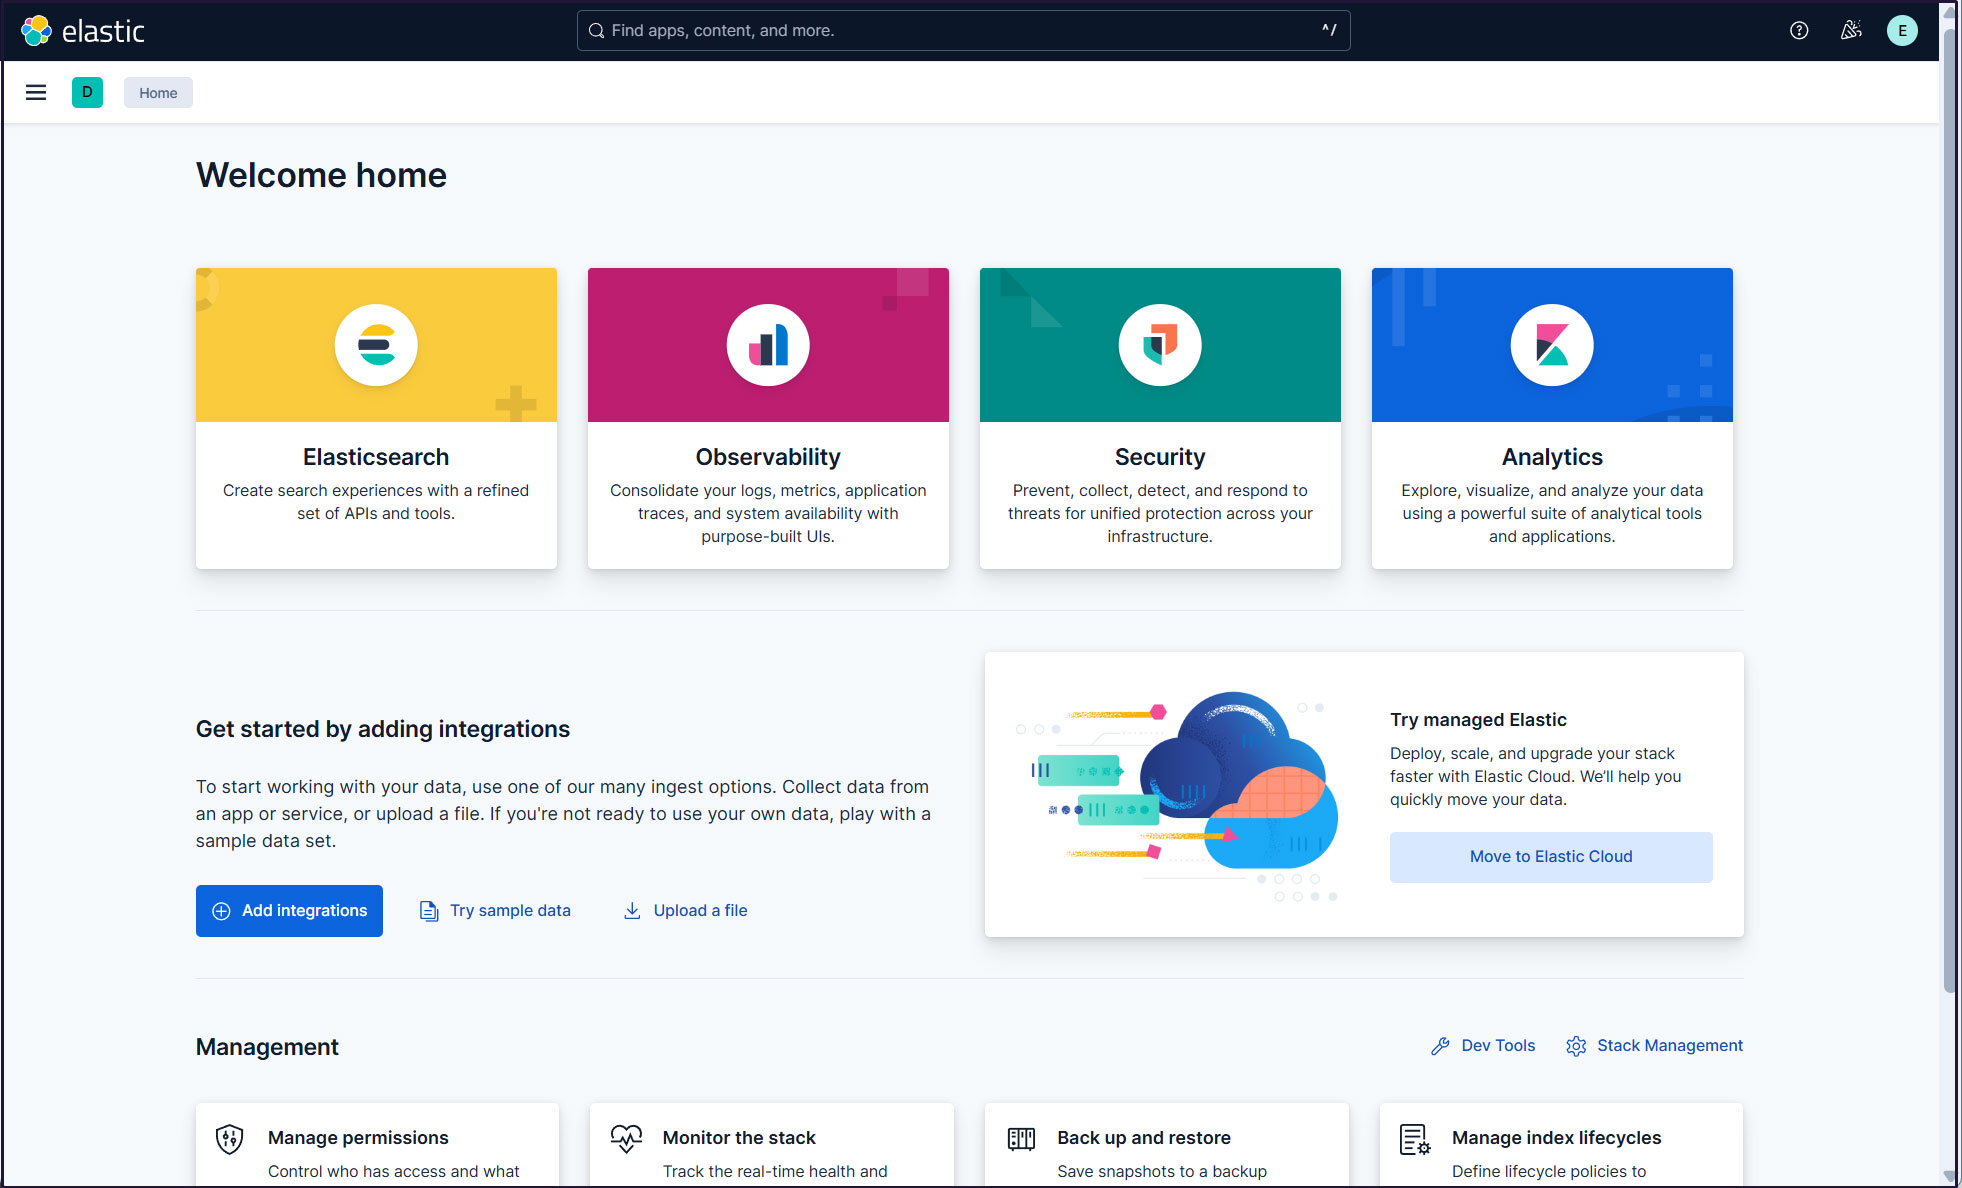
ウェルカムページで、「Explore on my own」をクリックしてKibana 9.xダッシュボードに進む。

elasticスーパーユーザーアカウントを使う必要がないように、新しいユーザーアカウントを作成します。
メインメニューを開き、Management>Stack Management >Security> Users
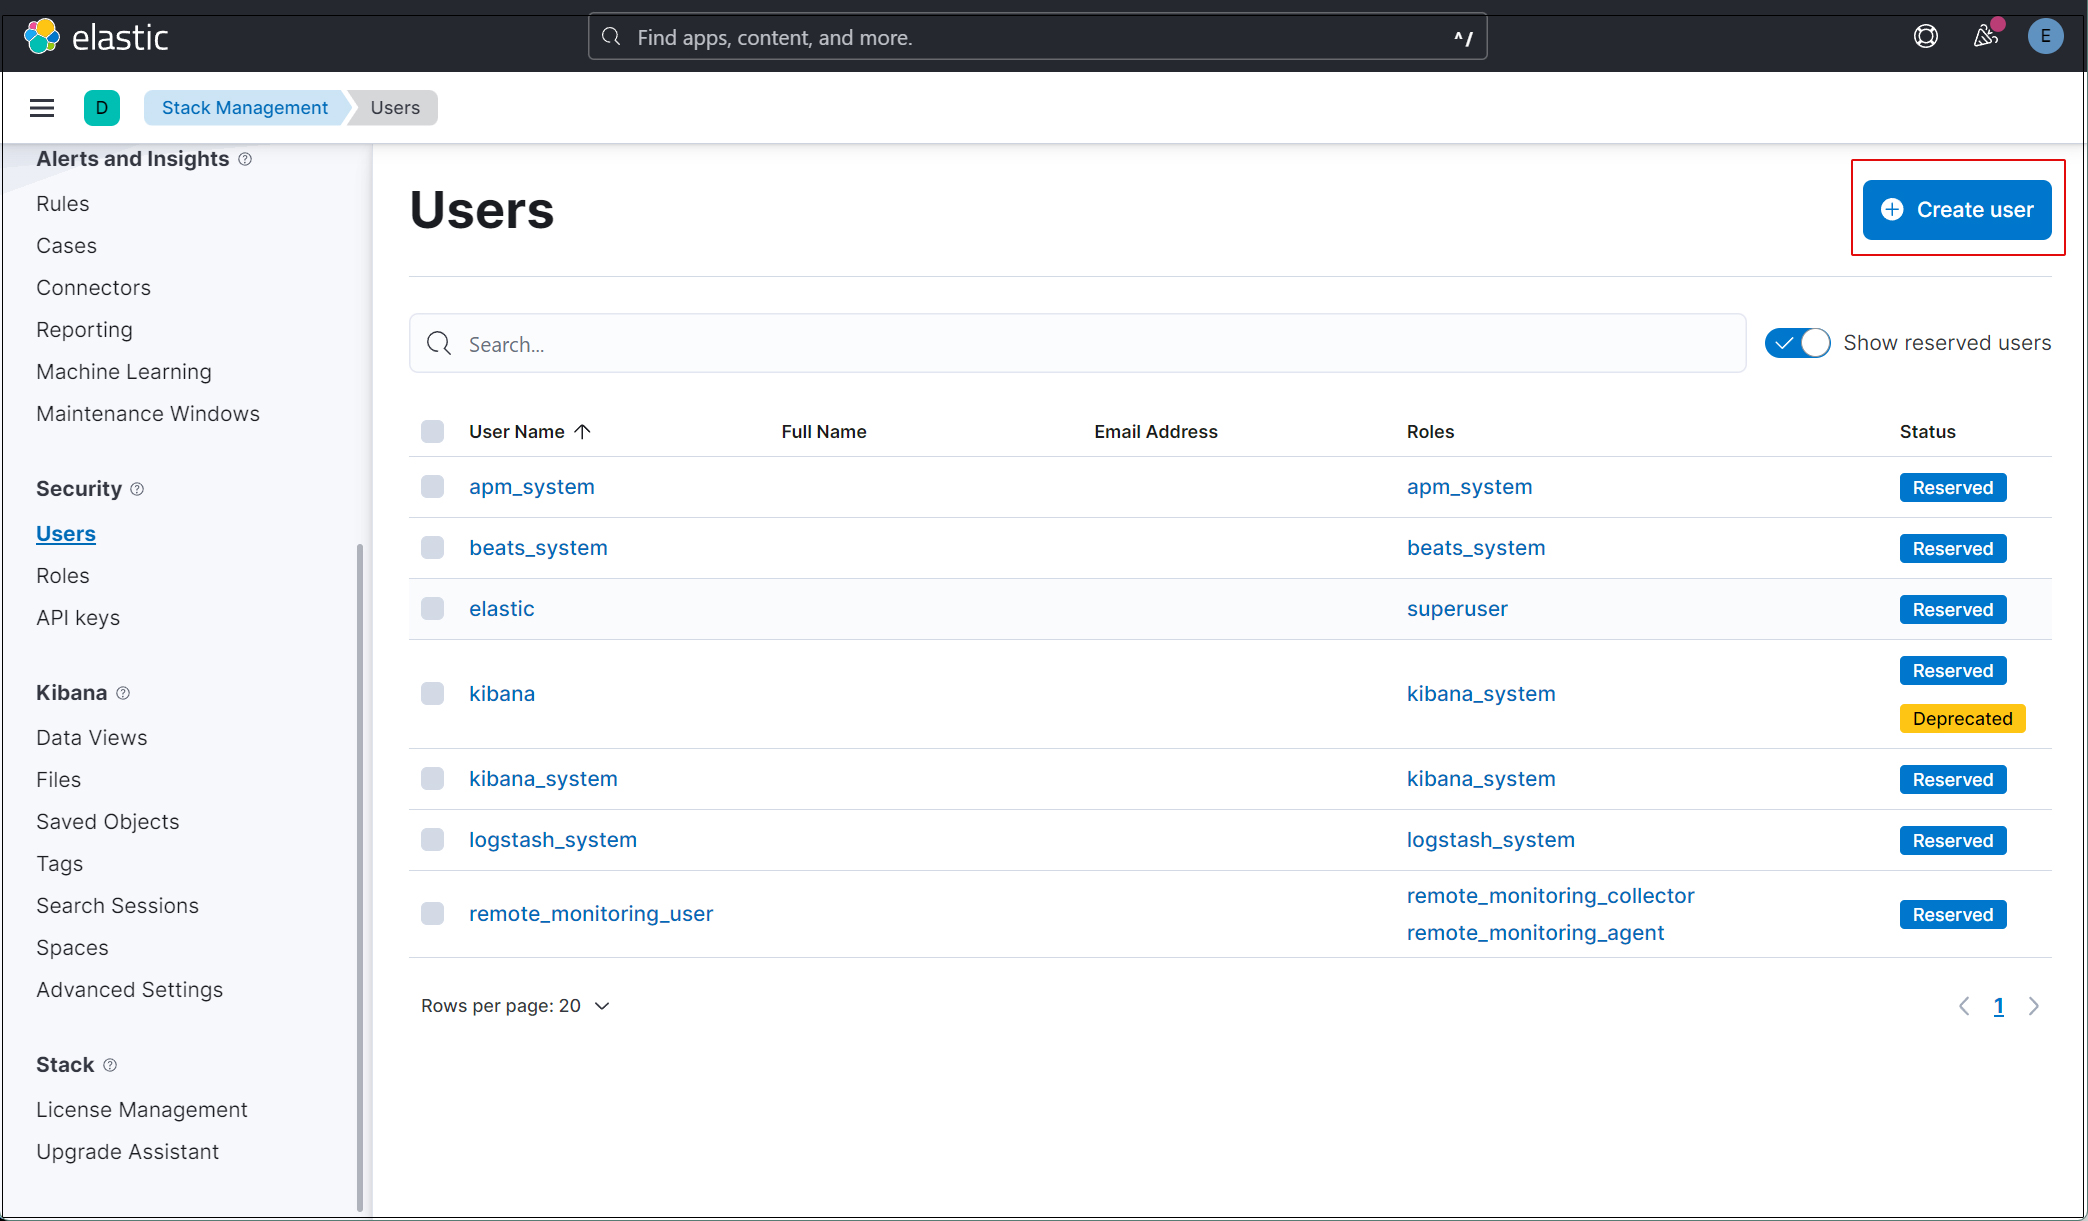
右上の"Create user"ボタンをクリック
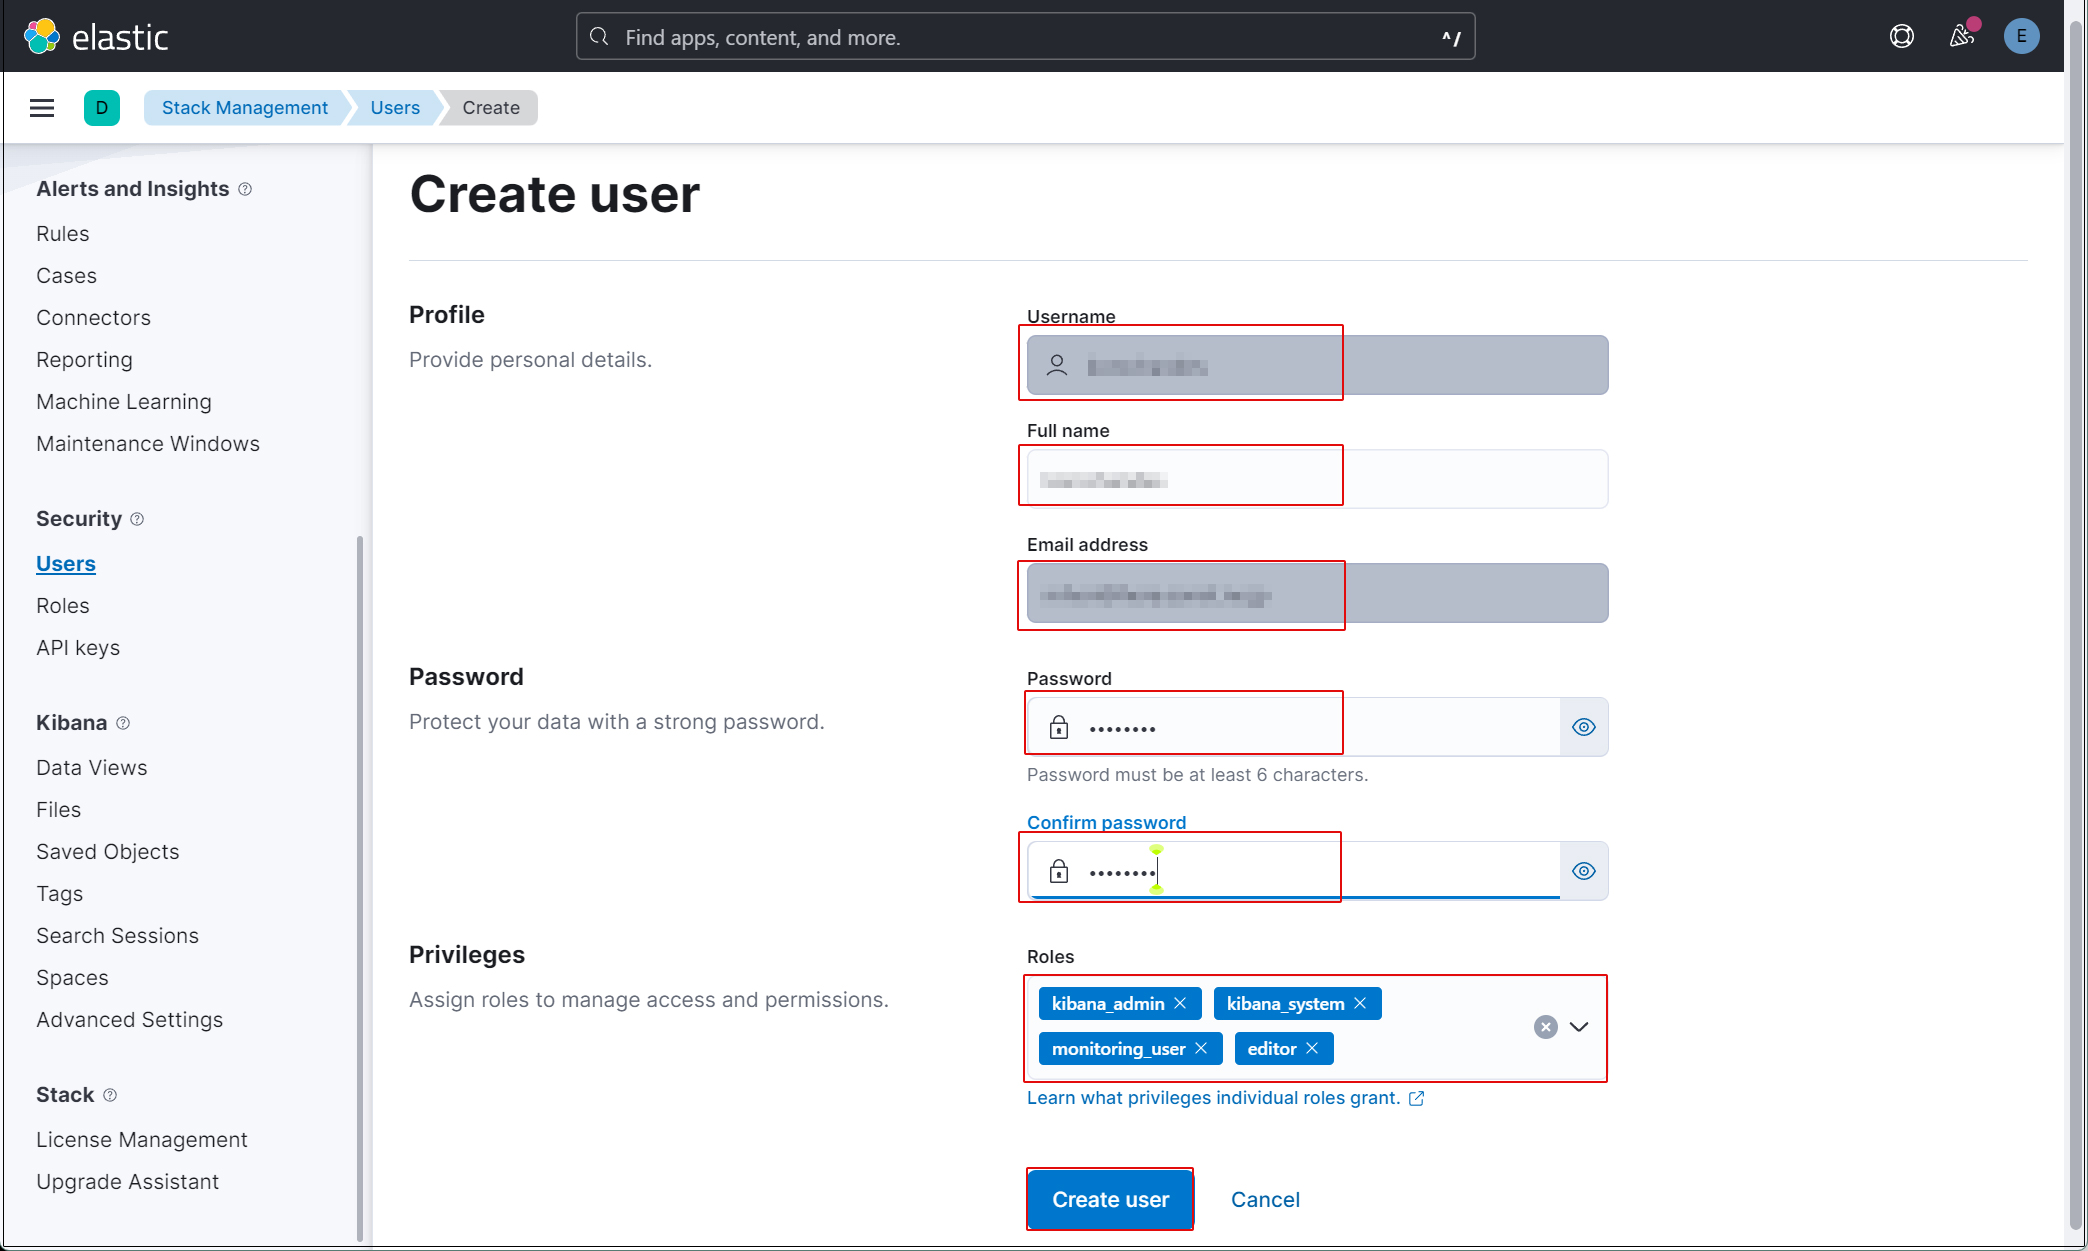
新規ユーザー情報を入力し、Privilegesでkibana_admin、kibana_system、monitoring_user、editorのロールを割り当てる
最後に[Create user]をクリックする
現在のプロファイルからログアウトし、新しく作成したユーザーアカウントでログインできることを確認する。現在、SURICATAのホストでFilebeatを設定していないため、Kibanaで表示できるデータがありません。
SURICATAサーバにFilebeatをインストール
本作業はSuricataをインストールした1台目のAlmaLinux9.8サーバーで作業する
1. Filebeat インストール
1.1 Elastic GPGキーをダウンロード
# rpm --import https://artifacts.elastic.co/GPG-KEY-elasticsearch
1.2 /etc/yum/yum.repos.dディレクトリにelasticsearch.repoファイルを以下の内容で、作成
# vi /etc/yum.repos.d/elasticsearch.repo

以下内容を記述
[elasticsearch]
name=Elasticsearch repository for 9.x packages
baseurl=https://artifacts.elastic.co/packages/9.x/yum
gpgcheck=1
gpgkey=https://artifacts.elastic.co/GPG-KEY-elasticsearch
enabled=0
autorefresh=1
type=rpm-md
1.3 Filebeatをインストール
# dnf -y install --enablerepo=elasticsearch filebeat
Installed:
  filebeat-9.4.3-1.x86_64

Complete!
1.4 Elasticsearch CA証明書作成
Elasticsearch CA証明書をダウンロードし、任意のディレクトリに保存します(今回は/etc/filebeat/elastic-ca.crtとして保存します)
※第2サーバー(AlmaLinux10.2 Elasticsearchを導入したサーバー)で9200ポートを開放しておく
# openssl s_client -connect 192.168.11.85:9200 \
-showcerts </dev/null 2>/dev/null | \
openssl x509 -outform PEM > /etc/filebeat/elastic-ca.crt
1.4 FilebeatをElasticsearchとKibanaに接続するように設定
# vi /etc/filebeat/filebeat.yml
●137行目コメントアウトされた#host: "localhost:5601"行の下に、KibanaインスタンスのプライベートIPアドレスとポートを指す行を追加する
host: "192.168.11.85:5601"
●164行目 : コメントアウト
#hosts: ["localhost:9200"]
●165行目 : Elasticsearch のipアドレスとポート番号を入力
hosts: ["https://192.168.11.85:9200"]
●171行目 : コメント解除
protocol: "https"
●172行目 : Elasticsearch CA証明書指定
ssl.certificate_authorities: ["/etc/filebeat/elastic-ca.crt"]
●175,176行目コメント解除し、[username]はデフォルトのままにし、[password]は[elastic]ユーザーのパスワードを入力する
username: "elastic"
password: “xxxxxxxxx"
1.5 設定ファイルテスト
# filebeat test config
Config OK
1.6 Filebeatsの組み込みSuricataモジュールを有効にする
# filebeat modules enable suricata
上記コマンドにより /etc/filebeat/modules.d/suricata.yml.disabled が/etc/filebeat/modules.d/suricata.yml になりますが内容は変化しませんので以下のように編集します
# vi /etc/filebeat/modules.d/suricata.yml

# Module: suricata
# Docs: https://www.elastic.co/guide/en/beats/filebeat/main/filebeat-module-suricata.html

- module: suricata
  # All logs
  eve:
    enabled: true
    var.paths: ["/var/log/suricata/eve.json"]

    # Set custom paths for the log files. If left empty,
    # Filebeat will choose the paths depending on your OS.
    #var.paths:
1.7 初期環境をセットアップ
Suricataサービスにpipeline
SIEMダッシュボードをElasticsearchにロードします
# filebeat setup -e
-----------------------------------------------------------------------------------
{"log.level":"info","@timestamp":"2026-07-02T13:05:27.903+0900","log.logger":"modules","log.origin":{"function":"github.com/elastic/beats/v7/filebeat/fileset.LoadPipeline","file.name":"fileset/pipelines.go","file.line":134},"message":"Elasticsearch pipeline loaded.","service.name":"filebeat","pipeline":"filebeat-9.4.3-suricata-eve-pipeline","ecs.version":"1.6.0"}
{"log.level":"info","@timestamp":"2026-07-02T13:05:27.961+0900","log.logger":"modules","log.origin":{"function":"github.com/elastic/beats/v7/filebeat/fileset.LoadPipeline","file.name":"fileset/pipelines.go","file.line":134},"message":"Elasticsearch pipeline loaded.","service.name":"filebeat","pipeline":"filebeat-9.4.3-suricata-eve-dns","ecs.version":"1.6.0"}
{"log.level":"info","@timestamp":"2026-07-02T13:05:28.034+0900","log.logger":"modules","log.origin":{"function":"github.com/elastic/beats/v7/filebeat/fileset.LoadPipeline","file.name":"fileset/pipelines.go","file.line":134},"message":"Elasticsearch pipeline loaded.","service.name":"filebeat","pipeline":"filebeat-9.4.3-suricata-eve-dns-answer-v1","ecs.version":"1.6.0"}
{"log.level":"info","@timestamp":"2026-07-02T13:05:28.119+0900","log.logger":"modules","log.origin":{"function":"github.com/elastic/beats/v7/filebeat/fileset.LoadPipeline","file.name":"fileset/pipelines.go","file.line":134},"message":"Elasticsearch pipeline loaded.","service.name":"filebeat","pipeline":"filebeat-9.4.3-suricata-eve-dns-answer-v2","ecs.version":"1.6.0"}
{"log.level":"info","@timestamp":"2026-07-02T13:05:28.231+0900","log.logger":"modules","log.origin":{"function":"github.com/elastic/beats/v7/filebeat/fileset.LoadPipeline","file.name":"fileset/pipelines.go","file.line":134},"message":"Elasticsearch pipeline loaded.","service.name":"filebeat","pipeline":"filebeat-9.4.3-suricata-eve-tls","ecs.version":"1.6.0"}
{"log.level":"info","@timestamp":"2026-07-02T13:05:28.282+0900","log.logger":"modules","log.origin":{"function":"github.com/elastic/beats/v7/filebeat/fileset.LoadPipeline","file.name":"fileset/pipelines.go","file.line":134},"message":"Elasticsearch pipeline loaded.","service.name":"filebeat","pipeline":"filebeat-9.4.3-suricata-eve-http","ecs.version":"1.6.0"}
-----------------------------------------------------------------------------------
1.6 Filebeatサービスを開始
# systemctl start filebeat.service
2. Kibanaで確認
作成したユーザーでKibanaにログインし直します。http://192.168.11.85:5601にアクセスします。
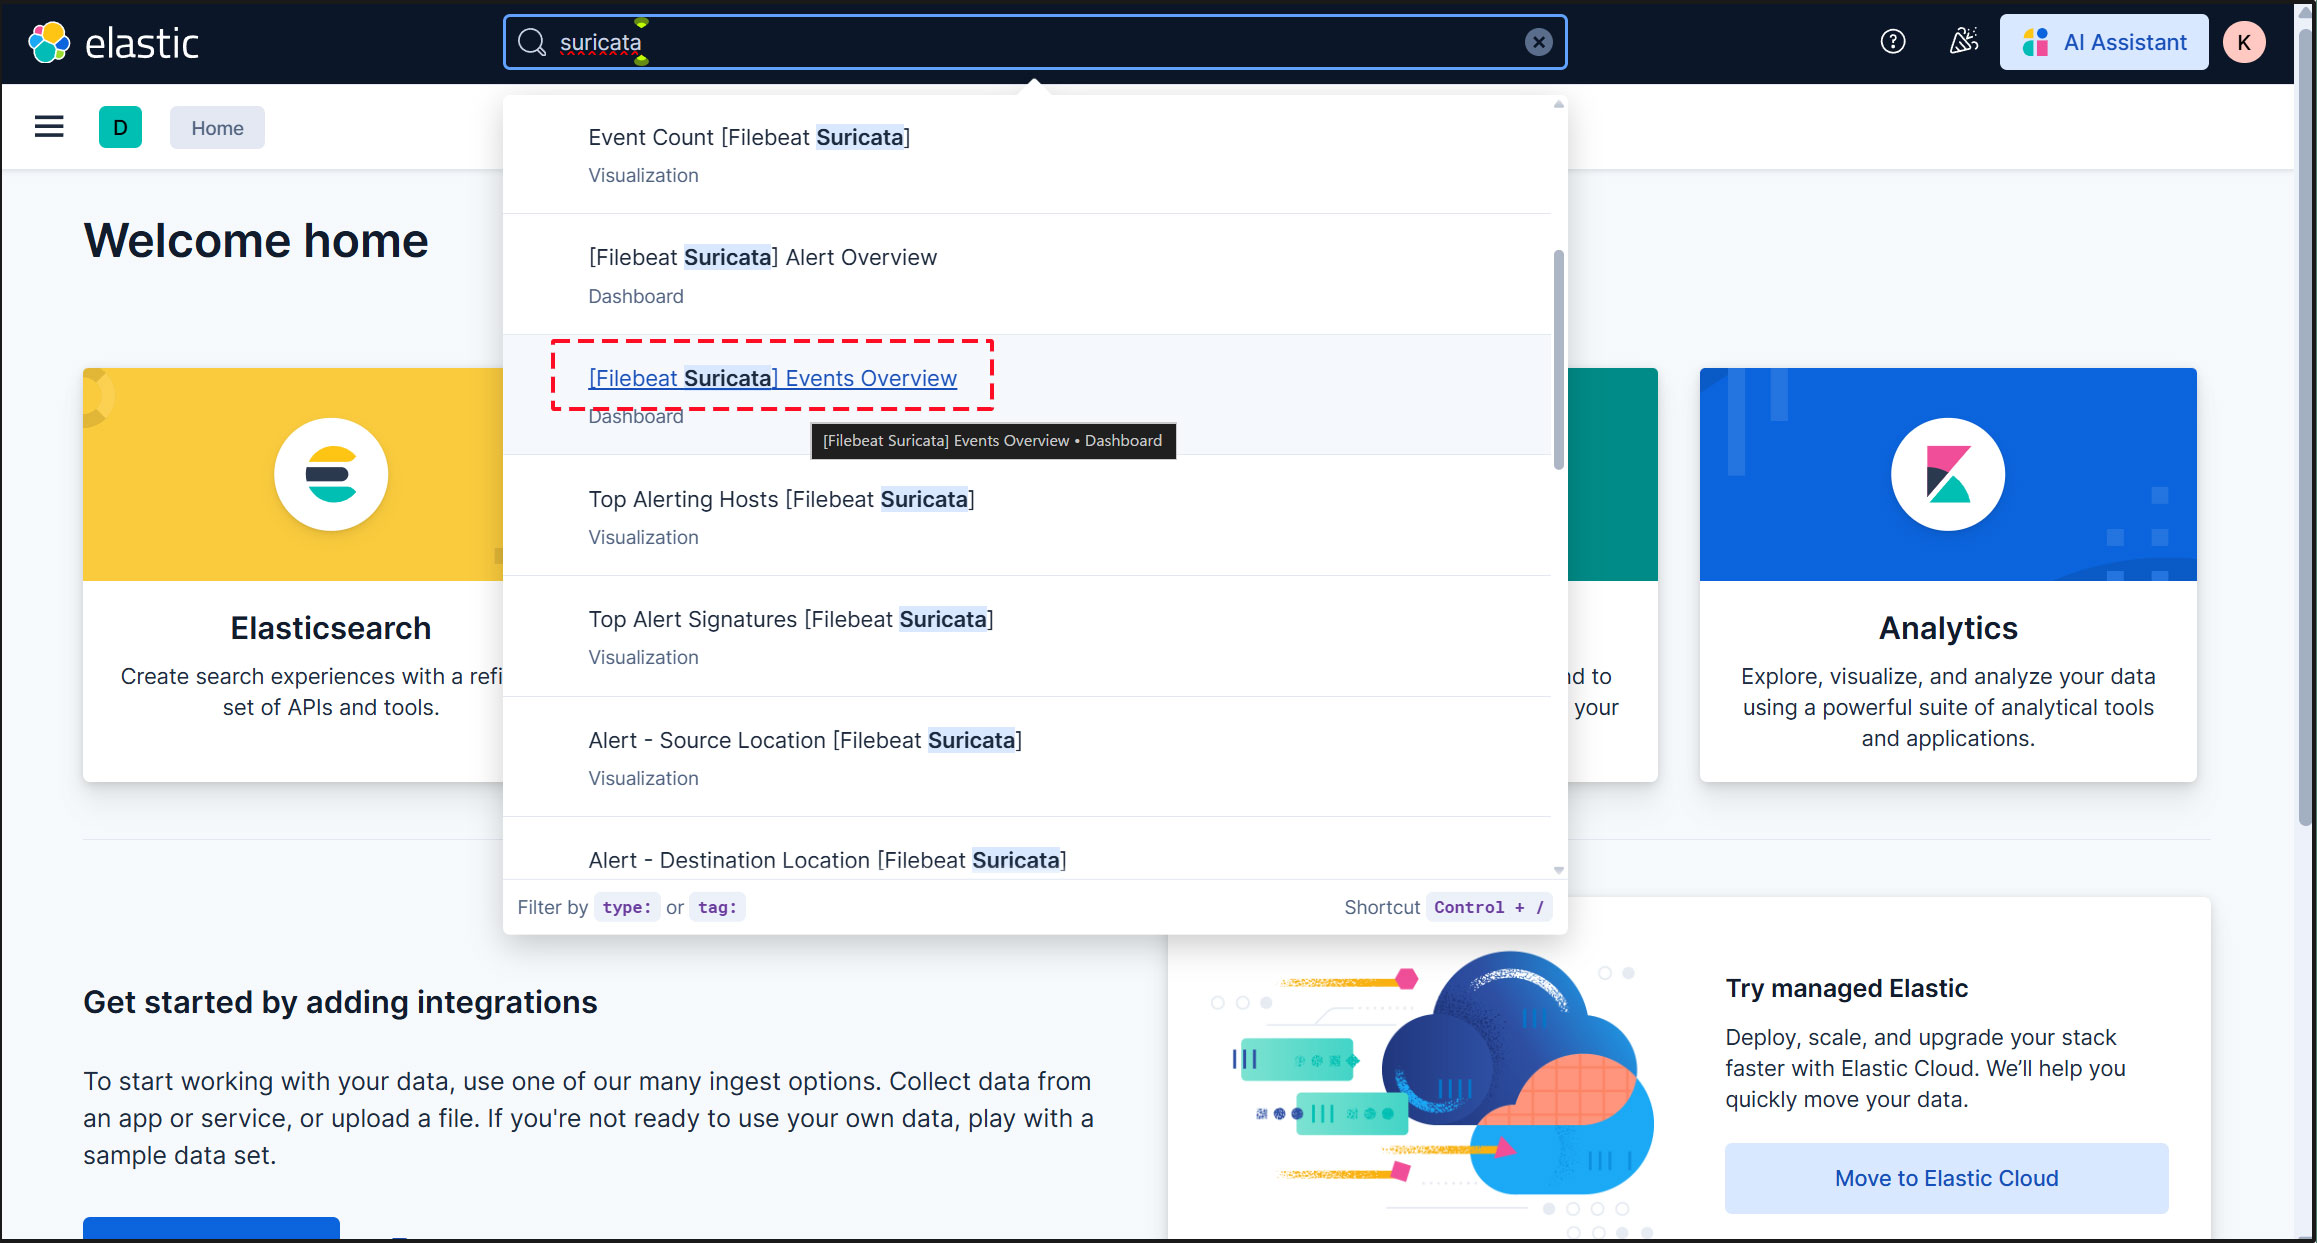
一番上の検索フィールドに「Suricata Events Overview」と入力し、[Filebeat Suricata] Events Overviewをクリック
過去 15 分間のすべての Suricata イベントが表示されます
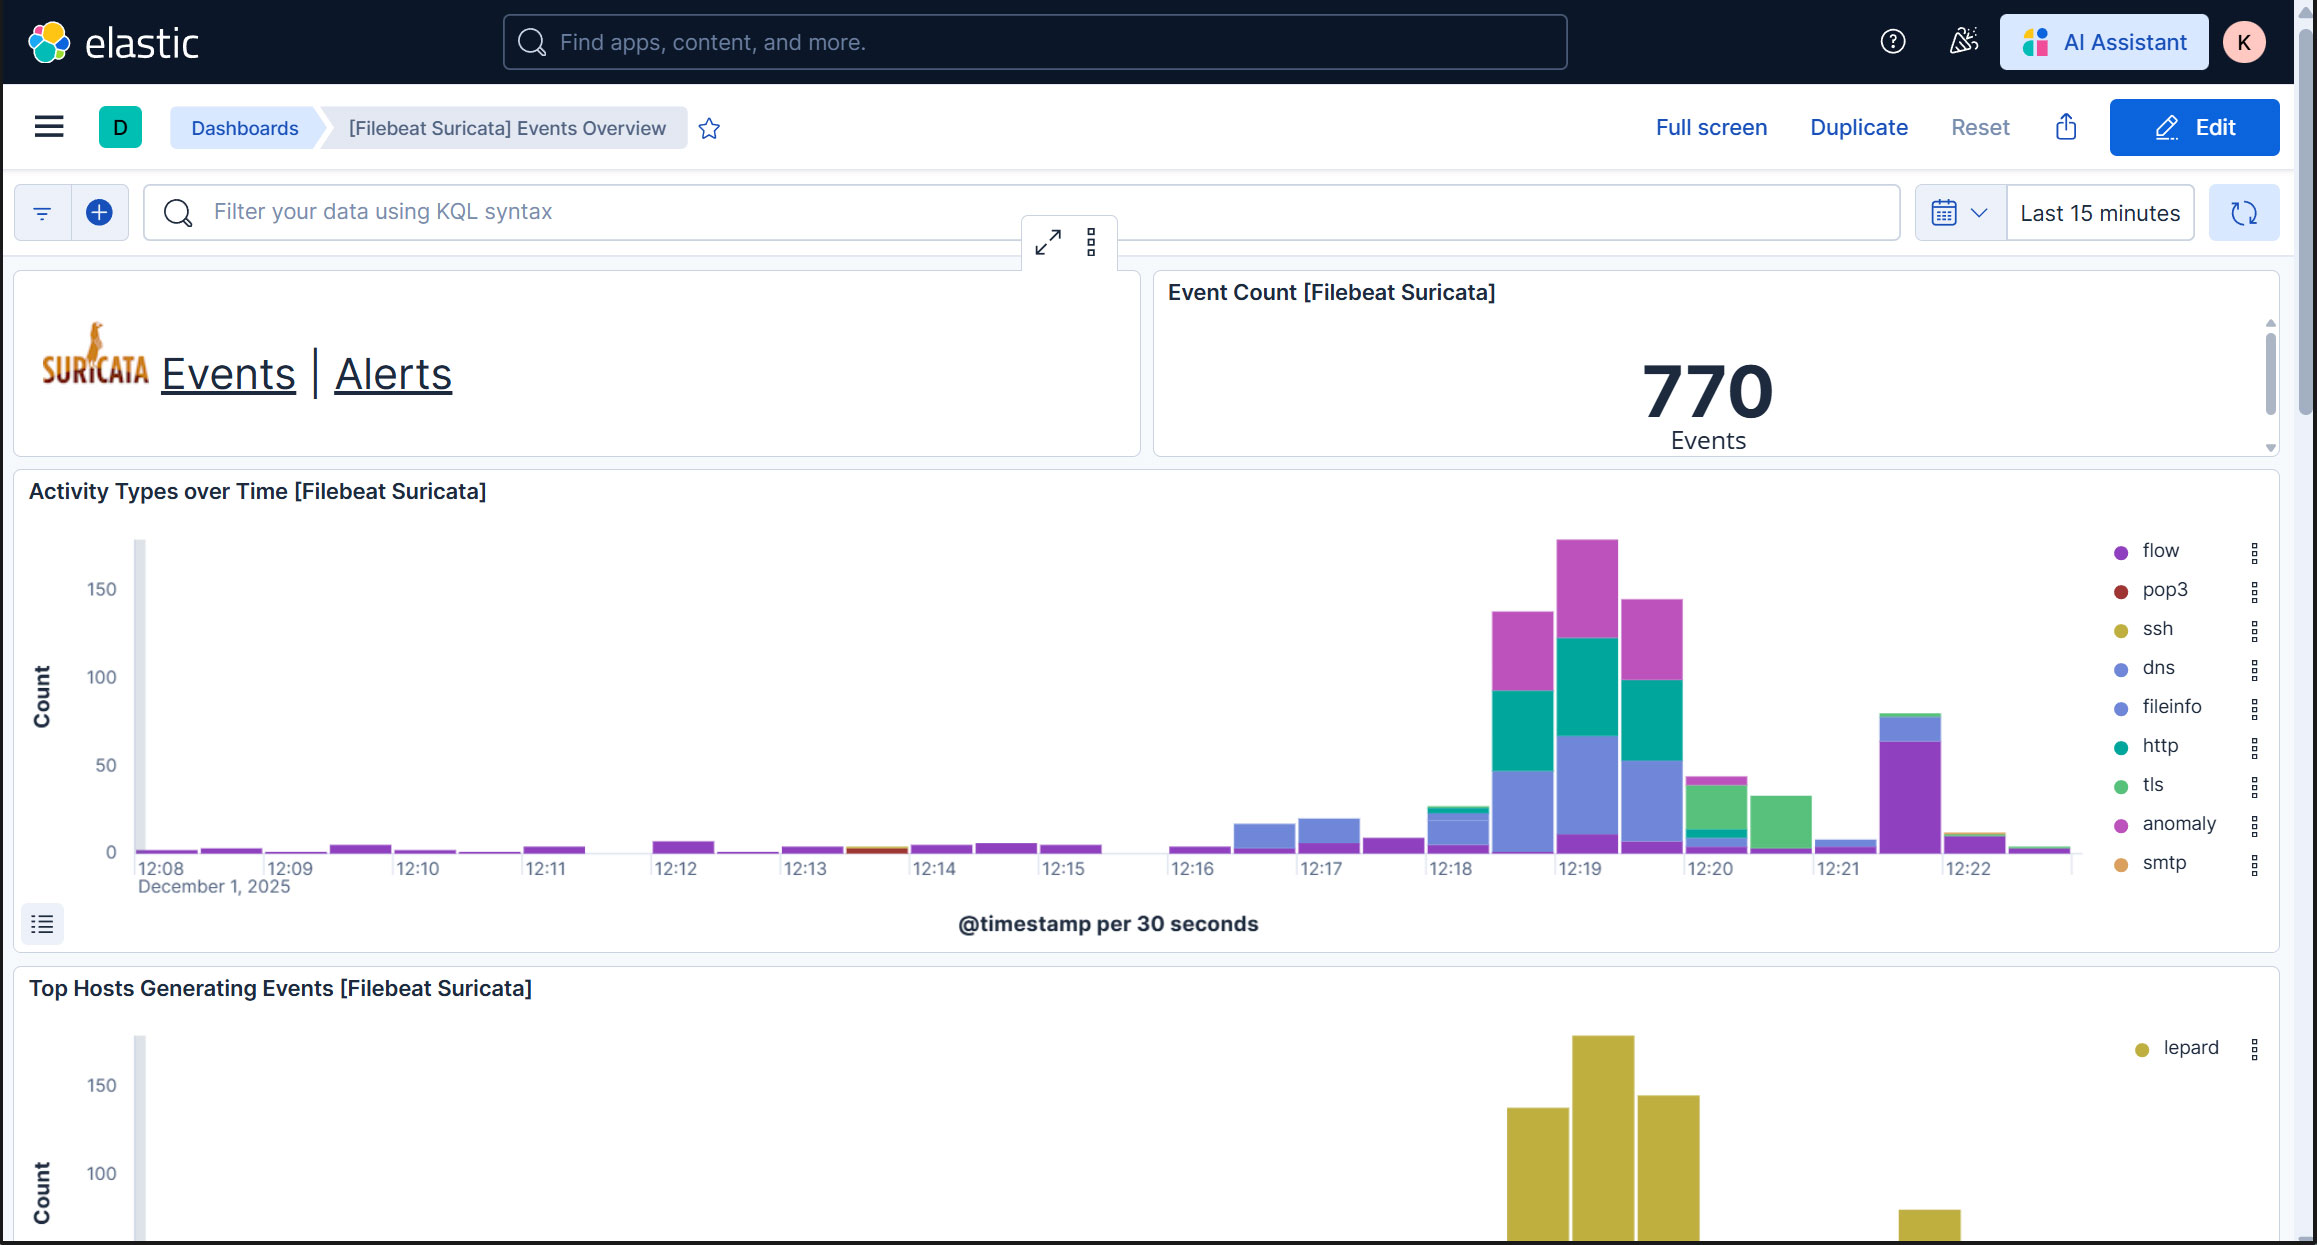
悪質なトラフィックのアラートを表示するにはSuricataロゴの横にあるAlertsテキストをクリック
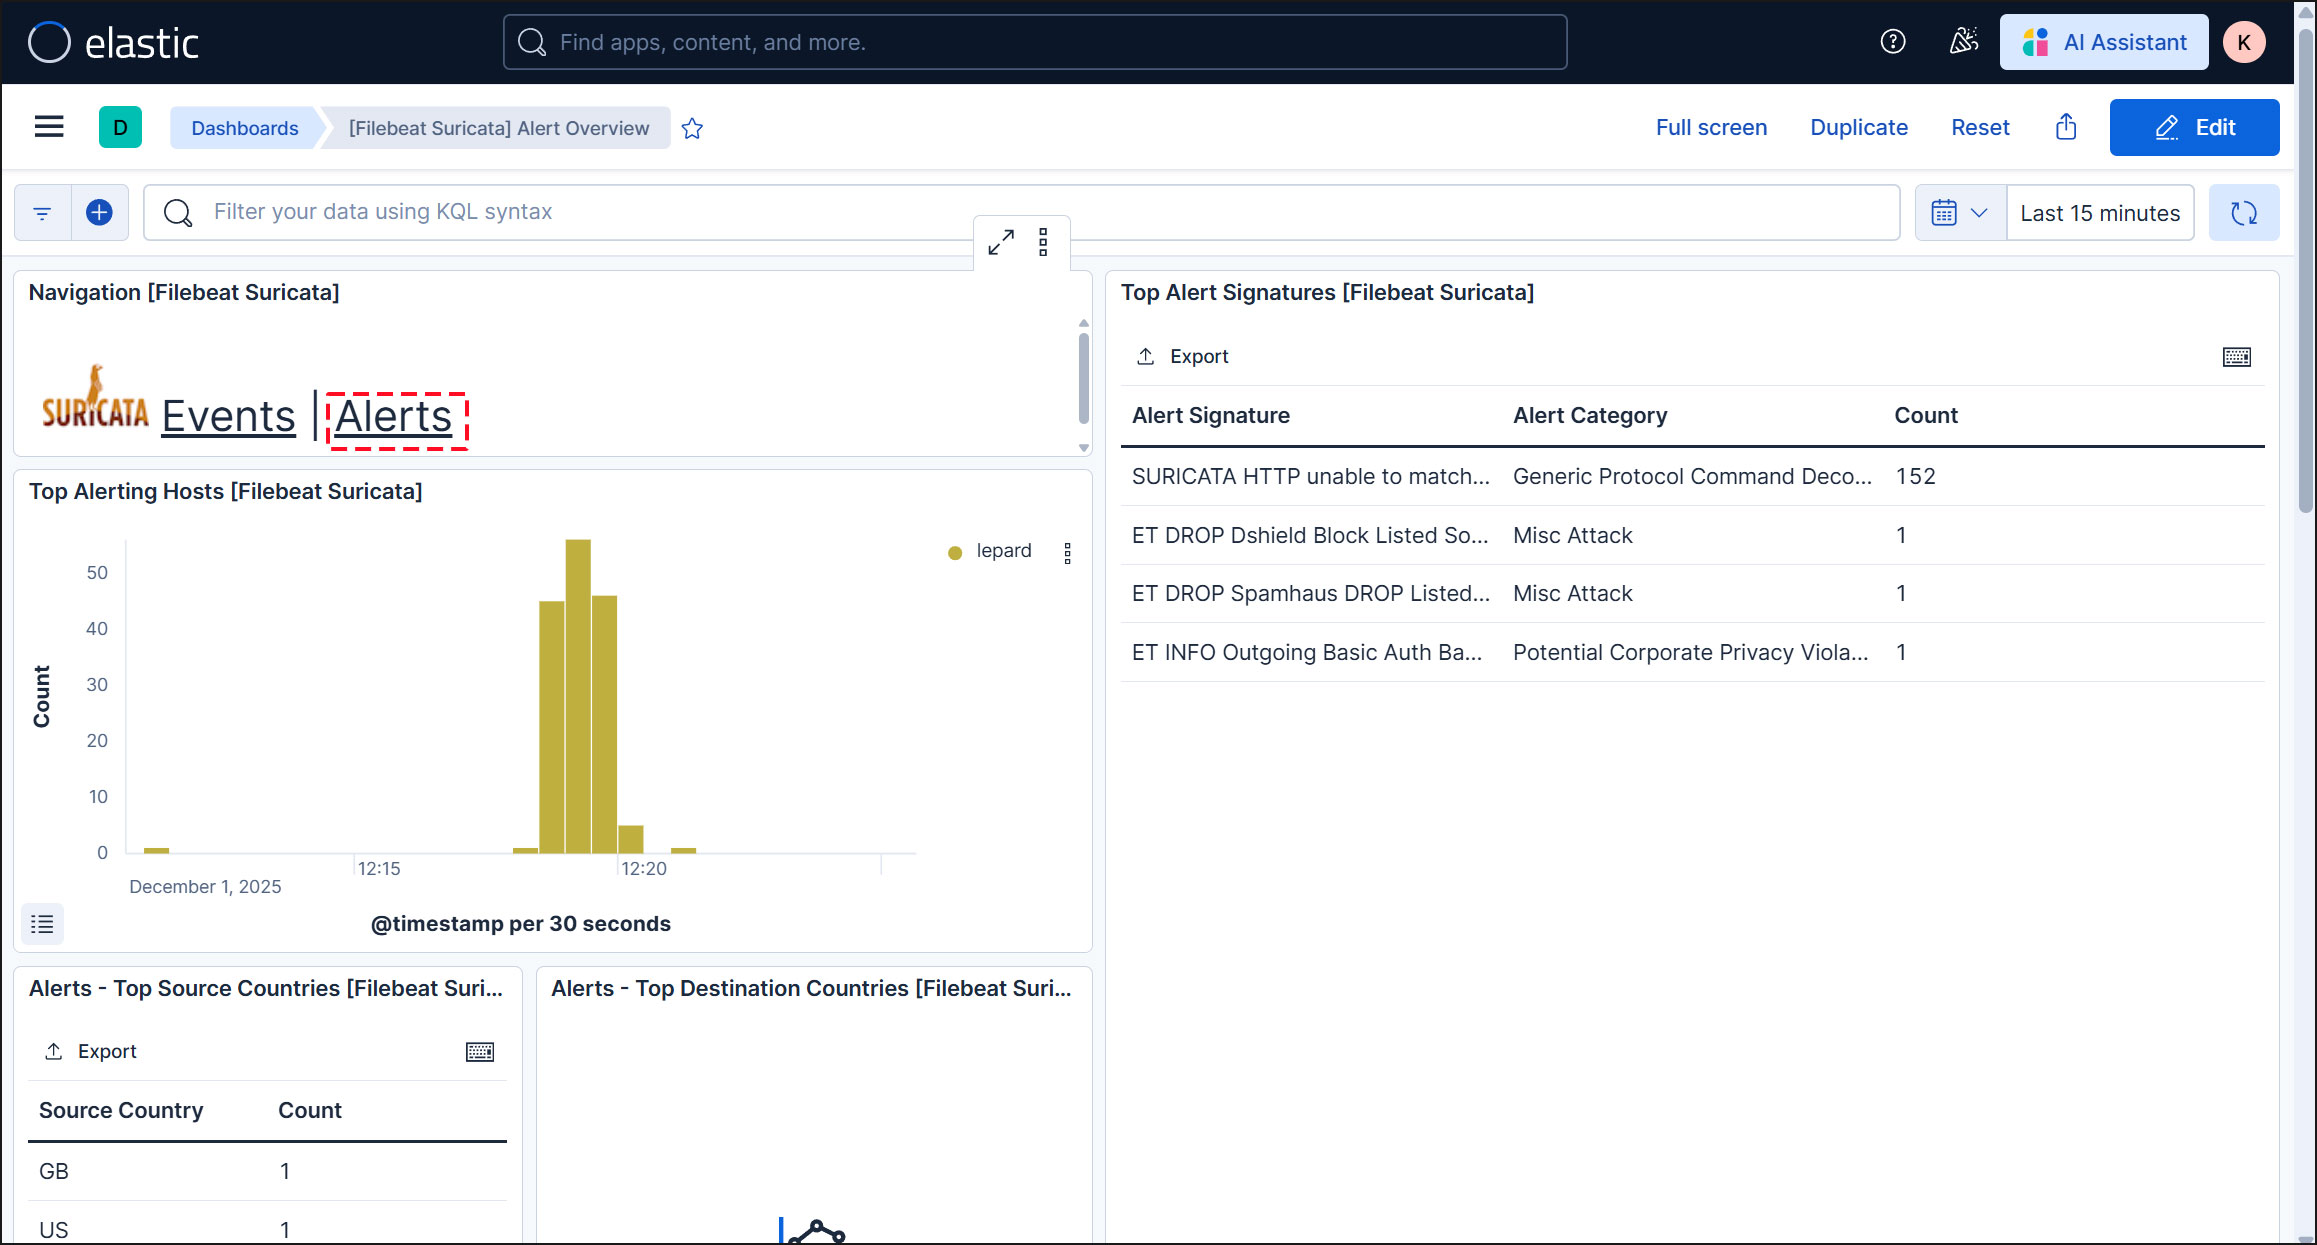
Kibana には、ログを視覚化するためのさまざまな機能とツールがありますのでいろいろと試してください。