"Nagios Server," an open-source integrated monitoring software
Nagios is an open-source monitoring solution that runs on Linux.
Nagios was developed by Ethan Galstad and first released in 1999. Subsequently, the project was refined as an open-source project by several contributors.。
Nagios is designed to periodically check critical parameters of networks, applications, or servers. These parameters include microprocessor load, number of running processes, log files, disk and memory usage, as well as many other services such as SMTP (Simple Mail Transfer Protocol), HTTP (Hypertext Transfer Protocol), and POP3 (Post Office Protocol 3).
To run Nagois, you need PHP, a database such as MySQL, and a web server such as Apache or Nginx. This time, we will proceed assuming all of these are already configured.
1.Nagios Install
# zypper -n install nagios
2. Creating Nagios Web Users
Create a user account to access the Nagios Web dashboard. This user account is used for authentication.
The default user name is nagiosadmin, defined as the preferred user name within the /etc/nagios/cgi.cfg file.
# htpasswd -c /etc/nagios/htpasswd.users nagiosadmin
New password:  [password]
Re-type new password:  [again password]
Adding password for user nagiosadmin
Set ownership and permissions
# chown wwwrun:wwwrun /etc/nagios/htpasswd.users
# chmod 640 /etc/nagios/htpasswd.users
Restart Apache
# systemctl restart apache2
Create the necessary directories and set ownership
# mkdir /var/lib/nagios/rw/
# chown -R nagios:nagios /var/lib/nagios/rw/
Editing Nagios System Services
Add Type=single to [Service]
# vi /usr/lib/systemd/system/nagios.service

 [Unit]
Description=Network Monitor Nagios
After=syslog.target network.target

[Service]
# for details of the additional system hardening configuration please see
# https://en.opensuse.org/openSUSE:Security_Features#Systemd_hardening_effort
ProtectSystem=full
ProtectHome=true
ProtectHostname=true
ProtectKernelTunables=true
ProtectKernelModules=true
ProtectControlGroups=true
RestrictRealtime=true
# end of system hardening
ExecStartPre=/usr/sbin/nagios -v /etc/nagios/nagios.cfg
ExecStart=/usr/sbin/nagios /etc/nagios/nagios.cfg
ExecStopPost=/usr/bin/rm -f /var/spool/nagios/nagios.cmd
ExecReload=/usr/sbin/nagios -v /etc/nagios/nagios.cfg
ExecReload=kill -HUP $MAINPID
Type=single

[Install]
WantedBy=multi-user.target
Alias=monitoring_daemon.service
Start and Enable Nagios Services
# systemctl daemon-reload
# systemctl start nagios
# systemctl enable nagios --now
Created symlink '/etc/systemd/system/monitoring_daemon.service' → '/usr/lib/systemd/system/nagios.service'.
Created symlink '/etc/systemd/system/multi-user.target.wants/nagios.service' → '/usr/lib/systemd/system/nagios.service'.
Restart the system
# shutdown -r now
Verify that the service is running
# systemctl status nagios

● nagios.service - Network Monitor Nagios
     Loaded: loaded (/usr/lib/systemd/system/nagios.service; enabled; preset: disabled)
     Active: active (running) since Wed 2026-06-24 13:47:06 JST; 48s ago
 Invocation: b3b8bc58106545b1b7e22b2a75dd3424
    Process: 930 ExecStartPre=/usr/sbin/nagios -v /etc/nagios/nagios.cfg (code=exited, status=0/SUCCESS)
   Main PID: 943 (nagios)
      Tasks: 8 (limit: 4541)
        CPU: 114ms
     CGroup: /system.slice/nagios.service
             tq943 /usr/sbin/nagios /etc/nagios/nagios.cfg
             tq944 /usr/sbin/nagios --worker /var/lib/nagios/nagios.qh
             tq945 /usr/sbin/nagios --worker /var/lib/nagios/nagios.qh
             tq946 /usr/sbin/nagios --worker /var/lib/nagios/nagios.qh
             tq947 /usr/sbin/nagios --worker /var/lib/nagios/nagios.qh
             tq948 /usr/sbin/nagios --worker /var/lib/nagios/nagios.qh
             tq949 /usr/sbin/nagios --worker /var/lib/nagios/nagios.qh
             mq950 /usr/sbin/nagios /etc/nagios/nagios.cfg

Jun 24 13:47:06 Lepard nagios[943]: wproc: Registry request: name=Core Worker 946;pid=946
Jun 24 13:47:06 Lepard nagios[943]: wproc: Registry request: name=Core Worker 948;pid=948
Jun 24 13:47:06 Lepard nagios[943]: wproc: Registry request: name=Core Worker 947;pid=947
Jun 24 13:47:06 Lepard nagios[943]: wproc: Registry request: name=Core Worker 946;pid=946
Jun 24 13:47:06 Lepard nagios[943]: wproc: Registry request: name=Core Worker 944;pid=944
3. Access the Nagios Web Interface
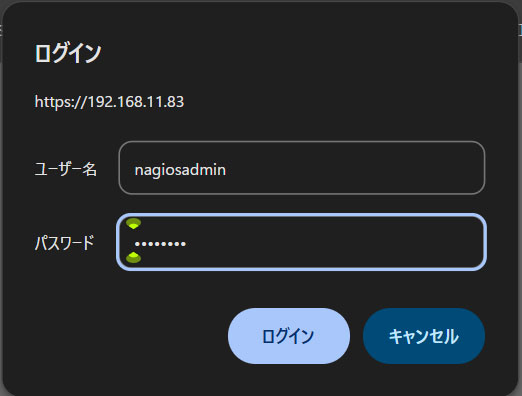
Access http://[IP_Address]/nagios/ in any browser. Enter nagiosadmin for [Username] and the password you specified when creating the user above for [Password], then click [Sign in].
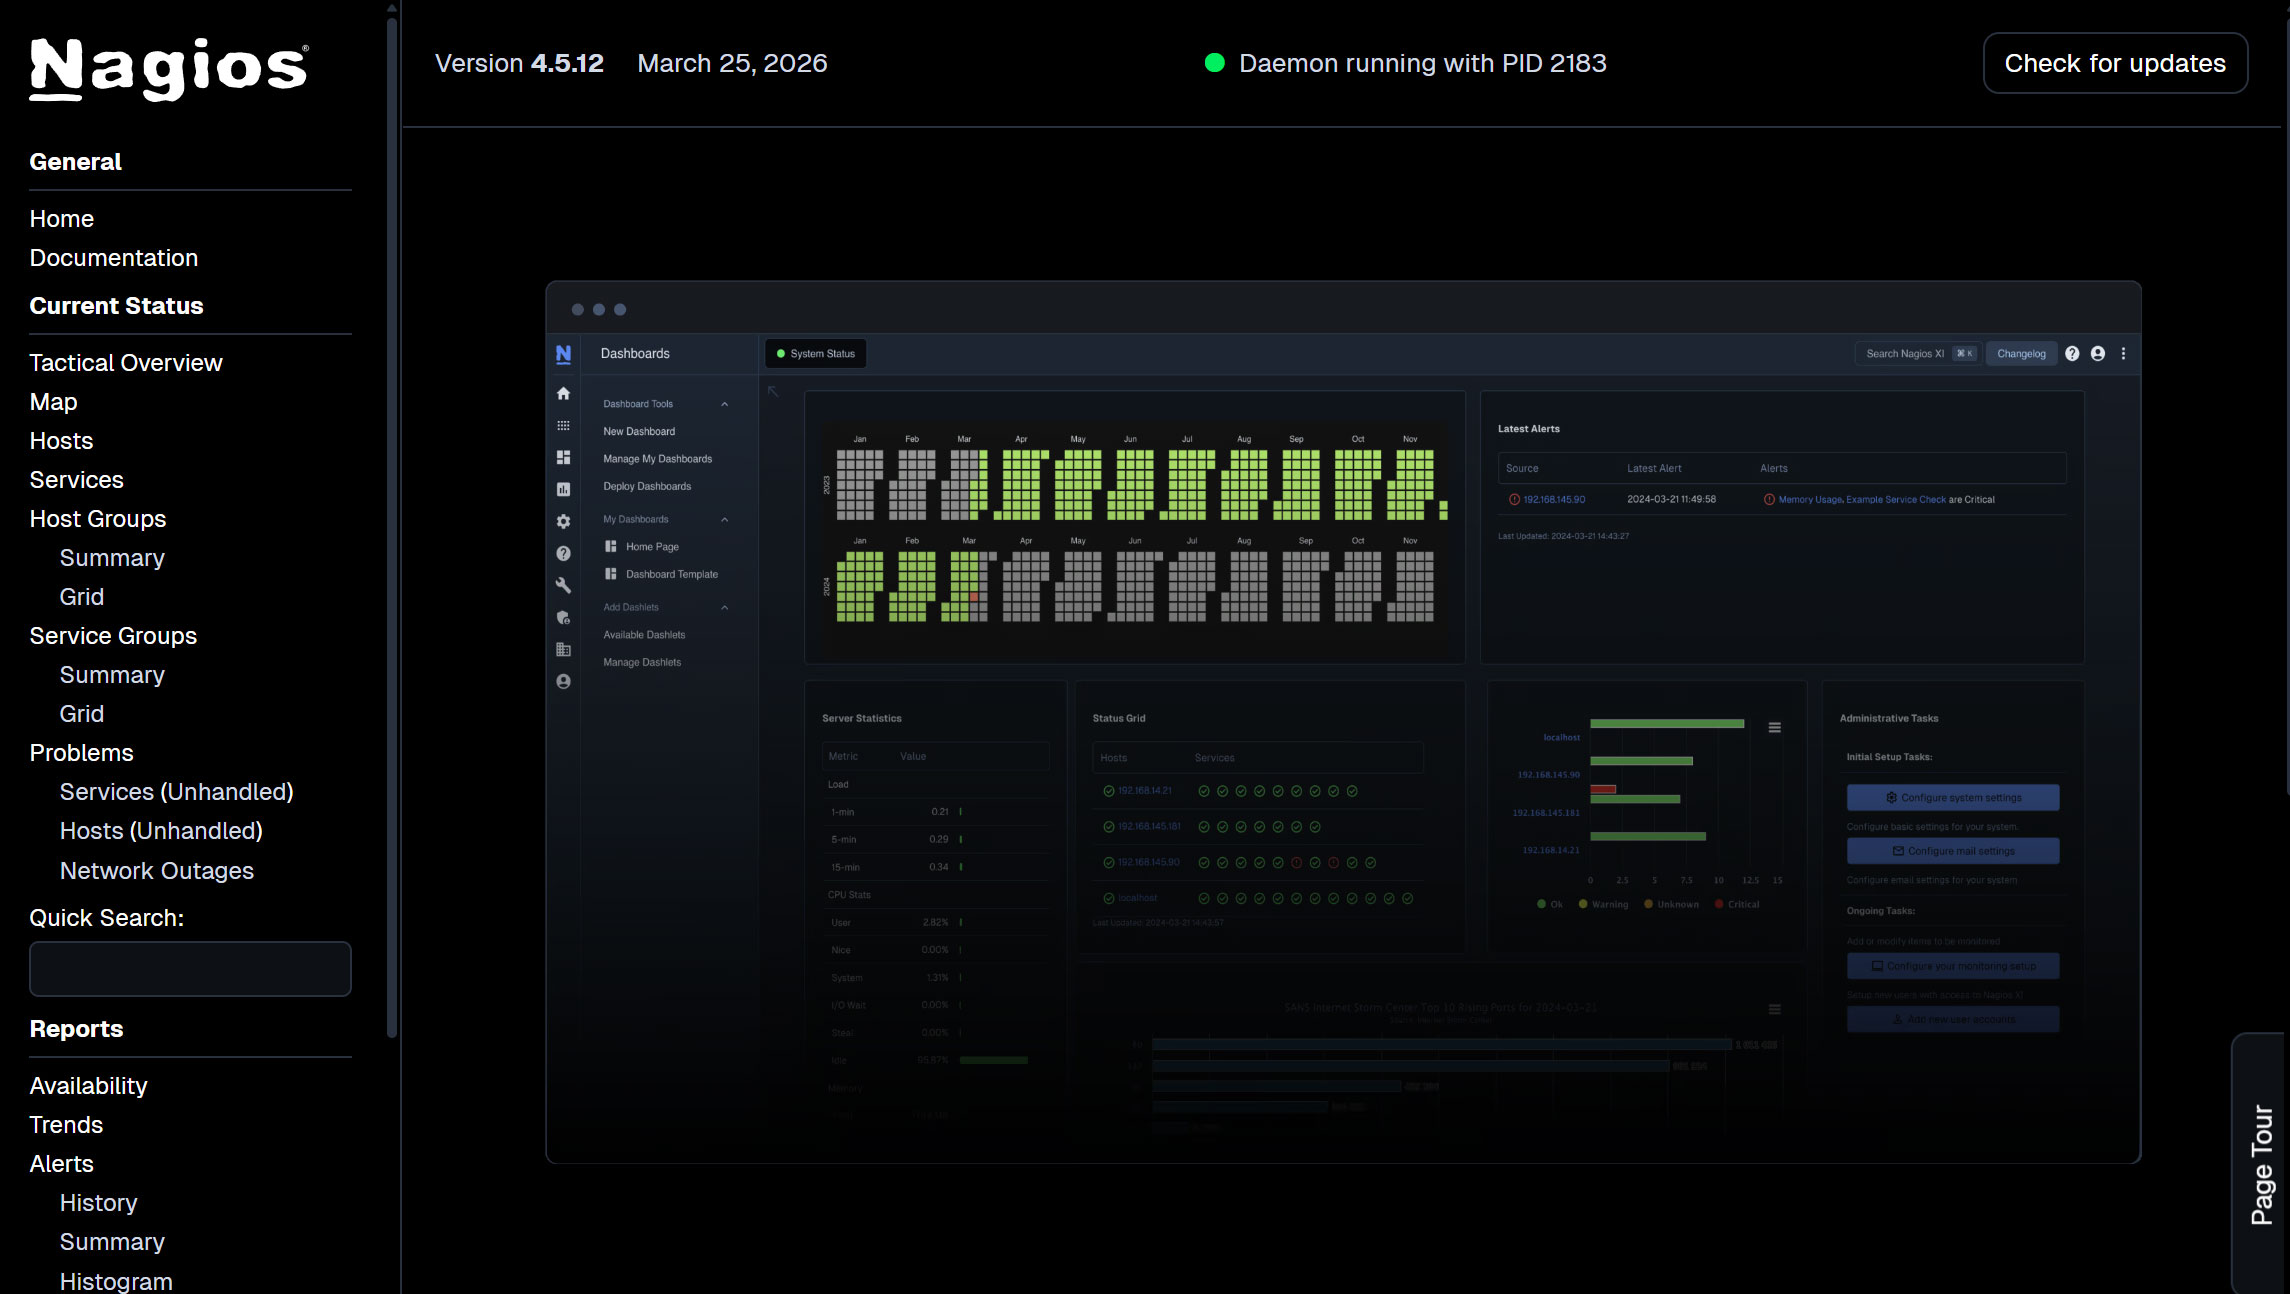
After successfully logging in, the following dashboard will be displayed.
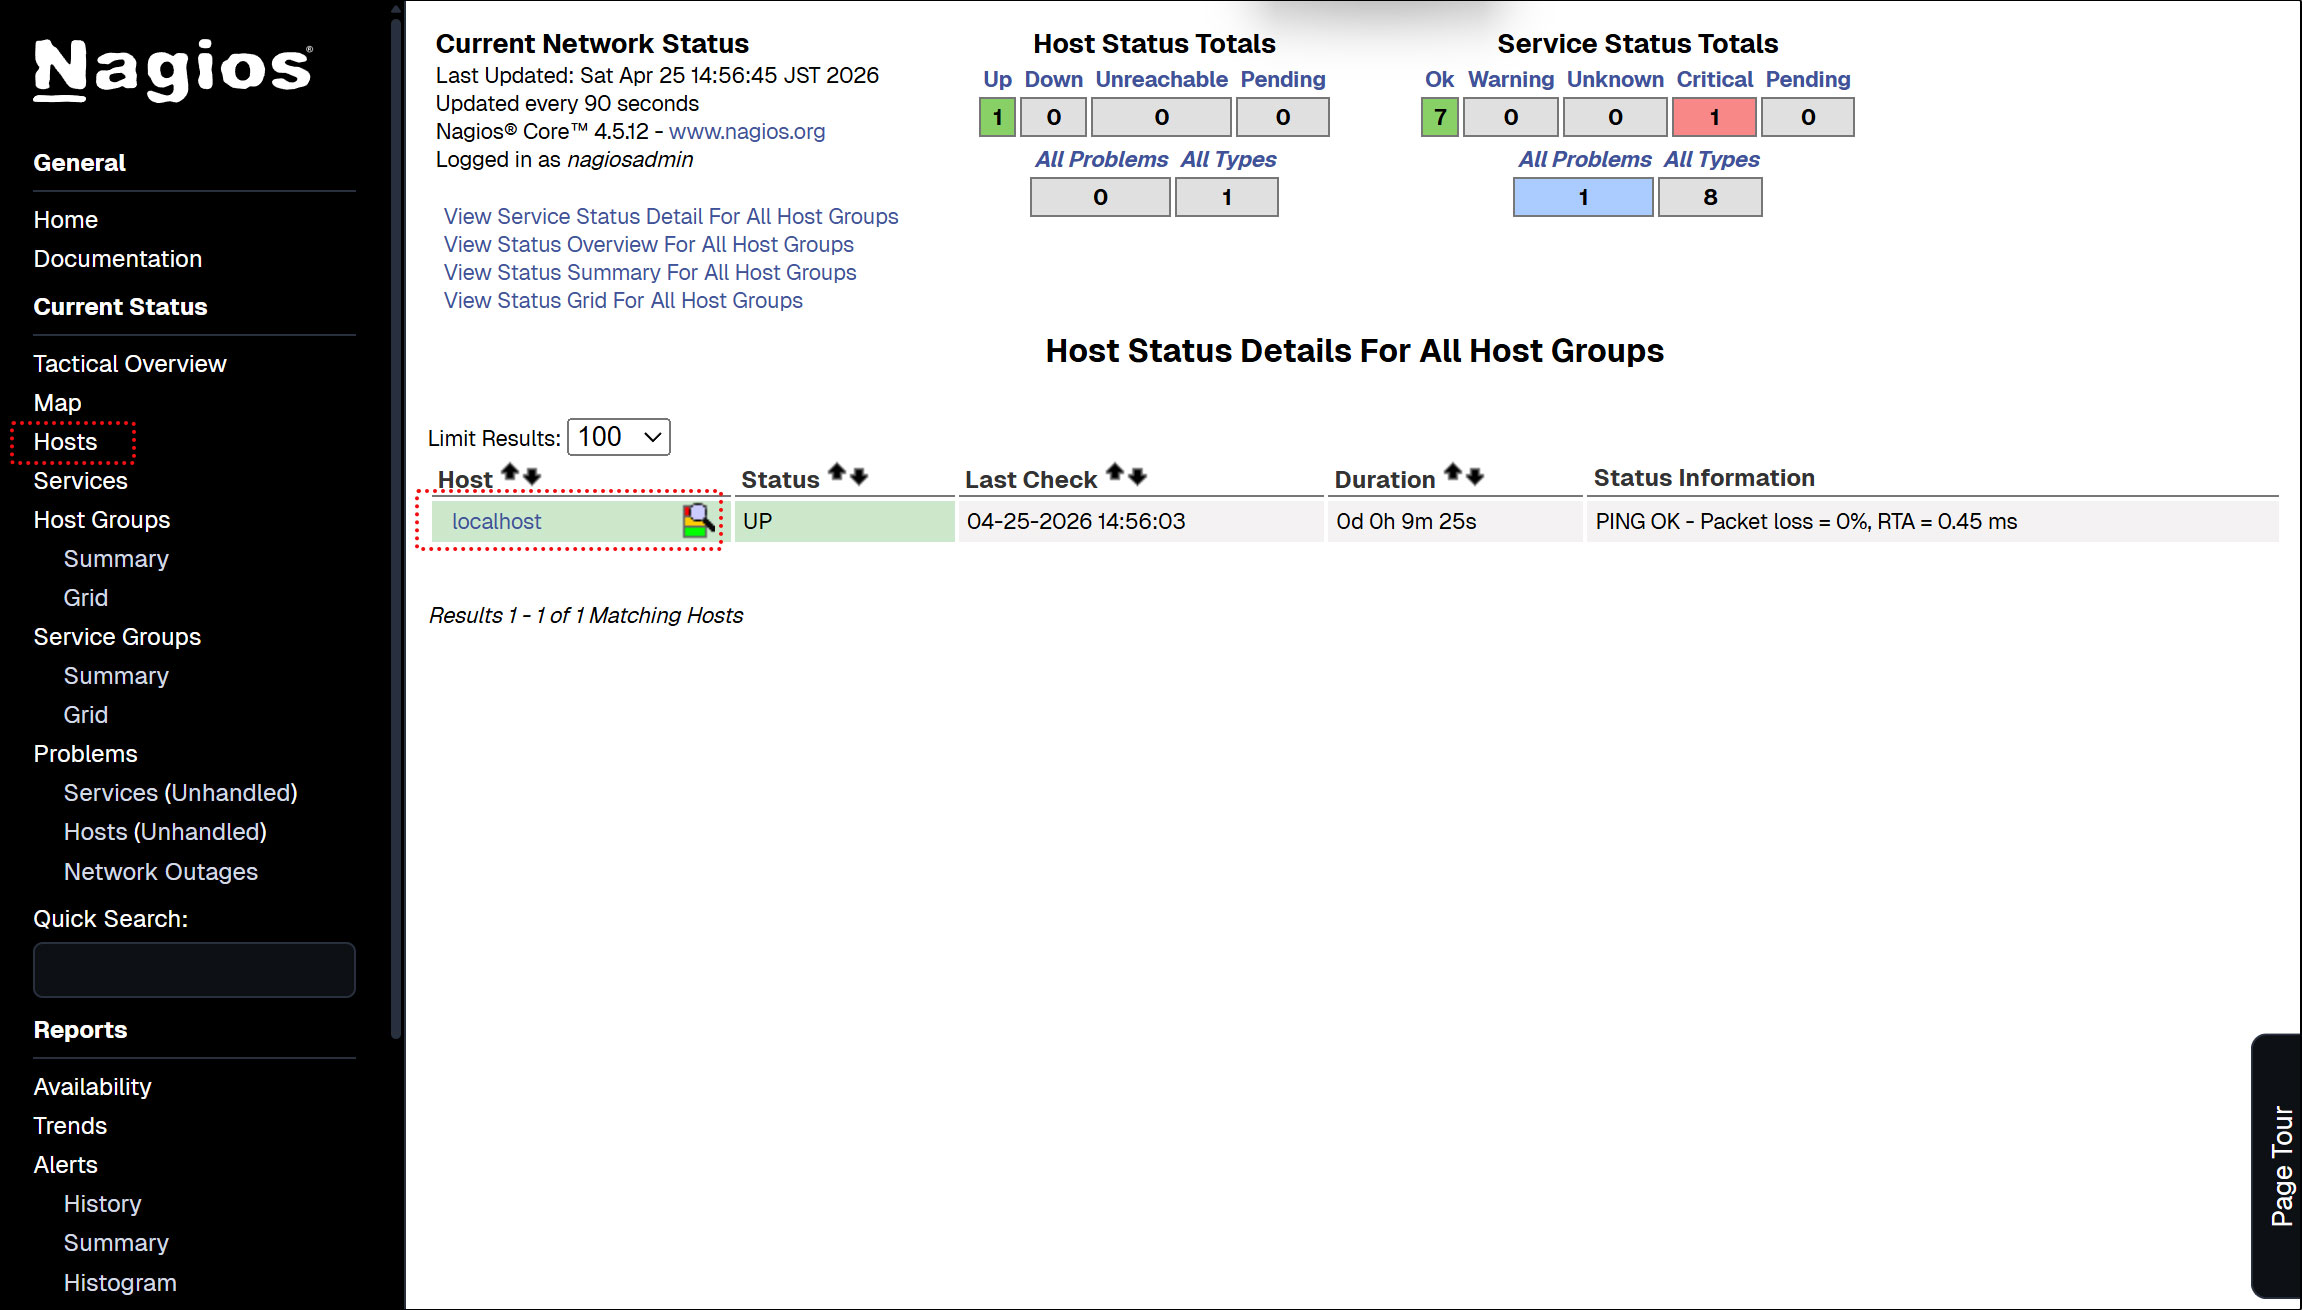
Display host availability
Click [Hosts] in the left menu—currently, only the Nagios Server is displayed.
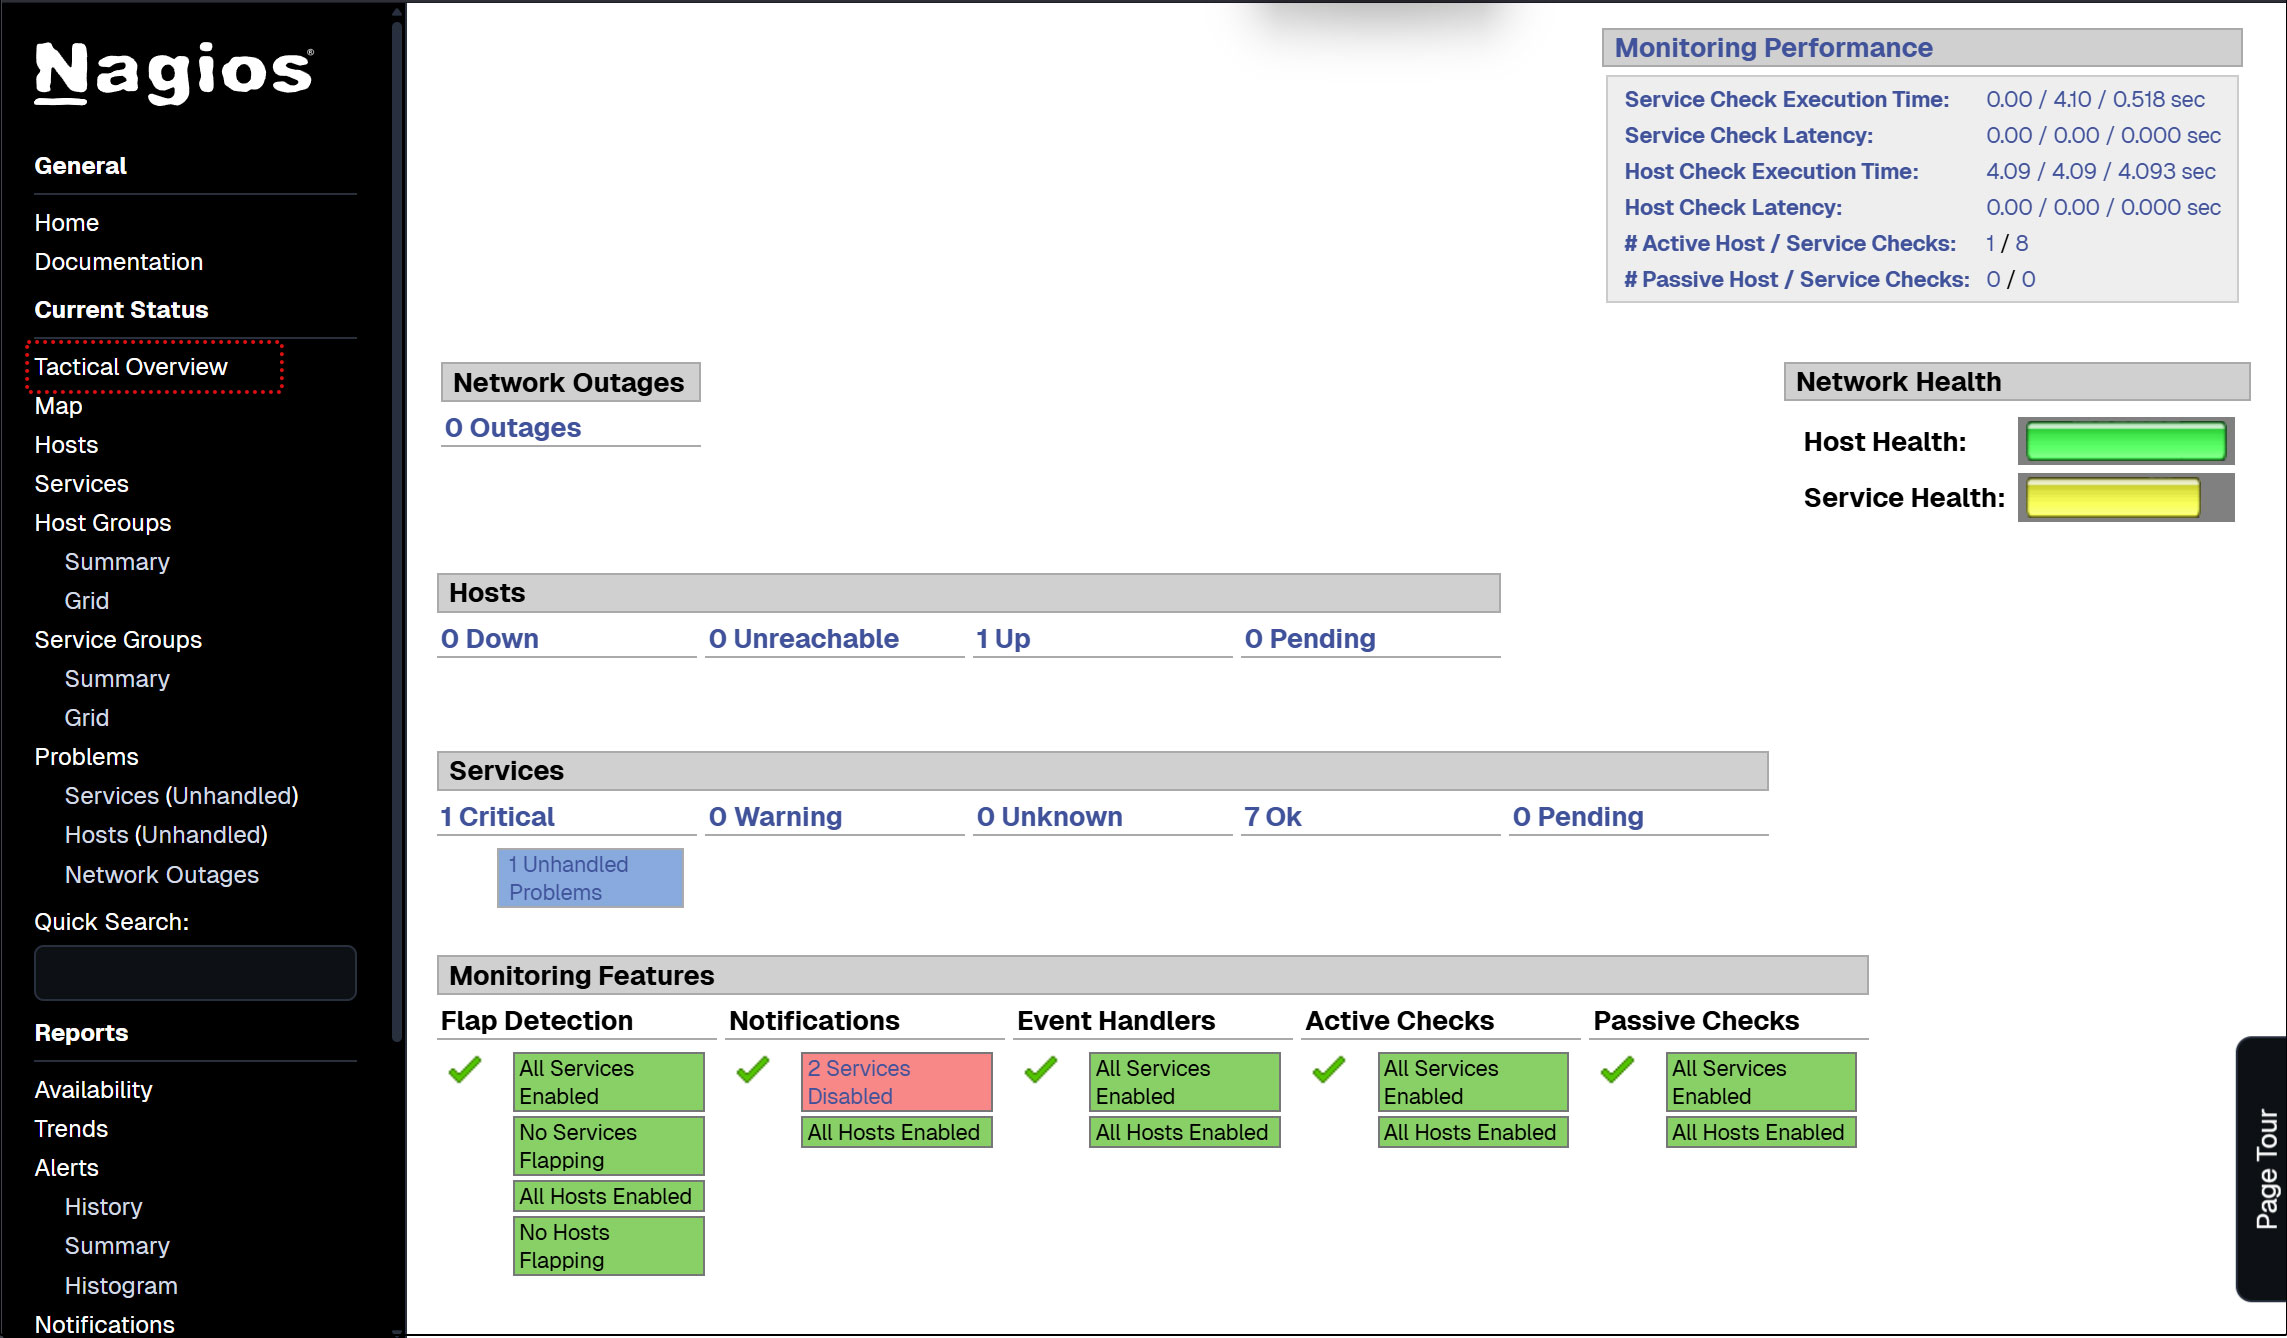
Click [Tactical Overview] in the left menu to view monitoring data.
Click [Current Status] [Services] in the left menu.
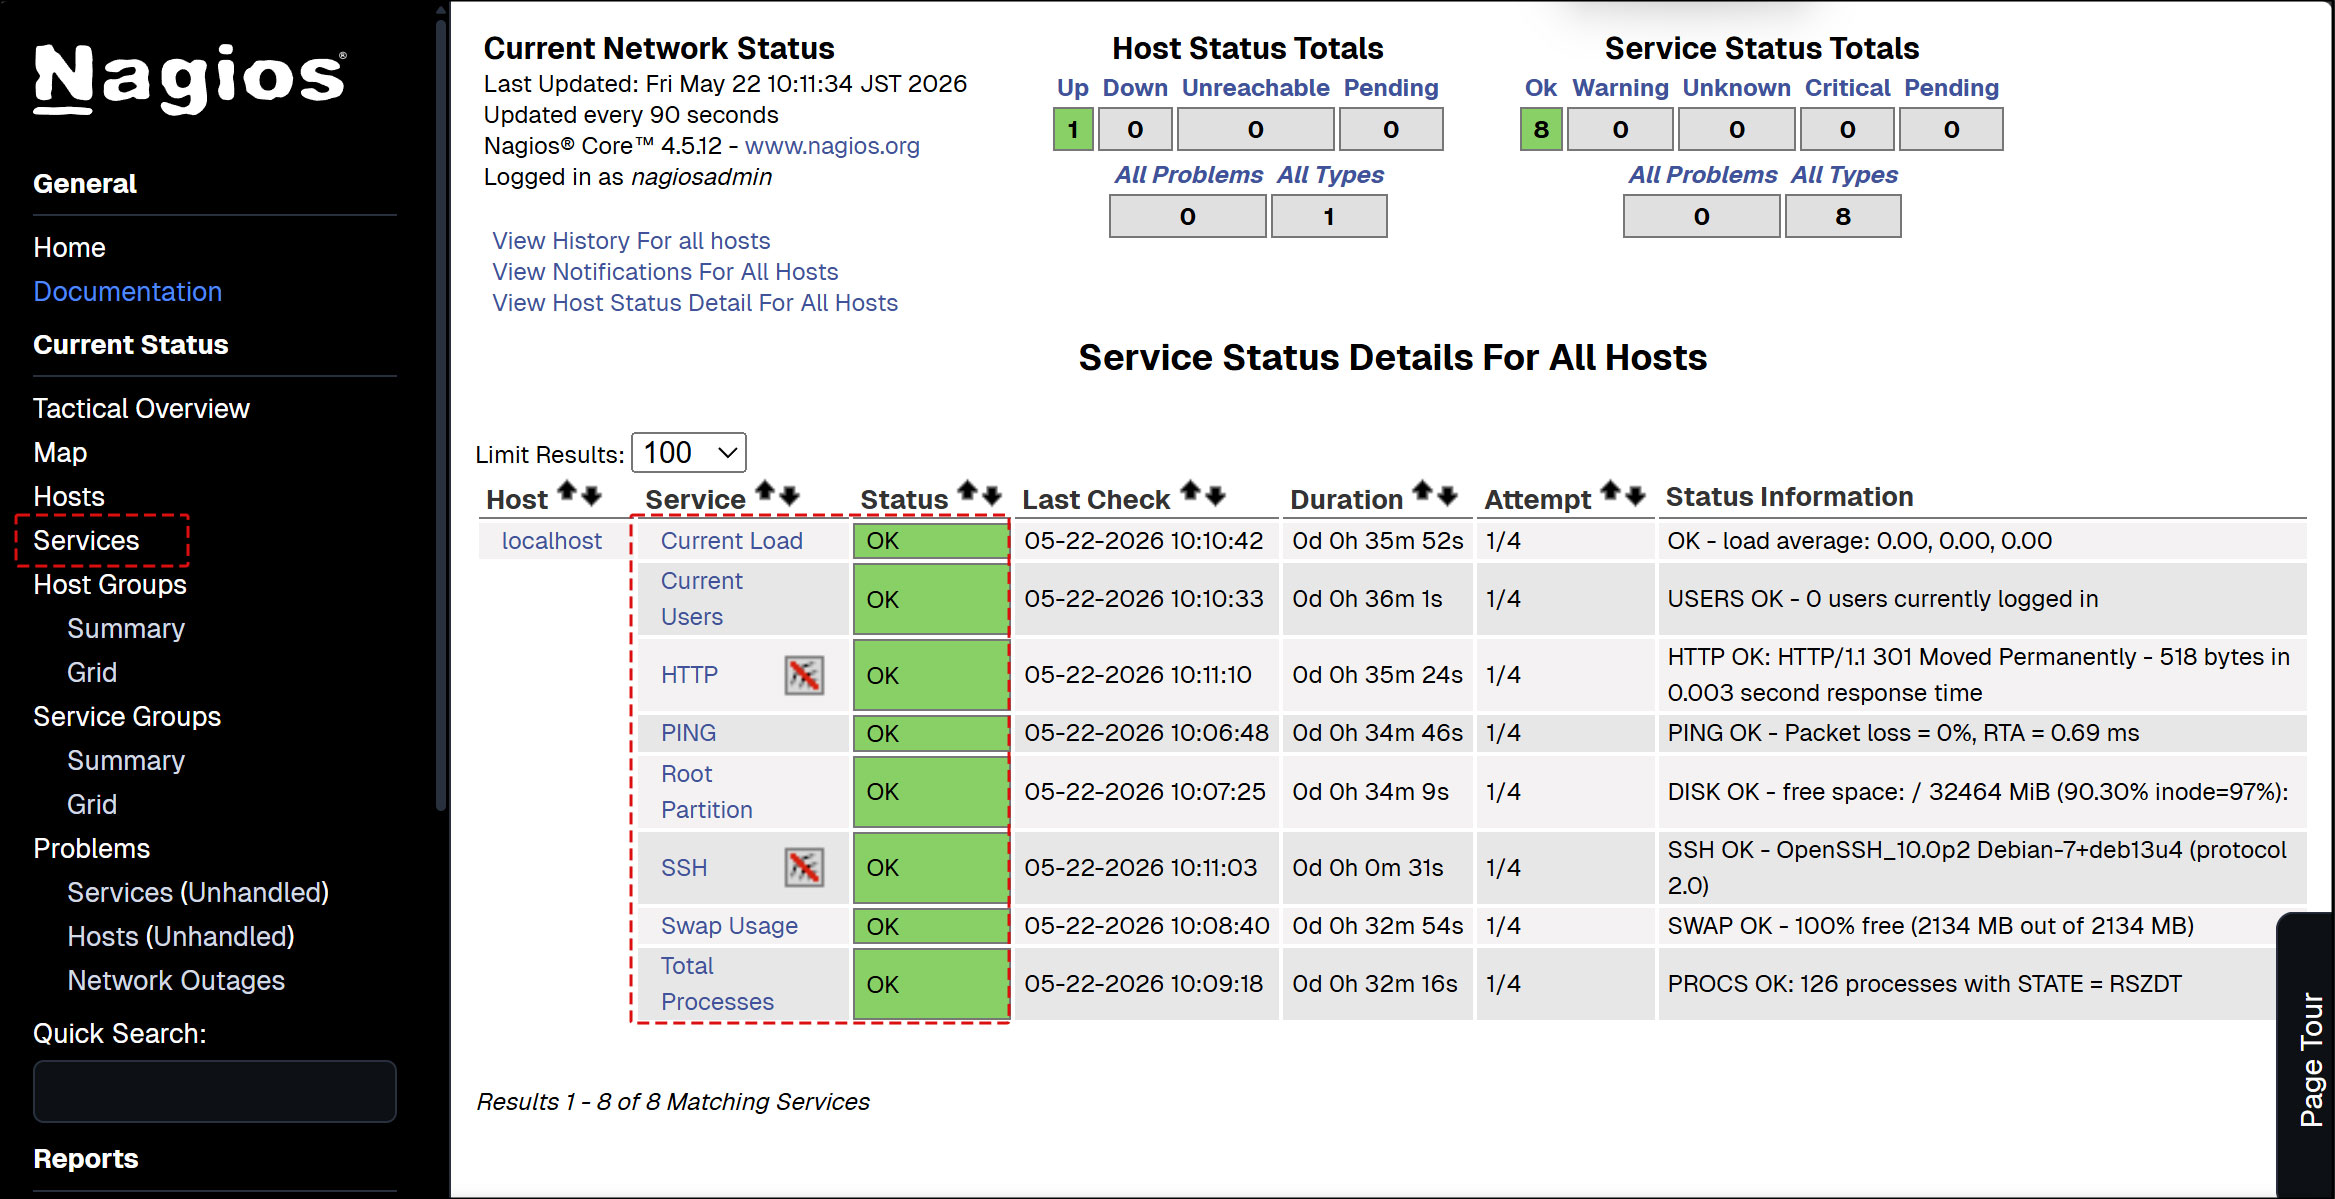
※ If you have assigned port 2244 via custom SSH settings, modify localhost.cfg as follows:
# vi /etc/nagios/objects/localhost.cfg

Around line 143
check_command           check_ssh
↓
check_command           check_ssh!-p 2244
# systemctl restart nagios
4. Configuring the Nagios Agent
What is required to monitor agents
• Nagios plugins for data collection
• NRPE Agent that executes plugins
4.1 Nagios plugins
Nagios plugins are located in the /usr/lib/nagios/plugins directory. To list all plugins available on the system, list this directory.
# ls /usr/lib/nagios/plugins
The following nagios-plugins are available:
check_breeze    check_dns       check_ide_smart     check_mailq     check_ntp_time    check_real       check_ssmtp  negate
check_by_ssh    check_dummy     check_ifoperstatus  check_mrtg      check_nwstat      check_rpc        check_swap   urlize
check_clamd     check_file_age  check_ifstatus      check_mrtgtraf  check_oracle      check_rta_multi  check_tcp    utils.pm
check_cluster   check_flexlm    check_imap          check_nntp      check_overcr      check_sensors    check_time   utils.sh
check_dhcp      check_ftp       check_ircd          check_nntps     check_ping        check_simap      check_udp
check_dig       check_host      check_jabber        check_nt        check_pop         check_smtp       check_ups
check_disk      check_http      check_load          check_ntp       check_procs       check_spop       check_users
check_disk_smb  check_icmp      check_log           check_ntp_peer  check_procs_perf  check_ssh        check_wave
4.2 Installing the Nagios NRPE Agent
# zypper -n install nrpe
Version Check
# nrpe -V
NRPE - Nagios Remote Plugin Executor
Version: 4.1.1
Start the service and enable it
# systemctl start nrpe.service
# systemctl enable --now nrpe.service
Open the NRPE port on the firewall
NRPE uses TCP port 5666 by default. If a firewall is in operation, open this port to allow external checks from the Nagios monitoring server.
# firewall-cmd --add-port=5666/tcp
# firewall-cmd --reload
Verify that port 5666/tcp is listening.
# ss -altnp | grep 5666
LISTEN 0      5            0.0.0.0:5666      0.0.0.0:*    users:(("nrpe",pid=9150,fd=4))
5. Add Monitoring Host
Add the following server as a host and configure it as a target for simple ping-based uptime monitoring.
OS : openSUSE Tumbleweed
IP address : 192.168.11.85
5.1 Editing Configuration Files
# vi /etc/nagios/nagios.cfg

Line 51
cfg_dir=/etc/nagios/servers # Uncomments
5.2 Directory Creation
# mkdir /etc/nagios/servers
# chgrp nagios /etc/nagios/servers
# chmod 750 /etc/nagios/servers
5.3 Create New Definition File
The "korodes" in korodes.cfg can be any name you like.
# vi /etc/nagios/servers/korodes.cfg

define host {
    use                     linux-server
    host_name               korodes
    alias                   korodes
    address                 192.168.11.85
}
define service {
    use                     generic-service
    host_name               korodes
    service_description     PING
    check_command           check_ping!100.0,20%!500.0,60%
}
5.4 Nagios Server Restart
# systemctl restart nagios.service
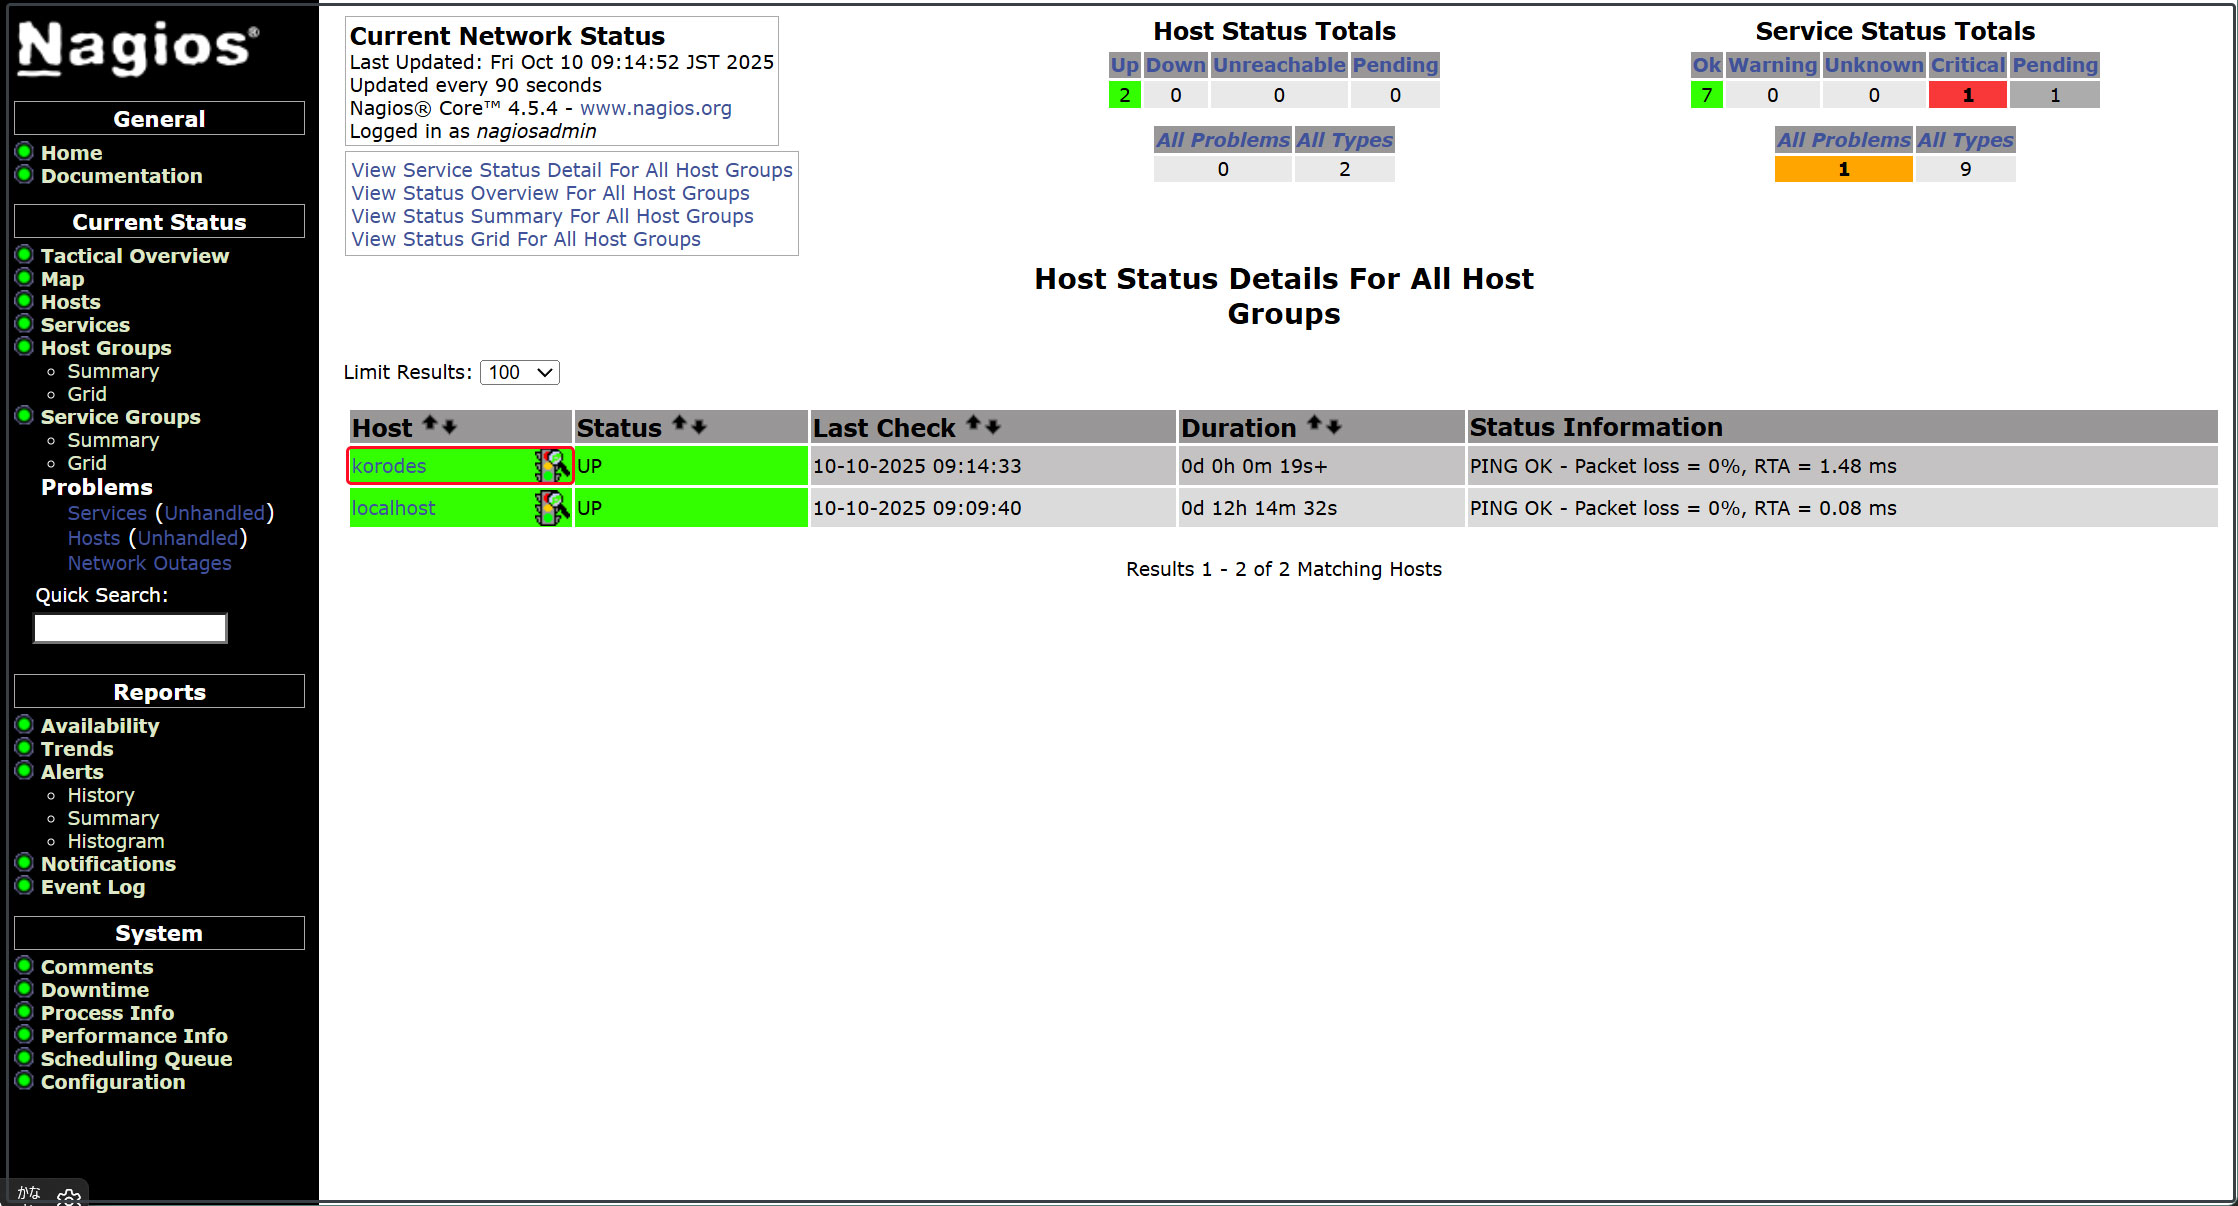
Log in to the Nagios server (http://[server IP address]/nagios) and view Hosts to see that the host has been added.
6.Add Monitoring Service
Add the monitoring service to the host added above.
OS : openSUSE Tumbleweed
IP address : 192.168.11.85
6.1 Settings on the monitored server
6.1.1 Install the agent on the monitored host
# zypper -n install nrpe
6.1.2 Editing Configuration Files
# vi /etc/nrpe.cfg
Line 106 : Add hosts to allow connections (specify Nagios server)
allowed_hosts=127.0.0.1,::1,192.168.11.83
Line 122 : Allow command arguments
dont_blame_nrpe=1
Line 300-304 : Add as a comment
# command[check_users]=/usr/lib/nagios/plugins/check_users -w 5 -c 10
# command[check_load]=/usr/lib/nagios/plugins/check_load -r -w .15,.10,.05 -c .30,.25,.20
# command[check_hda1]=/usr/lib/nagios/plugins/check_disk -w 20% -c 10% -p /dev/hda1
# command[check_zombie_procs]=/usr/lib/nagios/plugins/check_procs -w 5 -c 10 -s Z
# command[check_total_procs]=/usr/lib/nagios/plugins/check_procs -w 150 -c 200
Add the following
command[check_by_ssh]=/usr/lib/nagios/plugins/check_by_ssh $ARG1$
command[check_dhcp]=/usr/lib/nagios/plugins/check_dhcp $ARG1$
command[check_disk]=/usr/lib/nagios/plugins/check_disk $ARG1$
command[check_file_age]=/usr/lib/nagios/plugins/check_file_age $ARG1$
command[check_ftp]=/usr/lib/nagios/plugins/check_ftp $ARG1$
command[check_http]=/usr/lib/nagios/plugins/check_http $ARG1$
command[check_imap]=/usr/lib/nagios/plugins/check_imap $ARG1$
command[check_load]=/usr/lib/nagios/plugins/check_load $ARG1$
command[check_log]=/usr/lib/nagios/plugins/check_log $ARG1$
command[check_mysql]=/usr/lib/nagios/plugins/check_mysql $ARG1$
command[check_ntp]=/usr/lib/nagios/plugins/check_ntp $ARG1$
command[check_ntp_peer]=/usr/lib/nagios/plugins/check_ntp_peer $ARG1$
command[check_ntp_time]=/usr/lib/nagios/plugins/check_ntp_time $ARG1$
command[check_ping]=/usr/lib/nagios/plugins/check_ping $ARG1$
command[check_pop]=/usr/lib/nagios/plugins/check_pop $ARG1$
command[check_spop]=/usr/lib/nagios/plugins/check_spop $ARG1$
command[check_procs]=/usr/lib/nagios/plugins/check_procs $ARG1$
command[check_smtp]=/usr/lib/nagios/plugins/check_smtp $ARG1$
command[check_ssmtp]=/usr/lib/nagios/plugins/check_ssmtp $ARG1$
command[check_ssh]=/usr/lib/nagios/plugins/check_ssh $ARG1$
command[check_swap]=/usr/lib/nagios/plugins/check_swap $ARG1$
command[check_tcp]=/usr/lib/nagios/plugins/check_tcp $ARG1$
command[check_udp]=/usr/lib/nagios/plugins/check_udp $ARG1$
command[check_ups]=/usr/lib/nagios/plugins/check_ups $ARG1$
command[check_users]=/usr/lib/nagios/plugins/check_users $ARG1$
6.1.3 Enable and start the NRPE server
# systemctl enable --now nrpe
# systemctl start nrpe
6.1.4 Open NRPE ports 5666/tcp and 5666/udp on the firewall.
# firewall-cmd  --add-port=5666/tcp --permanent
# firewall-cmd --reload
6.2 Nagios Server-Side Configuration
6.2.1 Installing the NRPE Plugin
# zypper install nagios-plugins-nrpe
6.2.2 Check the Nagios plugin directory
# ls /usr/lib/nagios/plugins
check_breeze check_dns check_ide_smart check_mailq check_ntp_peer check_procs_perf check_ssh check_wave
check_by_ssh check_dummy check_ifoperstatus check_mrtg check_ntp_time check_real check_ssmtp negate
check_clamd check_file_age check_ifstatus check_mrtgtraf check_nwstat check_rpc check_swap nrpe_check_control
check_cluster check_flexlm check_imap check_nntp check_oracle check_rta_multi check_tcp urlize
check_dhcp check_ftp check_ircd check_nntps check_overcr check_sensors check_time utils.pm
check_dig check_host check_jabber check_nrpe check_ping check_simap check_udp utils.sh
check_disk check_http check_load check_nt check_pop check_smtp check_ups
check_disk_smb check_icmp check_log check_ntp check_procs check_spop check_users
6.2.3 Editing commands.cfg
# vi /etc/nagios/objects/commands.cfg

# Add to the last line
define command {
    command_name    check_nrpe
    command_line    $USER1$/check_nrpe -H $HOSTADDRESS$ -c $ARG1$
}
6.2.4 Edit and add to the korodes.cfg file created when adding the host earlier.
This time, let's add HTTP, SSH, and FTP.
# vi /etc/nagios/servers/korodes.cfg

# Add the following:

# 'HTTP' command definition
define service{
        use                              local-service
        host_name                        korodes
        service_description              HTTP
        check_command                    check_http
        }

# 'SSH' command definition
define service{
        use                              local-service
        host_name                        korodes
        service_description              SSH
        check_command                    check_ssh
       }
# 'FTP' command definition
define service{
        use                              local-service
        host_name                        korodes
        service_description              FTP
        check_command                    check_ftp
        }
6.2.5 Nagios Restart
# systemctl restart nagios.service
6.2.6 Access http://[Nagios Server IP Address]/nagios
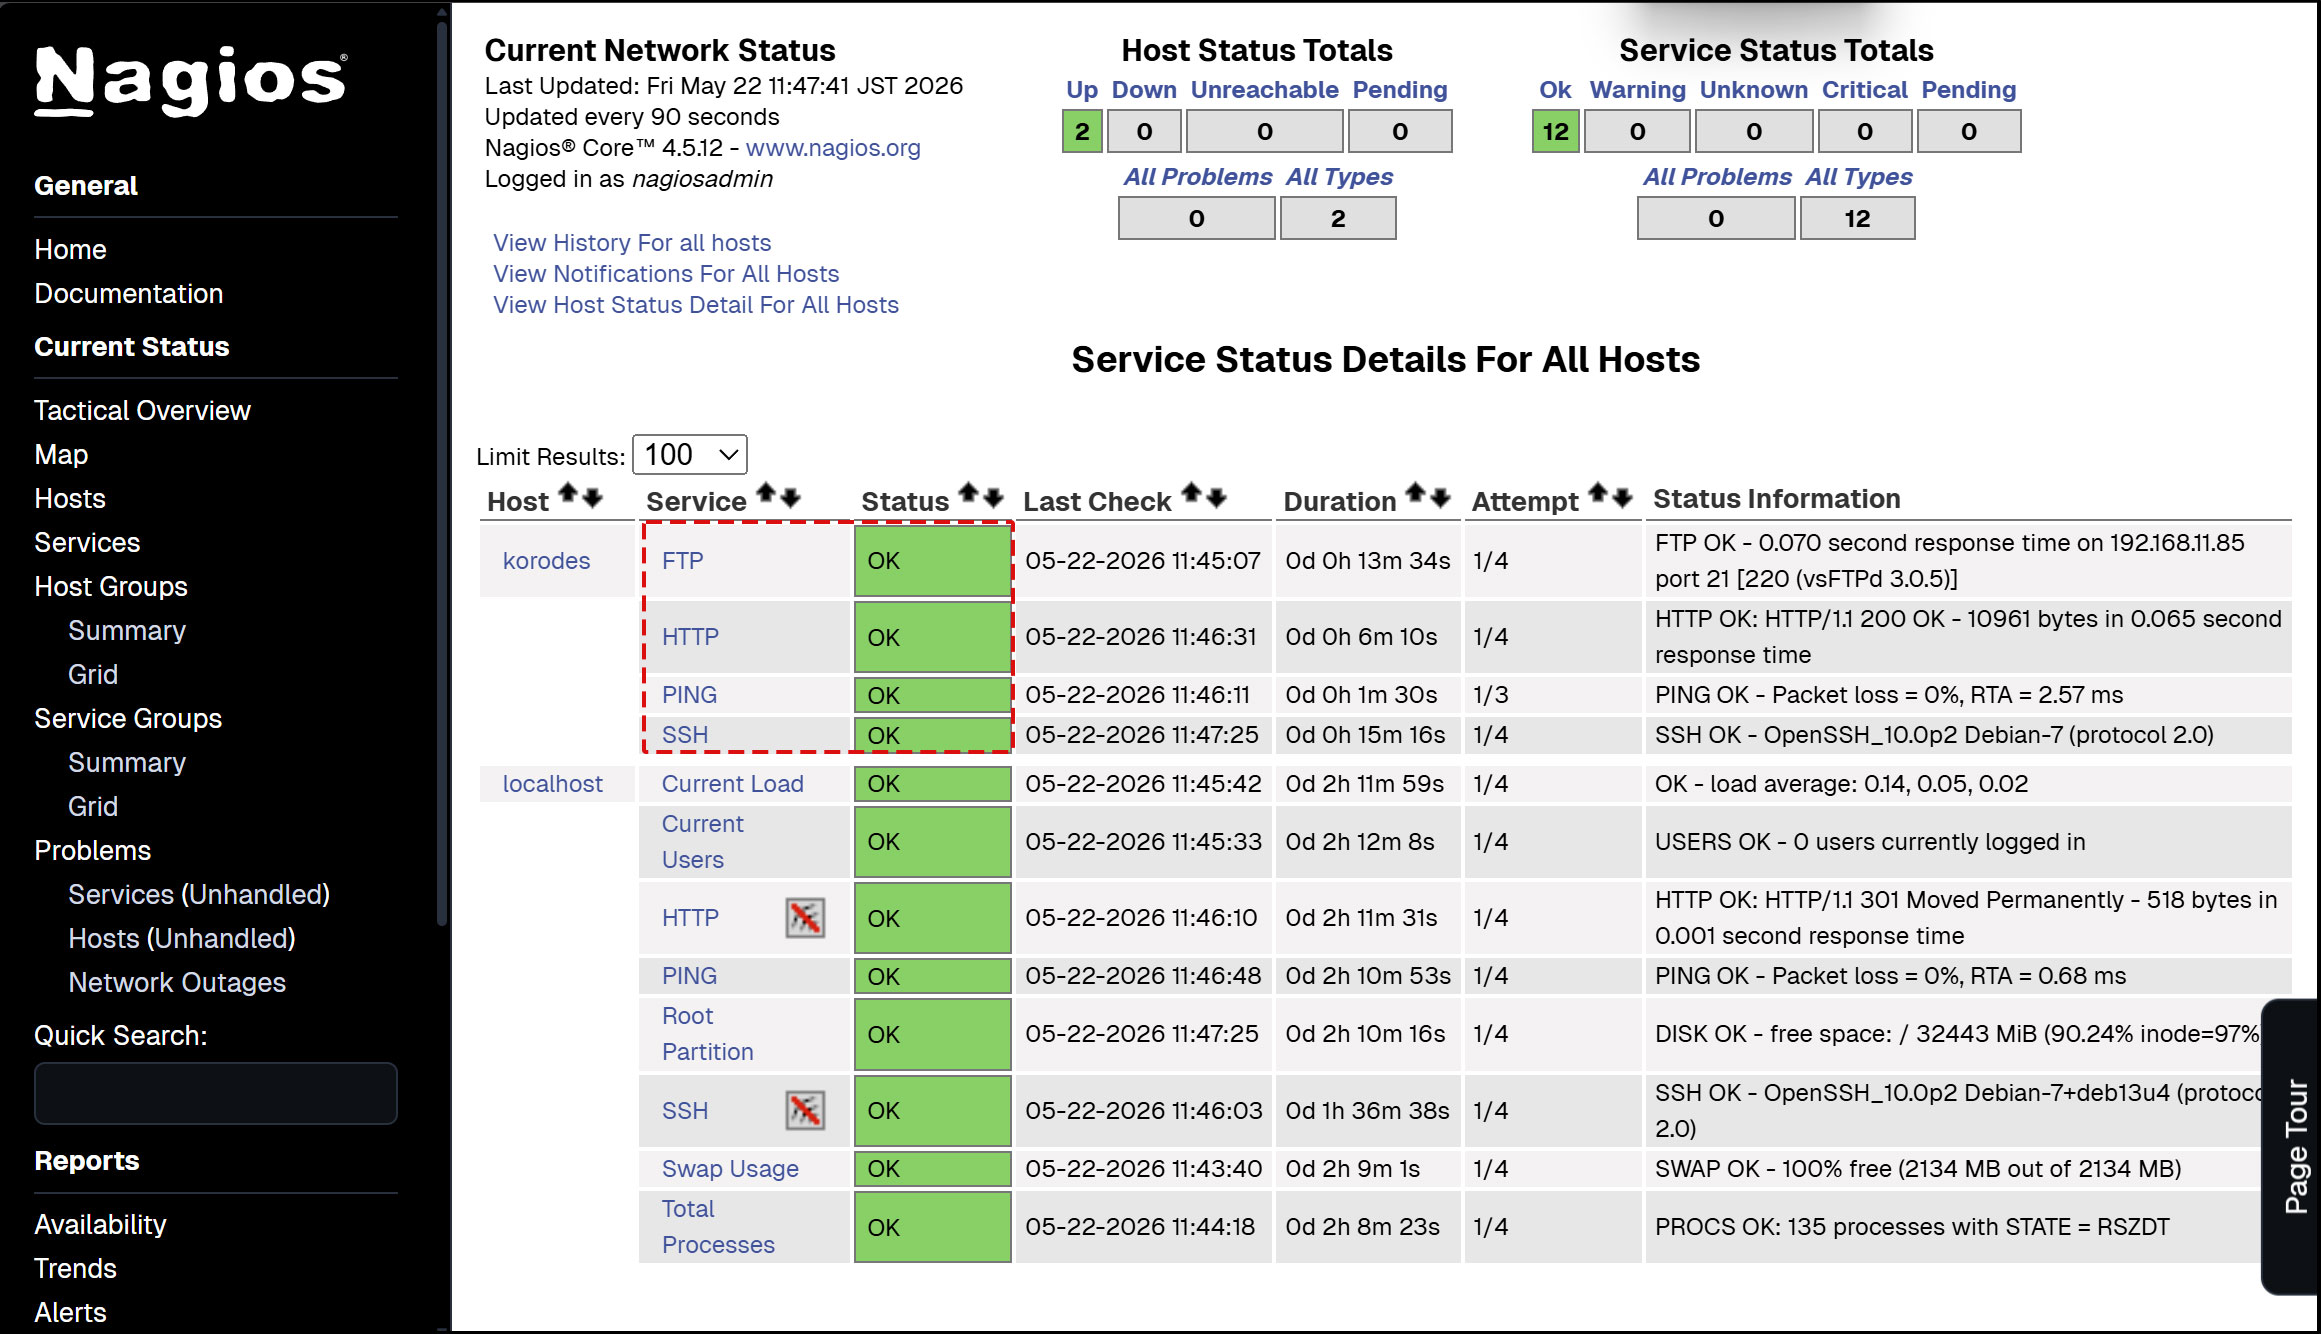
The newly added monitoring service has been added as shown in the figure below.