オープンソースの統合監視ソフトウェア「Nagios Server」
Nagiosは、Linux 上で実行するオープンソースの監視ソリューションです。
Nagiosは、 Ethan Galstadによって開発され、 1999 年に最初にリリースされました。その後、このプロジェクトは、いくつかの貢献者によってオープンソース プロジェクトとして改良されました。
Nagiosは、ネットワーク、アプリケーション、またはサーバーの重要なパラメーターを定期的にチェックするように設計されています。これらのパラメータには、マイクロプロセッサの負荷、実行中のプロセス数、ログ ファイル、ディスクおよびメモリの使用量の他、SMTP (Simple Mail Transfer Protocol)、HTTP (Hypertext Transfer Protocol)、POP3 ( Post Office Protocol 3)の他の多くのサービスもチェックできます。
Nagoisを実行するにはPHP、MySQLなどのデータベース、ApacheやNginxなどのWebサーバーが必要です。今回はこれらすべてが構成済みという前提で進めます。
1.Nagios インストール
# zypper -n install nagios
2. Nagios Web ユーザーの作成
Nagios Web ダッシュボードにアクセスするためのユーザー アカウントを作成する。このユーザーアカウントは、認証に使用される。
ユーザーのデフォルト名はnagiosadminで、/etc/nagios/cgi.cfgファイル内に優先ユーザー名として定義されています。
# htpasswd -c /etc/nagios/htpasswd.users nagiosadmin
New password:  [password]
Re-type new password:  [again password]
Adding password for user nagiosadmin
所有権と権限を設定
# chown wwwrun:wwwrun /etc/nagios/htpasswd.users
# chmod 640 /etc/nagios/htpasswd.users
Apache を再起動
# systemctl restart apache2
必要なディレクトリーを作成し所有権を設定する
# mkdir /var/lib/nagios/rw/
# chown -R nagios:nagios /var/lib/nagios/rw/
nagios sysytemdサービスの編集
[Service]にType=singleを追加する
# vi /usr/lib/systemd/system/nagios.service

 [Unit]
Description=Network Monitor Nagios
After=syslog.target network.target

[Service]
# for details of the additional system hardening configuration please see
# https://en.opensuse.org/openSUSE:Security_Features#Systemd_hardening_effort
ProtectSystem=full
ProtectHome=true
ProtectHostname=true
ProtectKernelTunables=true
ProtectKernelModules=true
ProtectControlGroups=true
RestrictRealtime=true
# end of system hardening
ExecStartPre=/usr/sbin/nagios -v /etc/nagios/nagios.cfg
ExecStart=/usr/sbin/nagios /etc/nagios/nagios.cfg
ExecStopPost=/usr/bin/rm -f /var/spool/nagios/nagios.cmd
ExecReload=/usr/sbin/nagios -v /etc/nagios/nagios.cfg
ExecReload=kill -HUP $MAINPID
Type=single

[Install]
WantedBy=multi-user.target
Alias=monitoring_daemon.service
Nagios サービスを開始と有効
# systemctl daemon-reload
# systemctl start nagios
# systemctl enable nagios --now
Created symlink '/etc/systemd/system/monitoring_daemon.service' → '/usr/lib/systemd/system/nagios.service'.
Created symlink '/etc/systemd/system/multi-user.target.wants/nagios.service' → '/usr/lib/systemd/system/nagios.service'.
システムを再起動
# shutdown -r now
サービスが実行しているか確認
# systemctl status nagios

● nagios.service - Network Monitor Nagios
     Loaded: loaded (/usr/lib/systemd/system/nagios.service; enabled; preset: disabled)
     Active: active (running) since Wed 2026-06-24 13:47:06 JST; 48s ago
 Invocation: b3b8bc58106545b1b7e22b2a75dd3424
    Process: 930 ExecStartPre=/usr/sbin/nagios -v /etc/nagios/nagios.cfg (code=exited, status=0/SUCCESS)
   Main PID: 943 (nagios)
      Tasks: 8 (limit: 4541)
        CPU: 114ms
     CGroup: /system.slice/nagios.service
             tq943 /usr/sbin/nagios /etc/nagios/nagios.cfg
             tq944 /usr/sbin/nagios --worker /var/lib/nagios/nagios.qh
             tq945 /usr/sbin/nagios --worker /var/lib/nagios/nagios.qh
             tq946 /usr/sbin/nagios --worker /var/lib/nagios/nagios.qh
             tq947 /usr/sbin/nagios --worker /var/lib/nagios/nagios.qh
             tq948 /usr/sbin/nagios --worker /var/lib/nagios/nagios.qh
             tq949 /usr/sbin/nagios --worker /var/lib/nagios/nagios.qh
             mq950 /usr/sbin/nagios /etc/nagios/nagios.cfg

Jun 24 13:47:06 Lepard nagios[943]: wproc: Registry request: name=Core Worker 946;pid=946
Jun 24 13:47:06 Lepard nagios[943]: wproc: Registry request: name=Core Worker 948;pid=948
Jun 24 13:47:06 Lepard nagios[943]: wproc: Registry request: name=Core Worker 947;pid=947
Jun 24 13:47:06 Lepard nagios[943]: wproc: Registry request: name=Core Worker 946;pid=946
Jun 24 13:47:06 Lepard nagios[943]: wproc: Registry request: name=Core Worker 944;pid=944
3. Nagios Web インターフェイスにアクセス
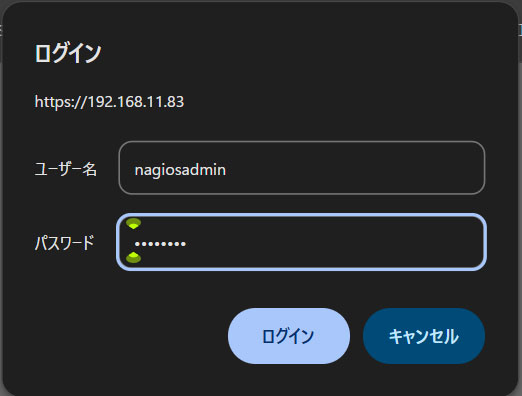
任意のブラウザで http://[IP_Address]/nagios/にアクセスし[Username]にnagiosadmin、[Password]には上記でユーザーを作成したとき指定したパスワードを入力し、[Sign in]
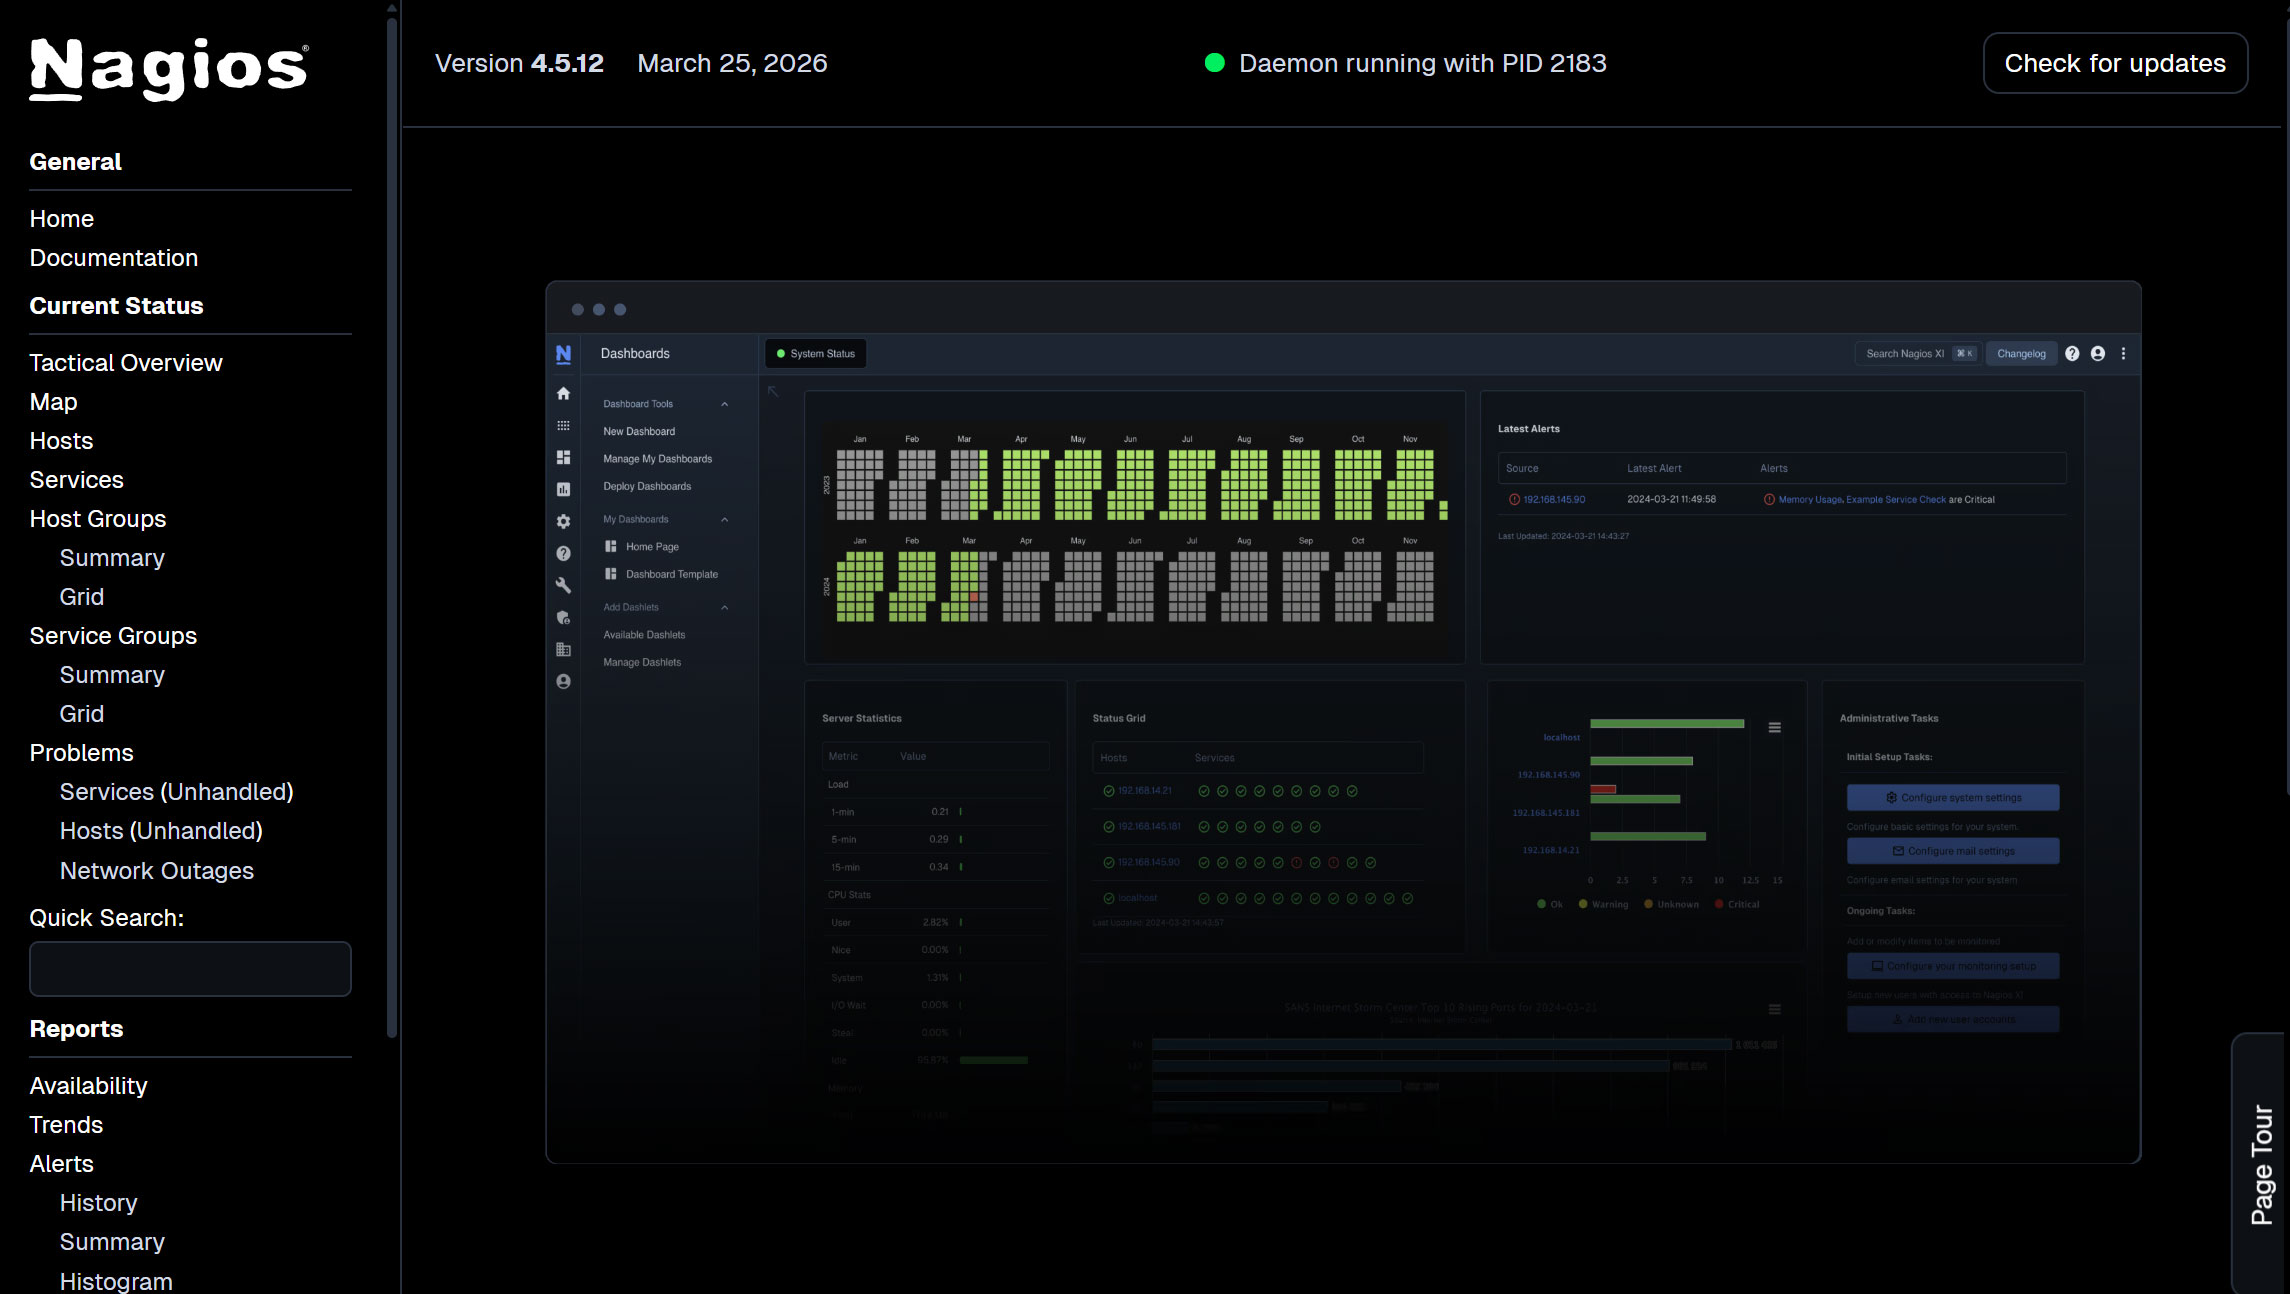
ログインに成功すると、以下のようなダッシュボードが表示されます。
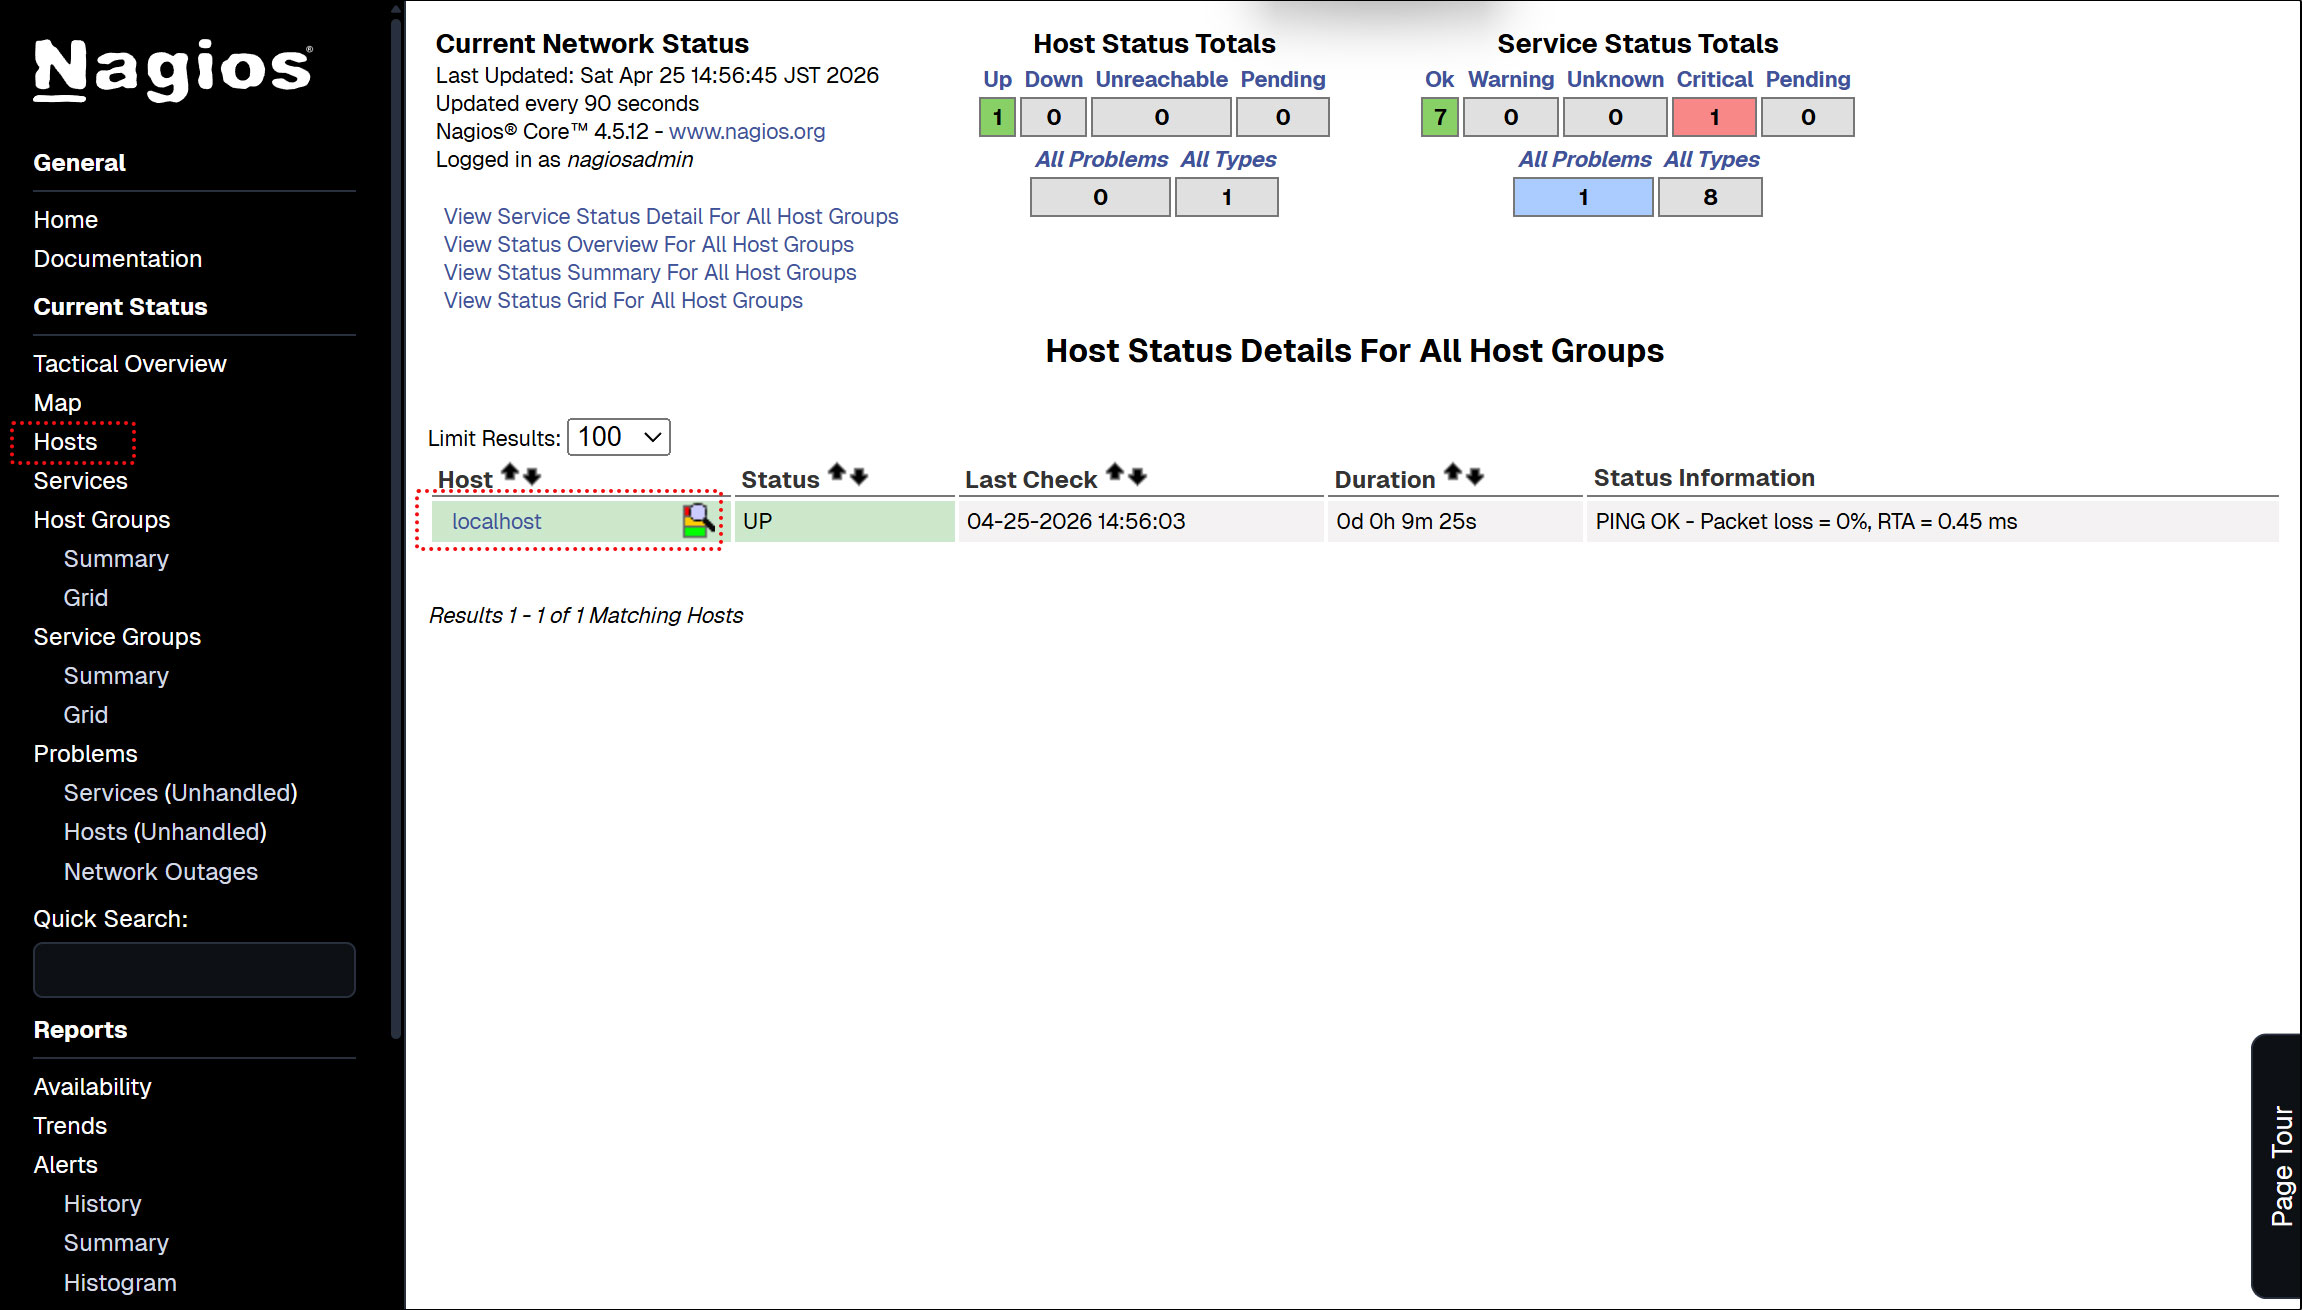
ホストの可用性を表示
左メニューの[Hosts]をクリック--現状ではNagios Serverのみ表示されている
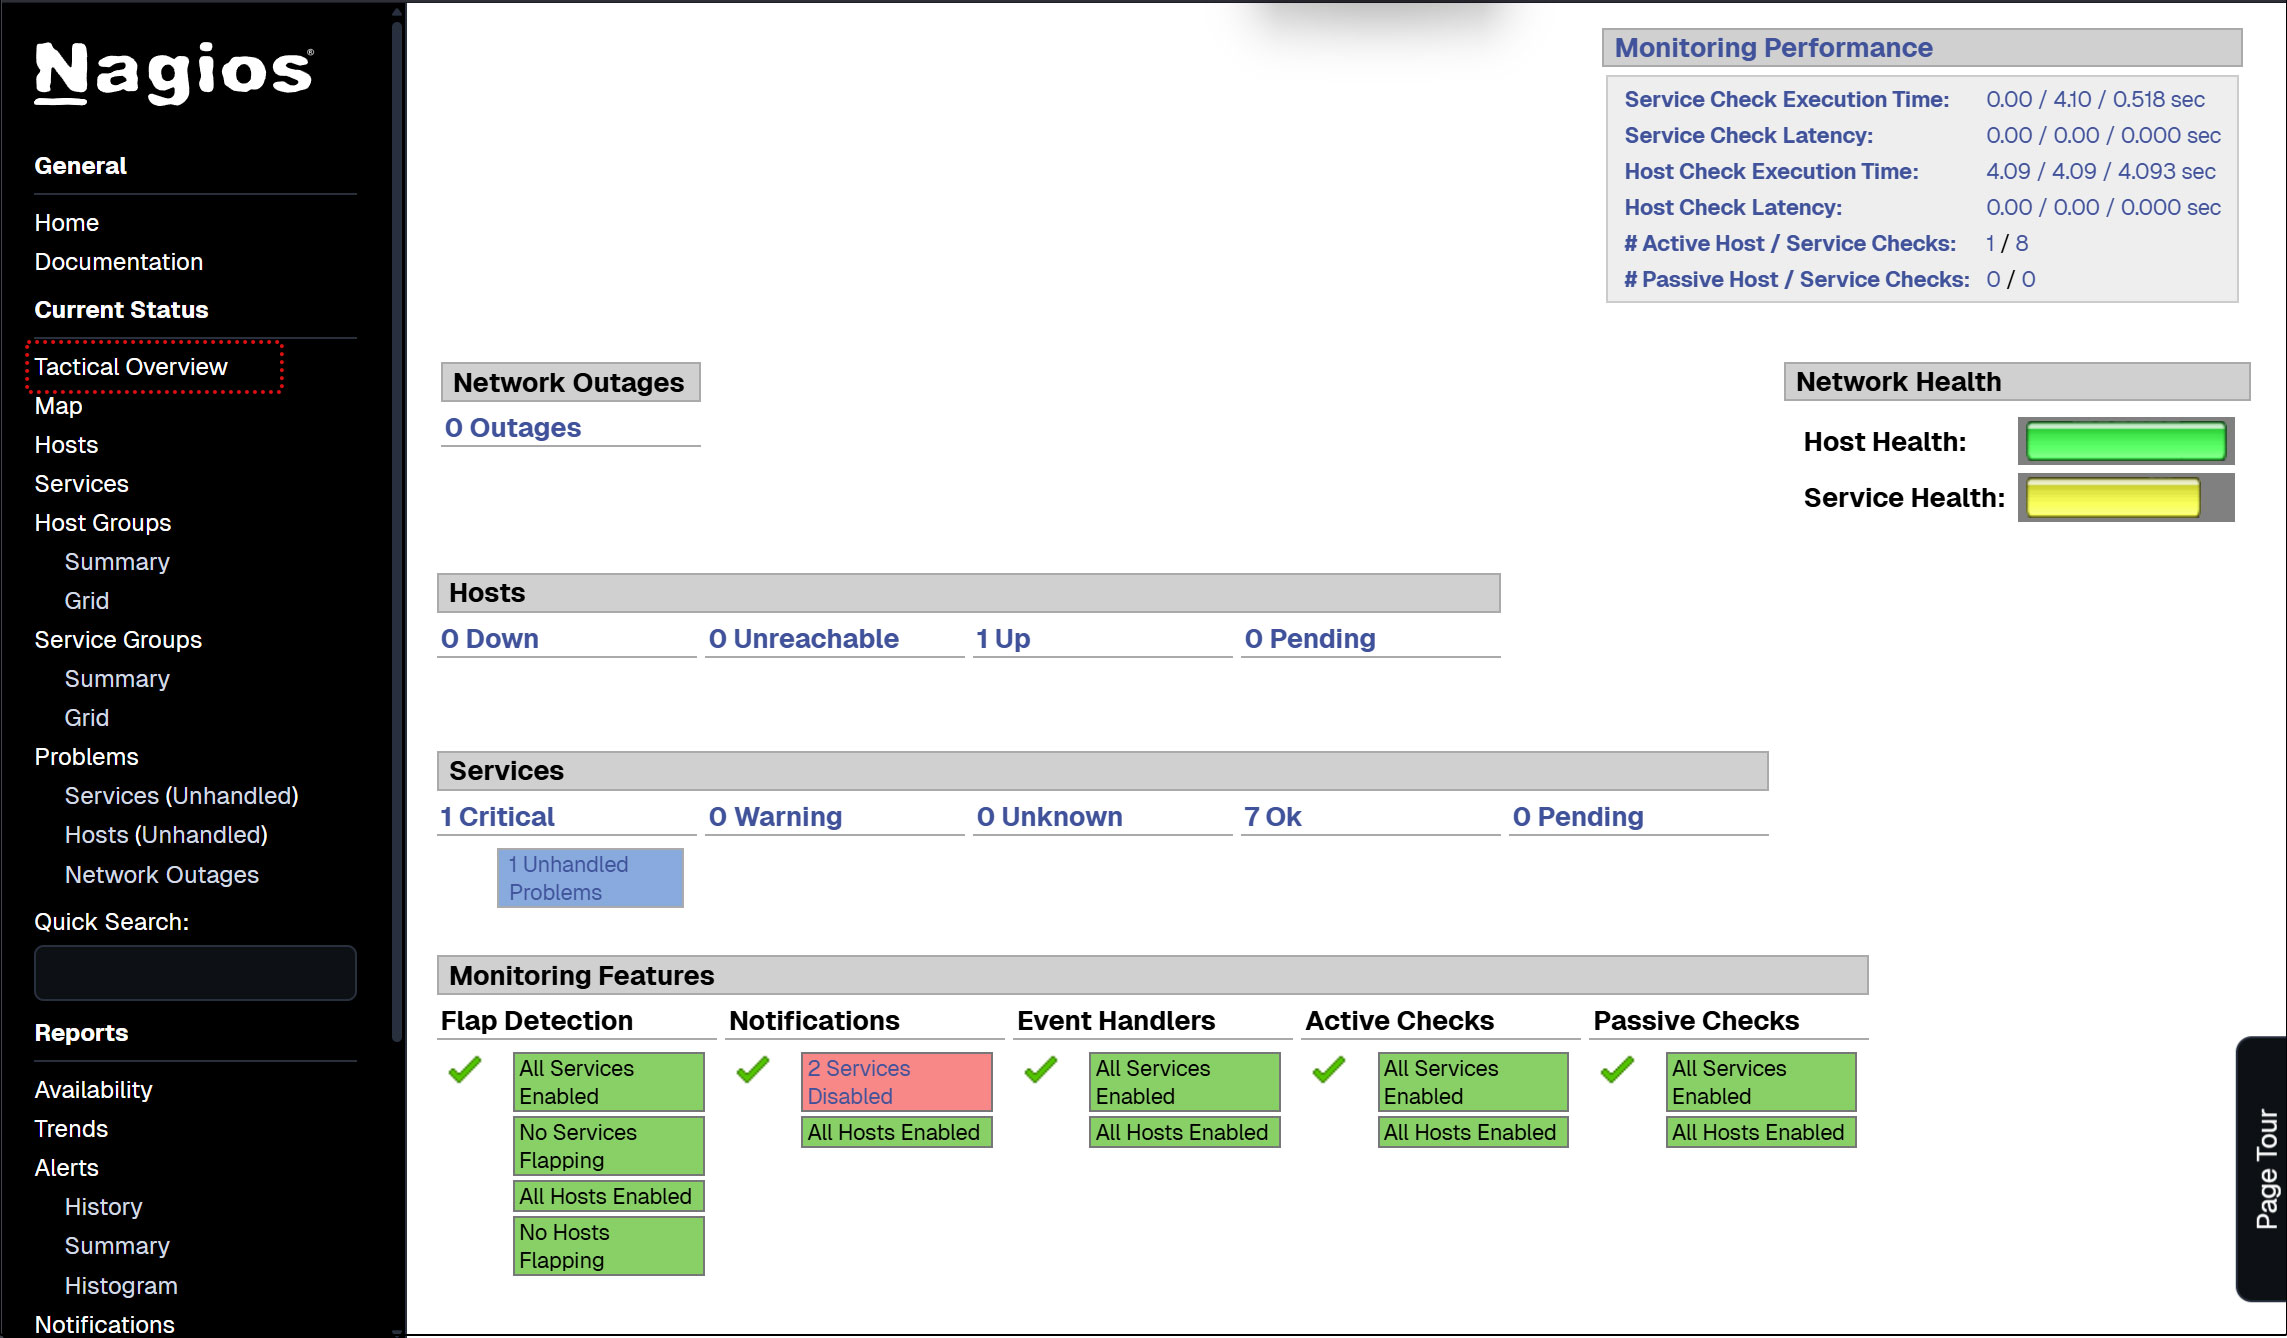
左メニューの [Tactical Overview] をクリックすると監視データを閲覧できる
左メニューの [Current Status] [Services] をクリック
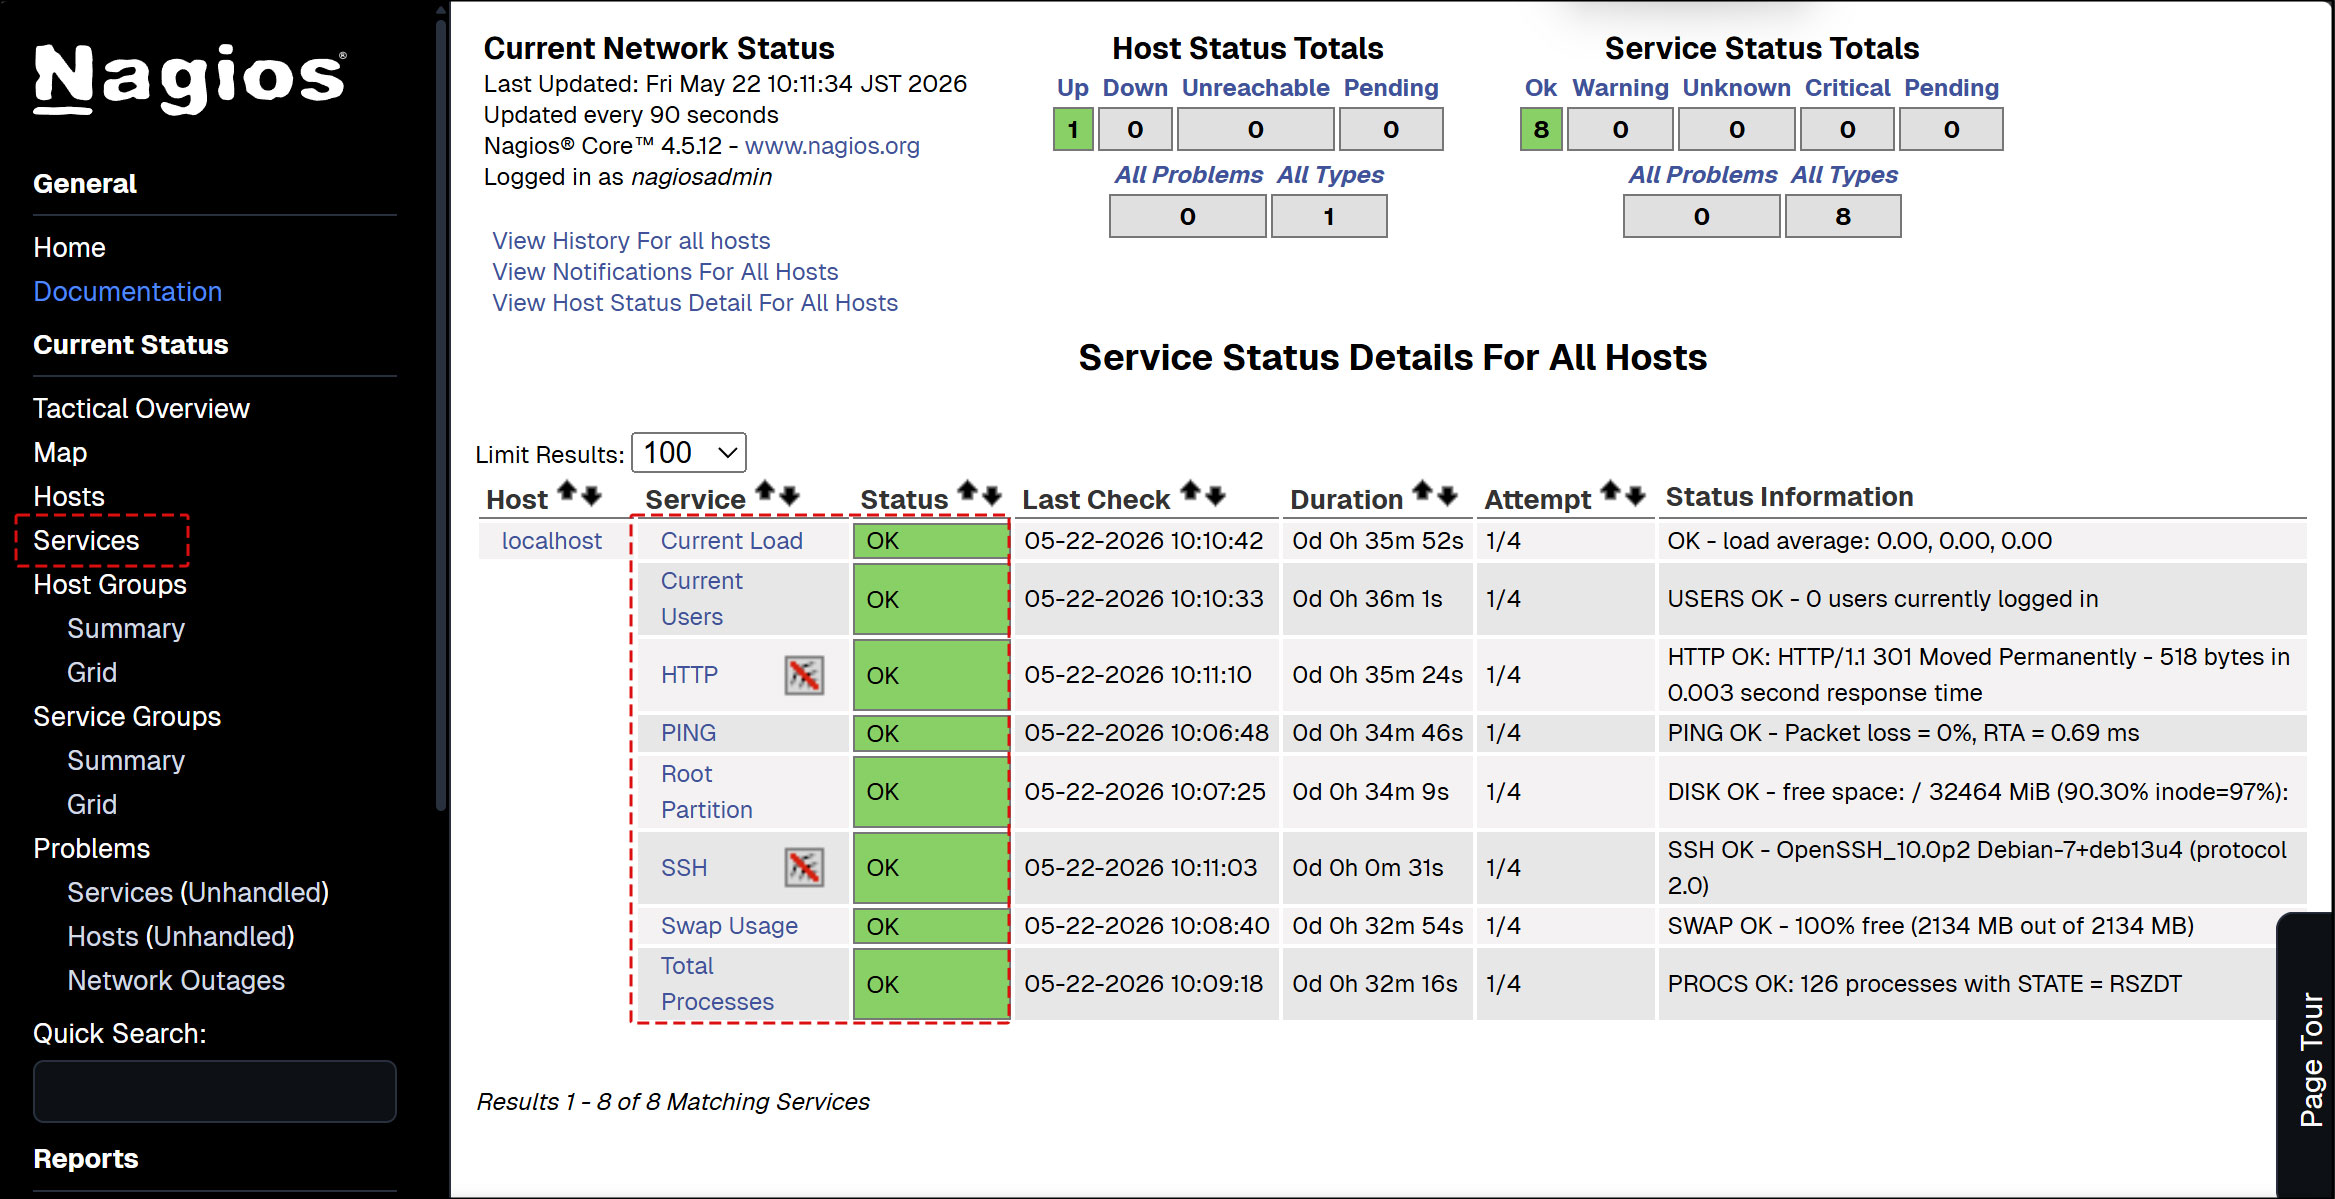
※ SSHポートをカスタム設定で2244を割り当てている場合は下記の通りlocalhost.cfgを変更しておきます
# vi /etc/nagios/objects/localhost.cfg

143行目当たり
check_command           check_ssh
↓
check_command           check_ssh!-p 2244
# systemctl restart nagios
4. Nagios エージェントの構成
エージェントを監視するために必要なもの
• データ収集用のNagios plugins
• プラグインを実行するNRPE Agent
4.1 Nagios plugins
Nagios プラグインは、/usr/lib/nagios/plugins ディレクトリにあります。システム内で使用可能なすべてのプラグインを表示するには、このディレクトリをリストします。
# ls /usr/lib/nagios/plugins
下記のとおりnagios-pluginsが利用可能である
check_breeze    check_dns       check_ide_smart     check_mailq     check_ntp_time    check_real       check_ssmtp  negate
check_by_ssh    check_dummy     check_ifoperstatus  check_mrtg      check_nwstat      check_rpc        check_swap   urlize
check_clamd     check_file_age  check_ifstatus      check_mrtgtraf  check_oracle      check_rta_multi  check_tcp    utils.pm
check_cluster   check_flexlm    check_imap          check_nntp      check_overcr      check_sensors    check_time   utils.sh
check_dhcp      check_ftp       check_ircd          check_nntps     check_ping        check_simap      check_udp
check_dig       check_host      check_jabber        check_nt        check_pop         check_smtp       check_ups
check_disk      check_http      check_load          check_ntp       check_procs       check_spop       check_users
check_disk_smb  check_icmp      check_log           check_ntp_peer  check_procs_perf  check_ssh        check_wave
4.2 Nagios NRPE Agentのインストール
# zypper -n install nrpe
バージョン確認
# nrpe -V
NRPE - Nagios Remote Plugin Executor
Version: 4.1.1
サービスを開始して有効にする
# systemctl start nrpe.service
# systemctl enable --now nrpe.service
ファイアウォールでNRPEのポートを開く
NRPEはデフォルトでTCP 5666ポートを使用します。ファイアウォールが動作している場合は、Nagiosモニタリングサーバーからの外部チェックを許可するために、このポートを開きます。
# firewall-cmd --add-port=5666/tcp
# firewall-cmd --reload
ポート5666/tcpがリッスンされているか確認
# ss -altnp | grep 5666
LISTEN 0      5            0.0.0.0:5666      0.0.0.0:*    users:(("nrpe",pid=9150,fd=4))
5. 監視ホストの追加
下記サーバーをホストに追加し、 単純なPing による死活監視対象として設定
OS : openSUSE Tumbleweed
IPアドレス : 192.168.11.85
5.1 設定ファイル編集
# vi /etc/nagios/nagios.cfg

51行目
cfg_dir=/etc/nagios/servers コメント解除
5.2 ディレクトリー作成
# mkdir /etc/nagios/servers
# chgrp nagios /etc/nagios/servers
# chmod 750 /etc/nagios/servers
5.3 定義ファイル新規作成
korodes.cfgのkorodesは任意の名称でよい
# vi /etc/nagios/servers/korodes.cfg

define host {
    use                     linux-server
    host_name               korodes
    alias                   korodes
    address                 192.168.11.85
}
define service {
    use                     generic-service
    host_name               korodes
    service_description     PING
    check_command           check_ping!100.0,20%!500.0,60%
}
5.4 Nagiosサーバー再起動
# systemctl restart nagios.service
Nagios サーバーにログイン(http://[サーバーIPアドレス]/nagios)しHostsを見るとホストが追加されている
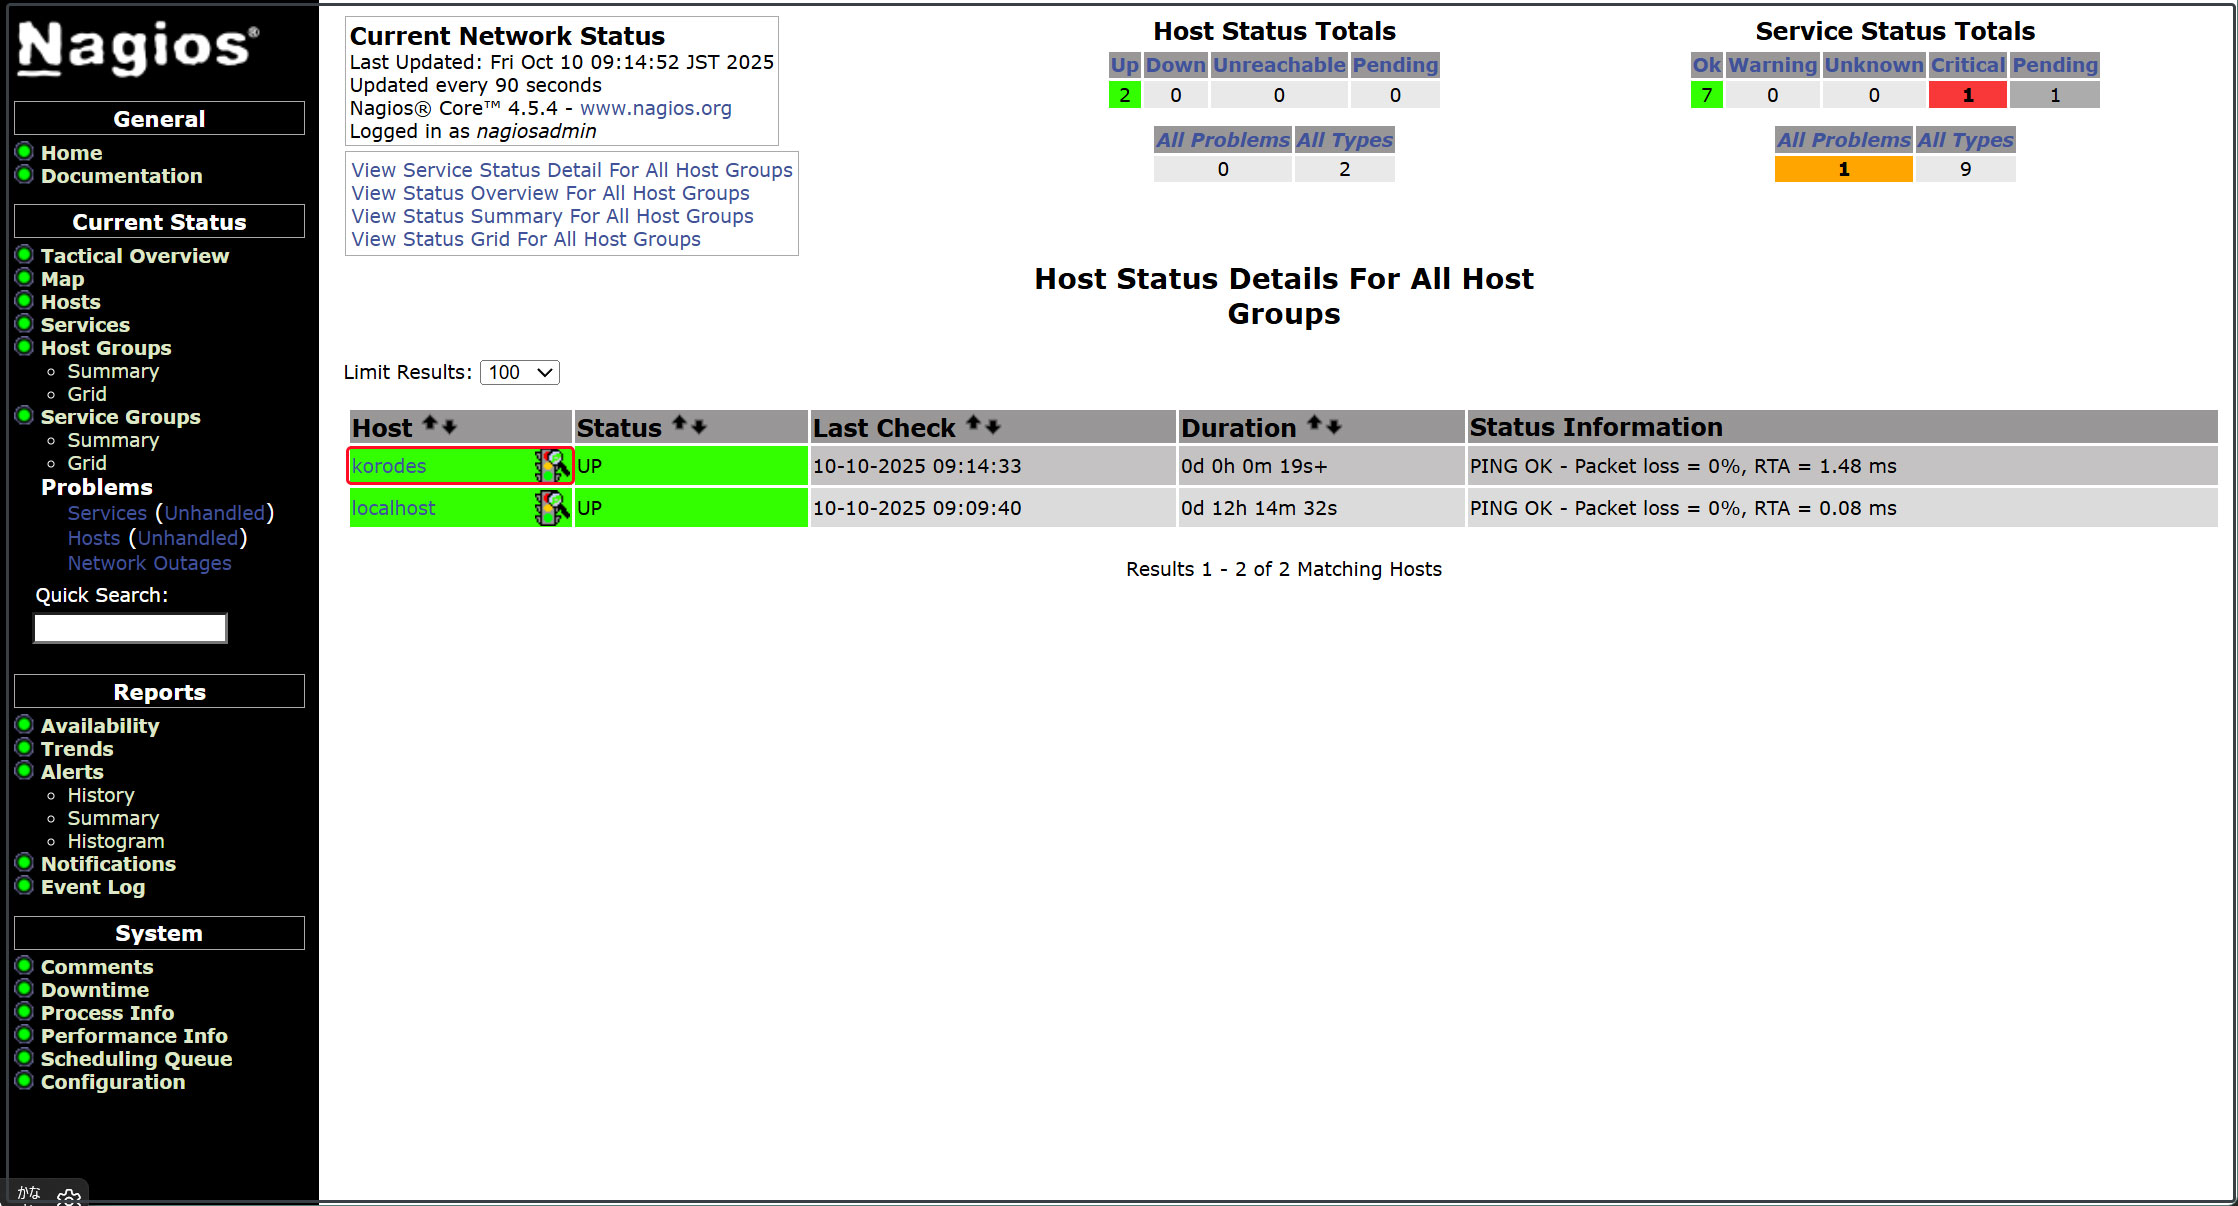
6. 監視サービスの追加
上記で追加したホストに監視サービスを追加する
OS : openSUSE Tumbleweed
IPアドレス : 192.168.11.85
6.1 監視対象サーバー側の設定
6.1.1 監視対象ホストにエージェントをインストール
# zypper -n install nrpe
6.1.2 設定ファイル編集
# vi /etc/nrpe.cfg
106行目 : 接続を許可するホストを追記 (Nagios サーバーを指定)
allowed_hosts=127.0.0.1,::1,192.168.11.83
122行目 : コマンドの引数を許可
dont_blame_nrpe=1
300-304行目コメントにし、追加
# command[check_users]=/usr/lib/nagios/plugins/check_users -w 5 -c 10
# command[check_load]=/usr/lib/nagios/plugins/check_load -r -w .15,.10,.05 -c .30,.25,.20
# command[check_hda1]=/usr/lib/nagios/plugins/check_disk -w 20% -c 10% -p /dev/hda1
# command[check_zombie_procs]=/usr/lib/nagios/plugins/check_procs -w 5 -c 10 -s Z
# command[check_total_procs]=/usr/lib/nagios/plugins/check_procs -w 150 -c 200
下記を追加する
command[check_by_ssh]=/usr/lib/nagios/plugins/check_by_ssh $ARG1$
command[check_dhcp]=/usr/lib/nagios/plugins/check_dhcp $ARG1$
command[check_disk]=/usr/lib/nagios/plugins/check_disk $ARG1$
command[check_file_age]=/usr/lib/nagios/plugins/check_file_age $ARG1$
command[check_ftp]=/usr/lib/nagios/plugins/check_ftp $ARG1$
command[check_http]=/usr/lib/nagios/plugins/check_http $ARG1$
command[check_imap]=/usr/lib/nagios/plugins/check_imap $ARG1$
command[check_load]=/usr/lib/nagios/plugins/check_load $ARG1$
command[check_log]=/usr/lib/nagios/plugins/check_log $ARG1$
command[check_mysql]=/usr/lib/nagios/plugins/check_mysql $ARG1$
command[check_ntp]=/usr/lib/nagios/plugins/check_ntp $ARG1$
command[check_ntp_peer]=/usr/lib/nagios/plugins/check_ntp_peer $ARG1$
command[check_ntp_time]=/usr/lib/nagios/plugins/check_ntp_time $ARG1$
command[check_ping]=/usr/lib/nagios/plugins/check_ping $ARG1$
command[check_pop]=/usr/lib/nagios/plugins/check_pop $ARG1$
command[check_spop]=/usr/lib/nagios/plugins/check_spop $ARG1$
command[check_procs]=/usr/lib/nagios/plugins/check_procs $ARG1$
command[check_smtp]=/usr/lib/nagios/plugins/check_smtp $ARG1$
command[check_ssmtp]=/usr/lib/nagios/plugins/check_ssmtp $ARG1$
command[check_ssh]=/usr/lib/nagios/plugins/check_ssh $ARG1$
command[check_swap]=/usr/lib/nagios/plugins/check_swap $ARG1$
command[check_tcp]=/usr/lib/nagios/plugins/check_tcp $ARG1$
command[check_udp]=/usr/lib/nagios/plugins/check_udp $ARG1$
command[check_ups]=/usr/lib/nagios/plugins/check_ups $ARG1$
command[check_users]=/usr/lib/nagios/plugins/check_users $ARG1$
6.1.3 nrpeサーバー有効化、起動
# systemctl enable --now nrpe
# systemctl start nrpe
6.1.4 ファイアウォールでNRPEのポート5666/tcp,5666/udpを開く
# firewall-cmd  --add-port=5666/tcp --permanent
# firewall-cmd --reload
6.2 Nagios サーバー側の設定
6.2.1 nrpeプラグインのインストール
# zypper install nagios-plugins-nrpe
6.2.2 nagiosプラグインディレクトリーを確認
# ls /usr/lib/nagios/plugins
check_breeze check_dns check_ide_smart check_mailq check_ntp_peer check_procs_perf check_ssh check_wave
check_by_ssh check_dummy check_ifoperstatus check_mrtg check_ntp_time check_real check_ssmtp negate
check_clamd check_file_age check_ifstatus check_mrtgtraf check_nwstat check_rpc check_swap nrpe_check_control
check_cluster check_flexlm check_imap check_nntp check_oracle check_rta_multi check_tcp urlize
check_dhcp check_ftp check_ircd check_nntps check_overcr check_sensors check_time utils.pm
check_dig check_host check_jabber check_nrpe check_ping check_simap check_udp utils.sh
check_disk check_http check_load check_nt check_pop check_smtp check_ups
check_disk_smb check_icmp check_log check_ntp check_procs check_spop check_users
6.2.3 commands.cfg編集
# vi /etc/nagios/objects/commands.cfg

# 最終行に追記
define command {
    command_name    check_nrpe
    command_line    $USER1$/check_nrpe -H $HOSTADDRESS$ -c $ARG1$
}
6.2.4 先ほどホスト追加したときに作成した korodes.cfg を編集追加する
今回はHTTP、SSH、FTP を追加してみる
# vi /etc/nagios/servers/korodes.cfg

# 以下を追加する

# 'HTTP' command definition
define service{
        use                              local-service
        host_name                        korodes
        service_description              HTTP
        check_command                    check_http
        }

# 'SSH' command definition
define service{
        use                              local-service
        host_name                        korodes
        service_description              SSH
        check_command                    check_ssh
       }
# 'FTP' command definition
define service{
        use                              local-service
        host_name                        korodes
        service_description              FTP
        check_command                    check_ftp
        }
6.2.5 Nagios 再起動
# systemctl restart nagios.service
6.2.6 http://[Nagios Server IP Address]/nagios にアクセスする
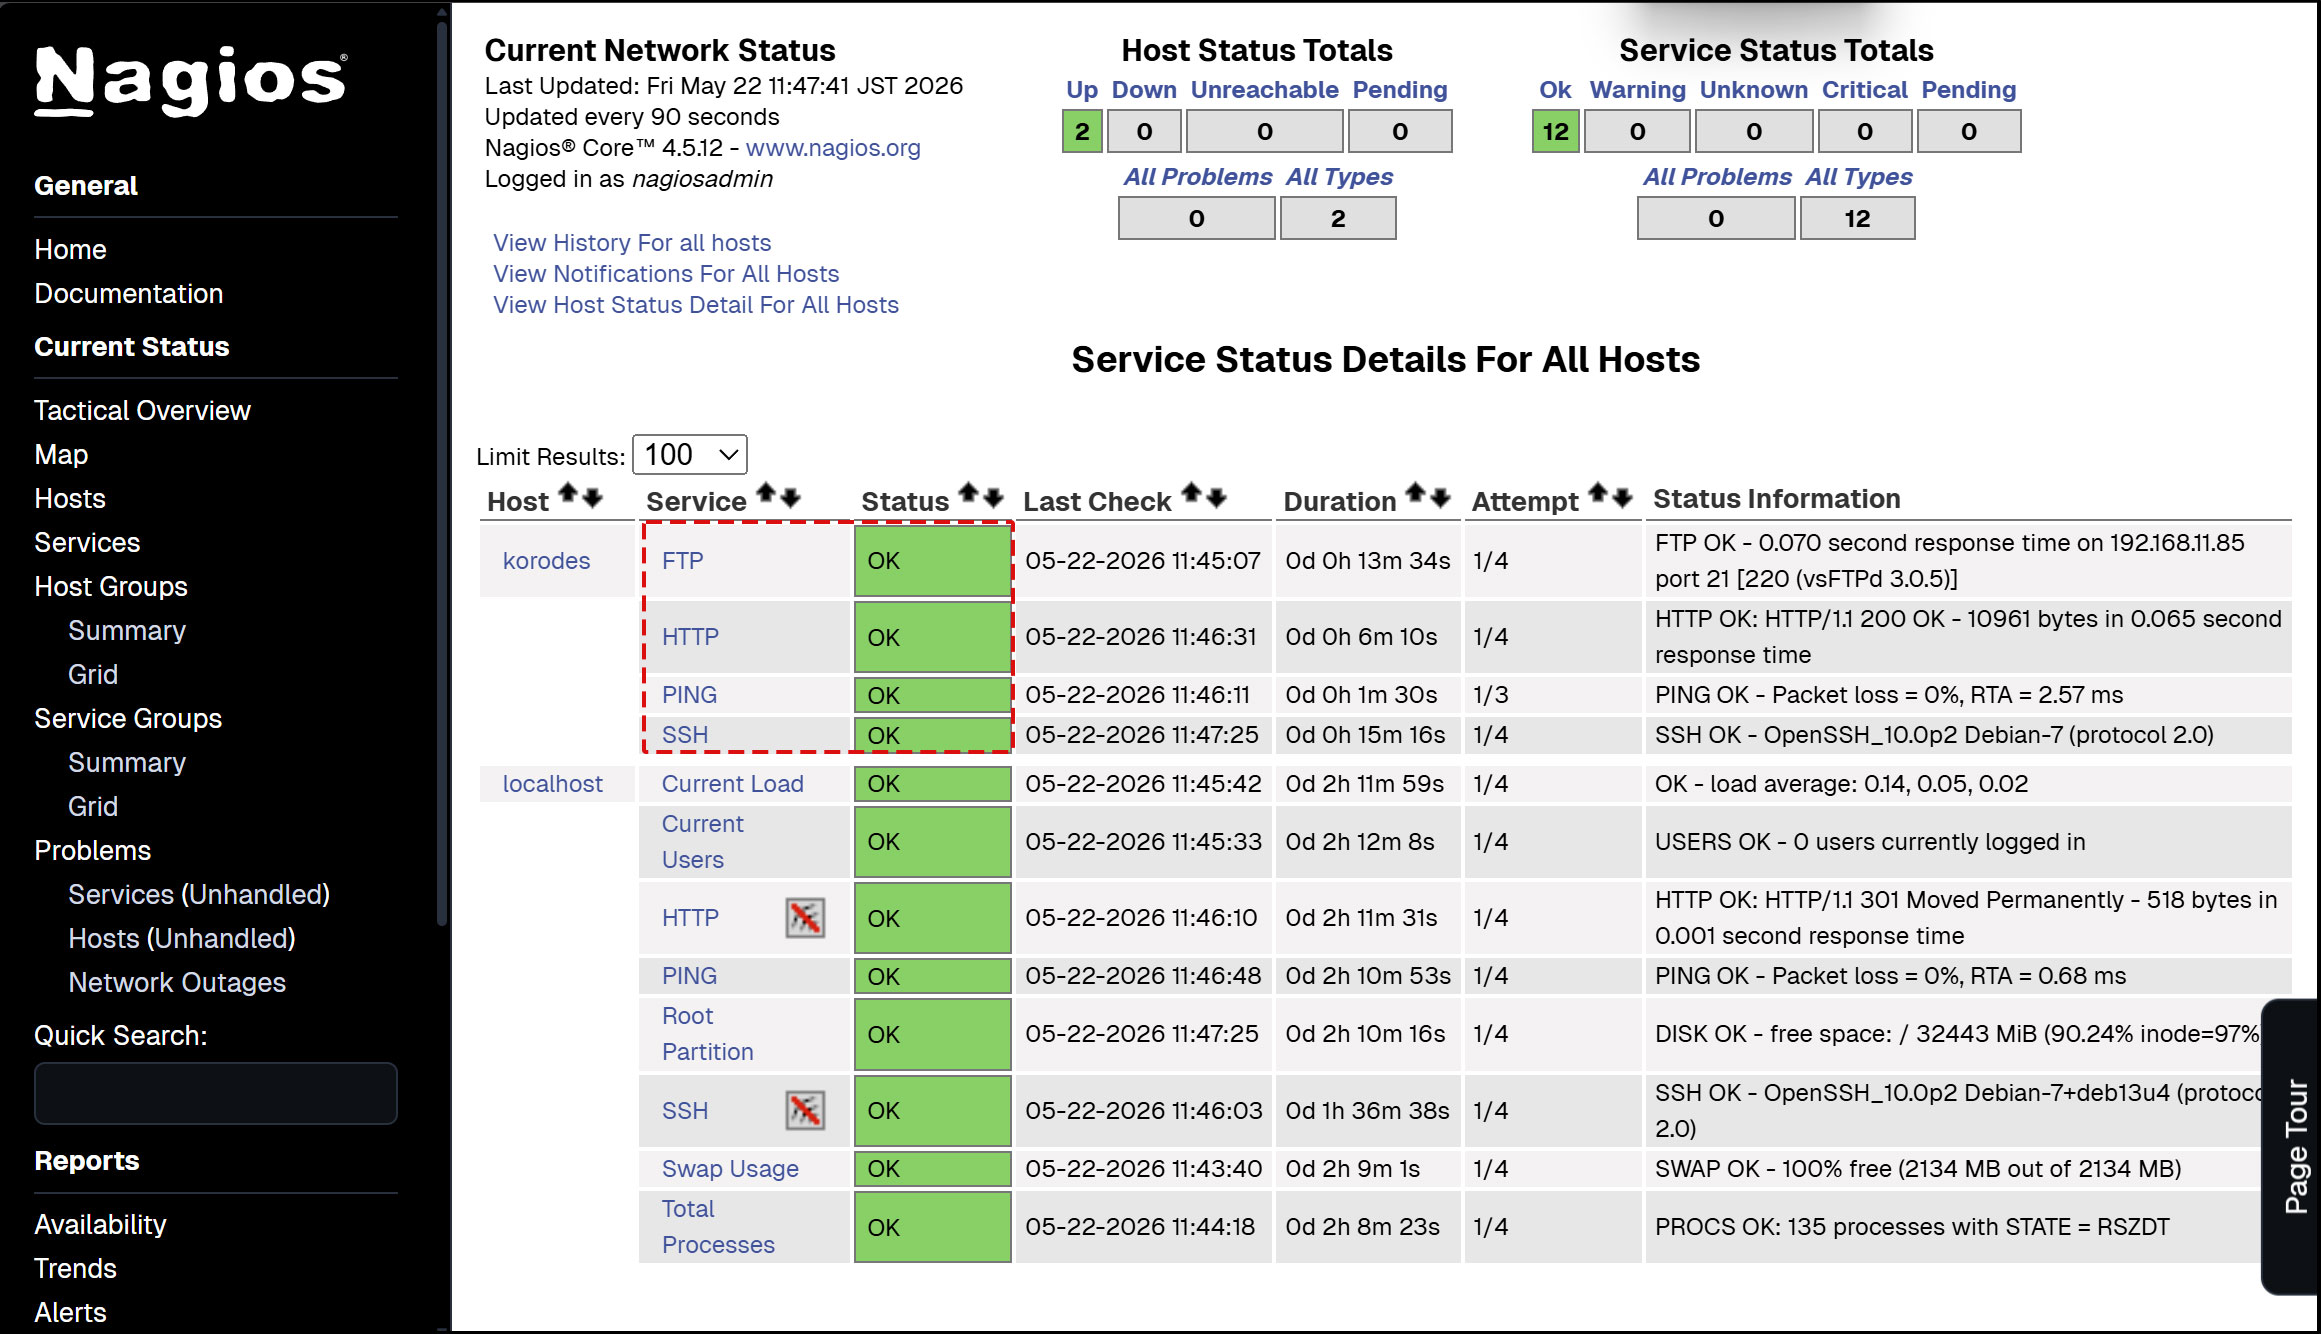
下図のように新しく追加した監視サービスが追加されている