Contents
Installation of open source integrated monitoring software "Zabbix7".
Zabbix is an open source integrated monitoring software for centralized monitoring of servers, networks and applications. It provides monitoring, fault detection and notification functions required for integrated monitoring. With Zabbix agent and SNMP support for many platforms, you can monitor your entire system with a single Zabbix.
To run Zabbix, you will need the PHP programming language, MySQL/MariaDB as a database server, and a web server such as Apache or Nginx.
In this case, we will assume that all of the following conditions have already been configured.
This time we will install Zabbix 7.0 LTS released on 06/04/2024 in the following environment.
OracleLinux9.4 IP(192.168.11.83)
Apache/2.4.57 (Oracle Linux Server)
mysql Ver 8.0.36
PHP 8.3.8 (cli)
PHP 8.3.8 (fpm-fcgi)


zabbix7-server , zabbix7-agent , zabbix7-frontend Install
①Disable the Zabbix package provided by EPEL if it is installed. Edit /etc/yum.repos.d/epel.repo and add the following statement
|
1 2 3 |
[epel] ... excludepkgs=zabbix* |
➁Install Repository
Setup Zabbix 7 repository and install Zabbix Server.
Install Zabbix Agent for the monitored hosts so that Zabbix Server itself can be monitored at the same time.
|
1 |
# rpm -Uvh https://repo.zabbix.com/zabbix/7.0/oracle/9/x86_64/zabbix-release-7.0-2.el9.noarch.rpm |
|
1 |
# dnf clean all |
|
1 |
# dnf install zabbix-server-mysql zabbix-web-mysql zabbix-apache-conf zabbix-sql-scripts zabbix-selinux-policy |
This time we will install zabbix-agent2
|
1 |
# dnf install zabbix-agent2 zabbix-agent2-plugin-* |
Create database and user for Zabbix
Create database schema for Zabbix server.
Login to MariaDB server as root account and create MariaDB database (e.g. my_zabbix_db), user (e.g. zabbix_user) and password (e.g.?WWabcd123)
|
1 2 3 4 5 6 7 |
# mysql -u root -p Password: >CREATE DATABASE my_zabbix_db character set utf8 collate utf8_bin; >CREATE USER 'zabbix_user'@'localhost' IDENTIFIED BY '?WWabcd123'; >GRANT ALL PRIVILEGES ON my_zabbix_db.* TO 'zabbix_user'@'localhost' WITH GRANT OPTION; >set global log_bin_trust_function_creators = 1; >exit; |
Load Zabbix default schema for database
|
1 |
# zcat /usr/share/zabbix-sql-scripts/mysql/server.sql.gz | mysql --default-character-set=utf8mb4 -uzabbix_user -p'?WWabcd123' my_zabbix_db |
Update Zabbix configuration
Edit Zabbix server configuration file /etc/zabbix/zabbix_server.conf and update database configuration for Zabbix server to connect to database
|
1 2 3 4 5 6 7 8 |
# vi /etc/zabbix/zabbix_server.conf Line 107 : Change DBName=my_zabbix_db Line 123 : Change DBUser=zabbix_user Line 131 : Uncommented and added DBPassword=?WWabcd123 |
Monitor Zabbix server itself
|
1 2 3 4 5 6 7 |
# vi /etc/zabbix/zabbix_agent2.conf # Line 80 : Specify Zabbix server Server=127.0.0.1 # Line 132 : Specify Zabbix server ServerActive=127.0.0.1 # Line 144 : Change to own hostname Hostname=Lepard |
Restart Zabbix Server and Agent Deamon so that they are ready to run at system startup.
|
1 2 |
# systemctl restart zabbix-server zabbix-agent2 httpd php-fpm # systemctl enable zabbix-server zabbix-agent2 httpd php-fpm |
PHP Configuration
|
1 2 3 4 5 6 7 8 9 10 |
# vi /etc/php-fpm.d/www.conf # Add to the last line php_value[max_execution_time] = 300 php_value[memory_limit] = 128M php_value[post_max_size] = 16M php_value[upload_max_filesize] = 2M php_value[max_input_time] = 300 php_value[max_input_vars] = 10000 php_value[always_populate_raw_post_data] = -1 php_value[date.timezone] = Asia/Tokyo |
Configuration Reflection
|
1 |
# systemctl restart zabbix-agent2 httpd php-fpm |
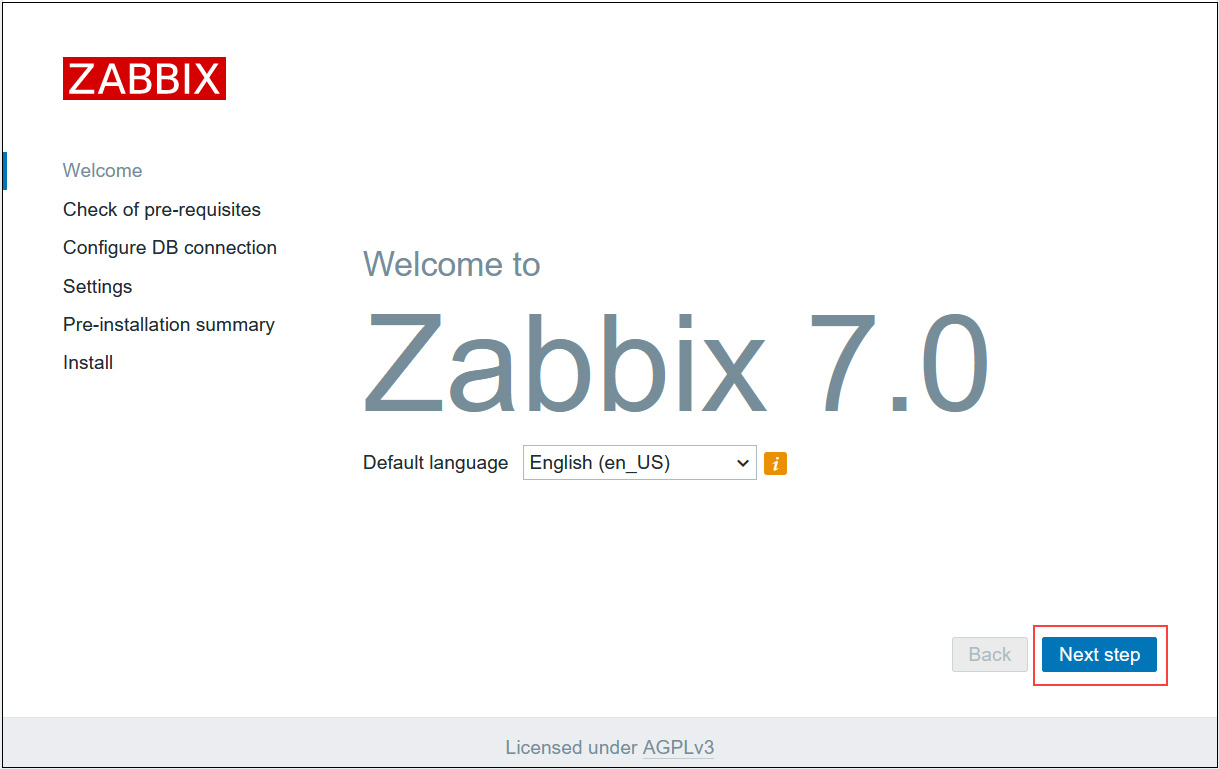
Running Zabbix Web Installer
Zabbix Web Installer can be accessed via "your-server-ip/zabbix" or "domain/zabbix".
Open a web browser and enter "http: //[your-server-IP_Address]/zabbix".
You will get the following screen. [ Next step].
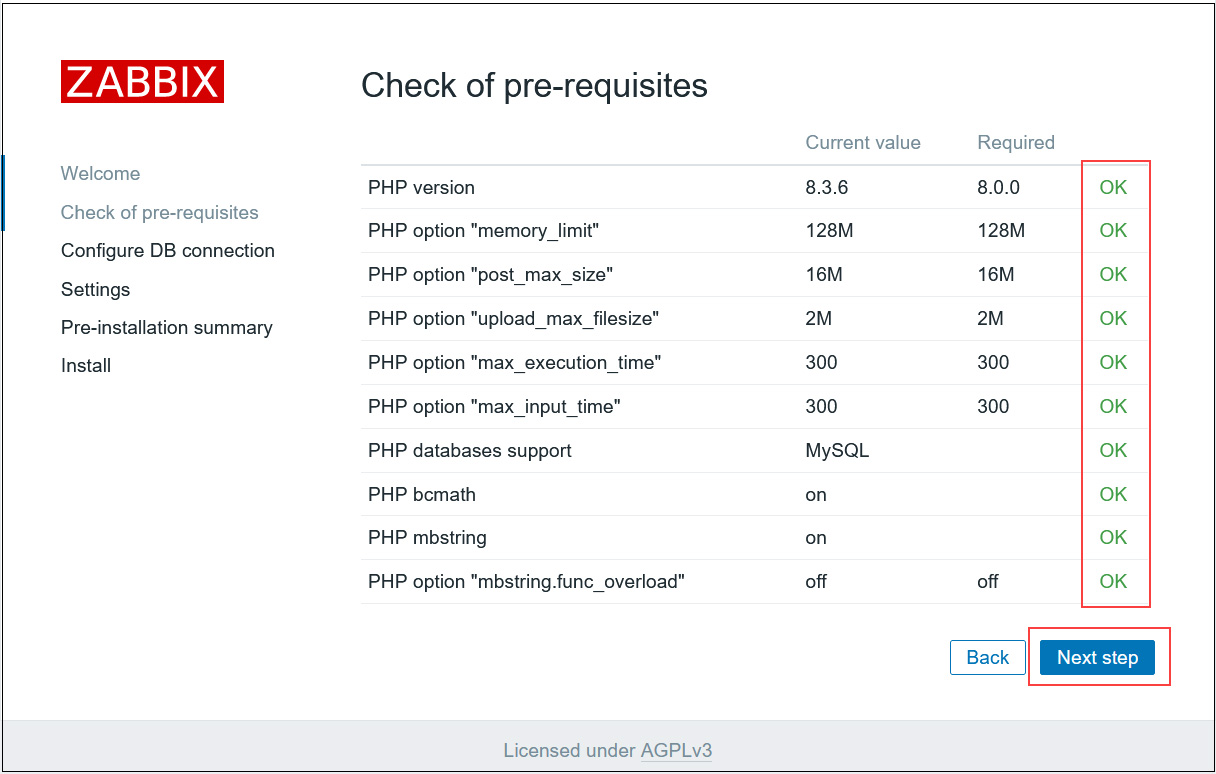
After confirming that all requirements are OK, click [Next step]
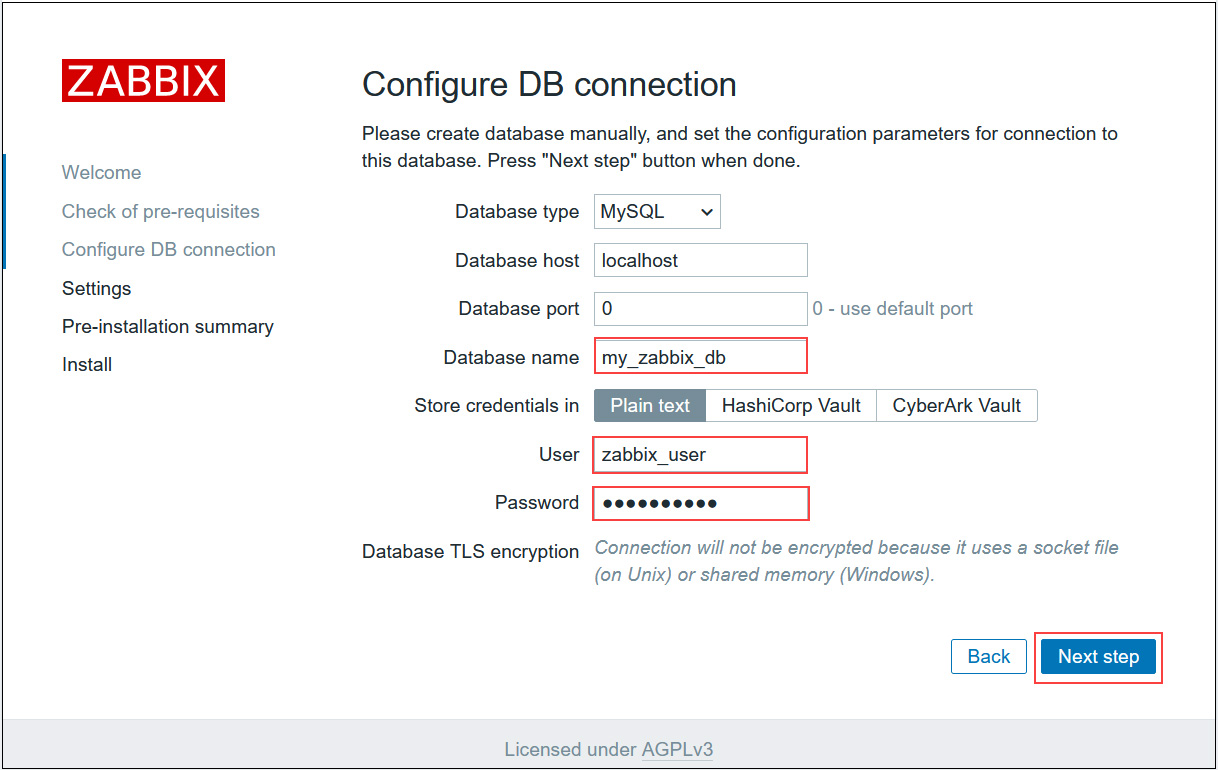
Enter the information you have set in the "Database name", "User", and "Password" fields, and click [Next step ].
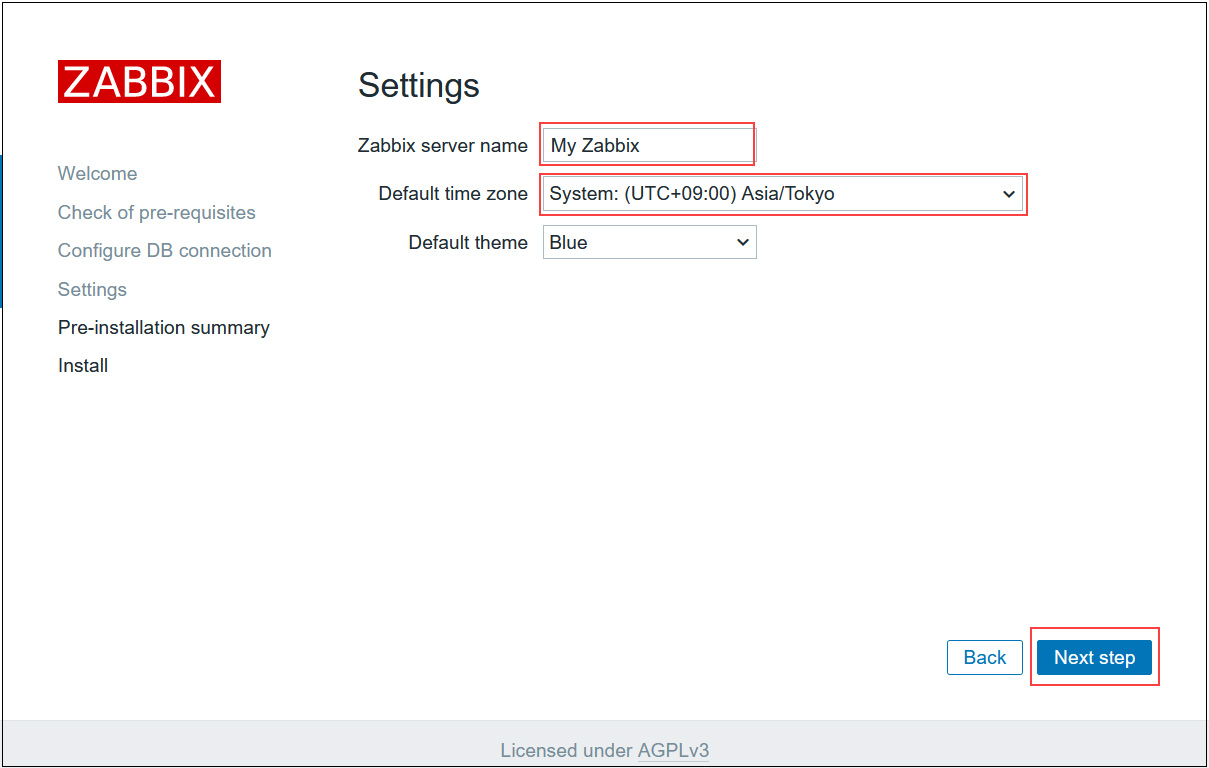
Enter any name for "Zabbix server names" and select Asia/Tokyo for time zone.
Make sure that you are in your own timezone and click [ Next step ].
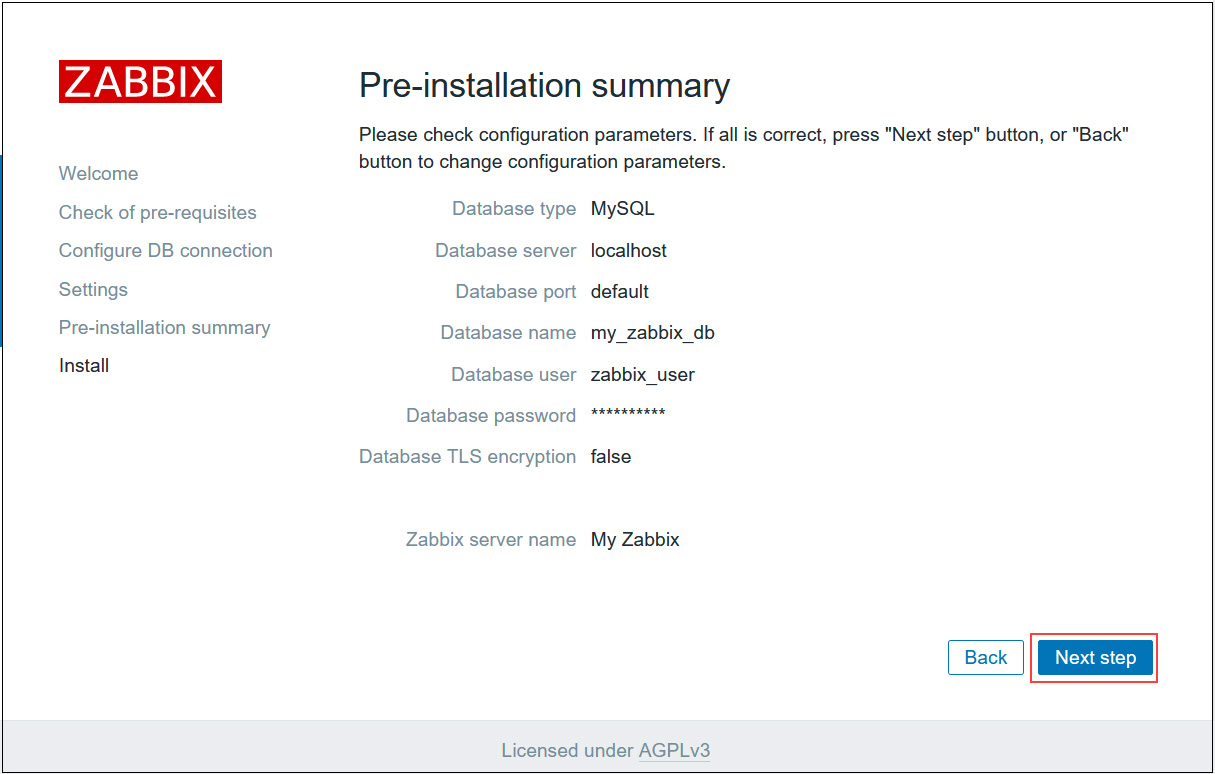
Reconfirm settings If information is correct, click [Next step]
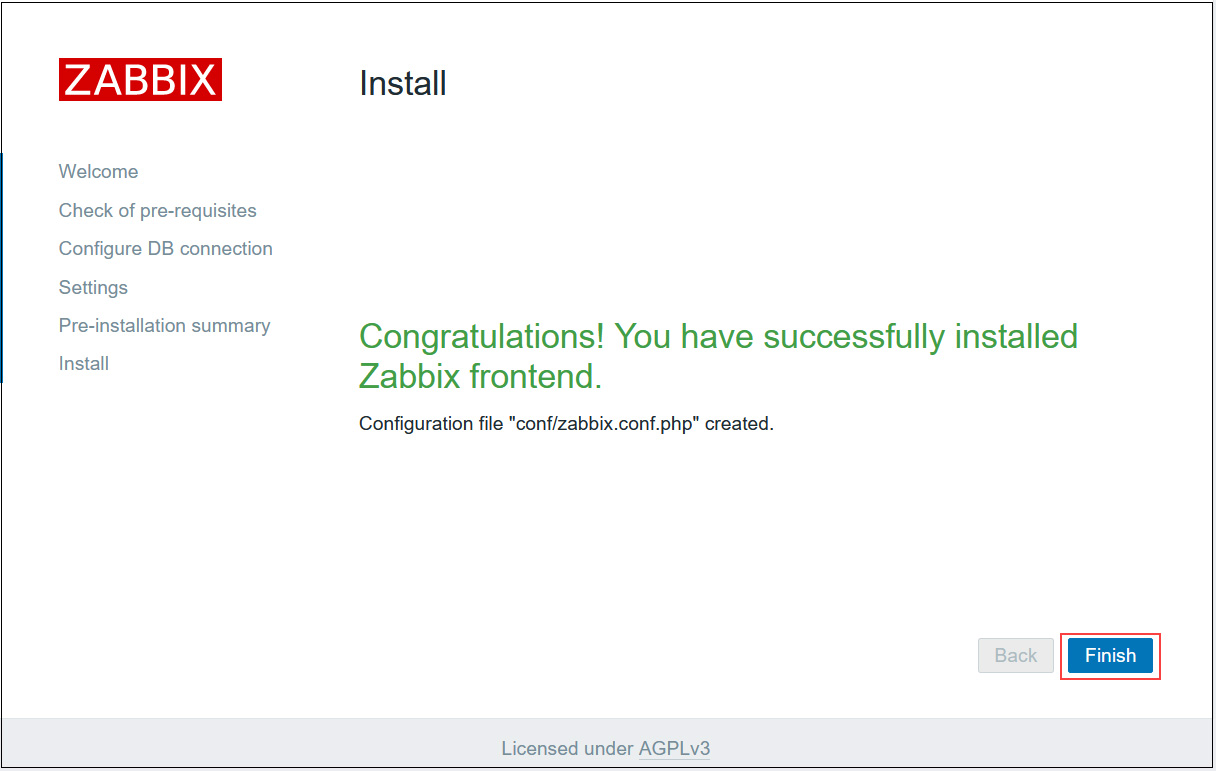
When the installation is successfully completed, the following page will appear. Click [Finish]
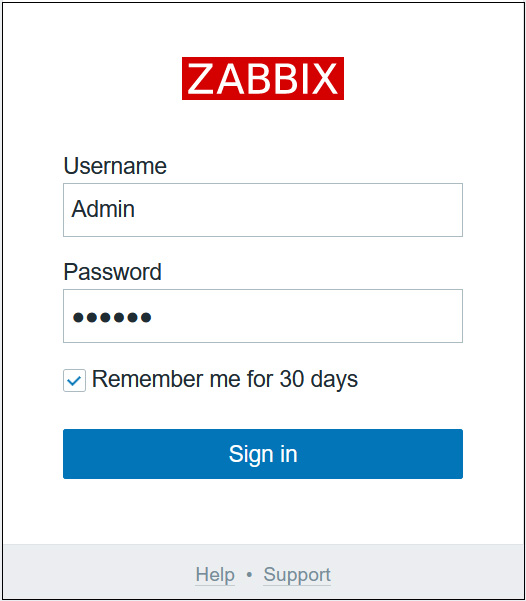
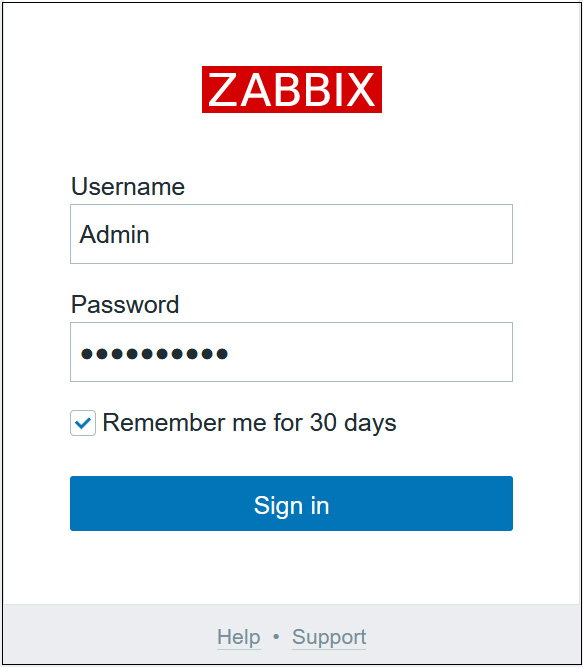
You will be redirected to Zabbix login page
Log in using the following default credentials
Username:Admin
Password:zabbix
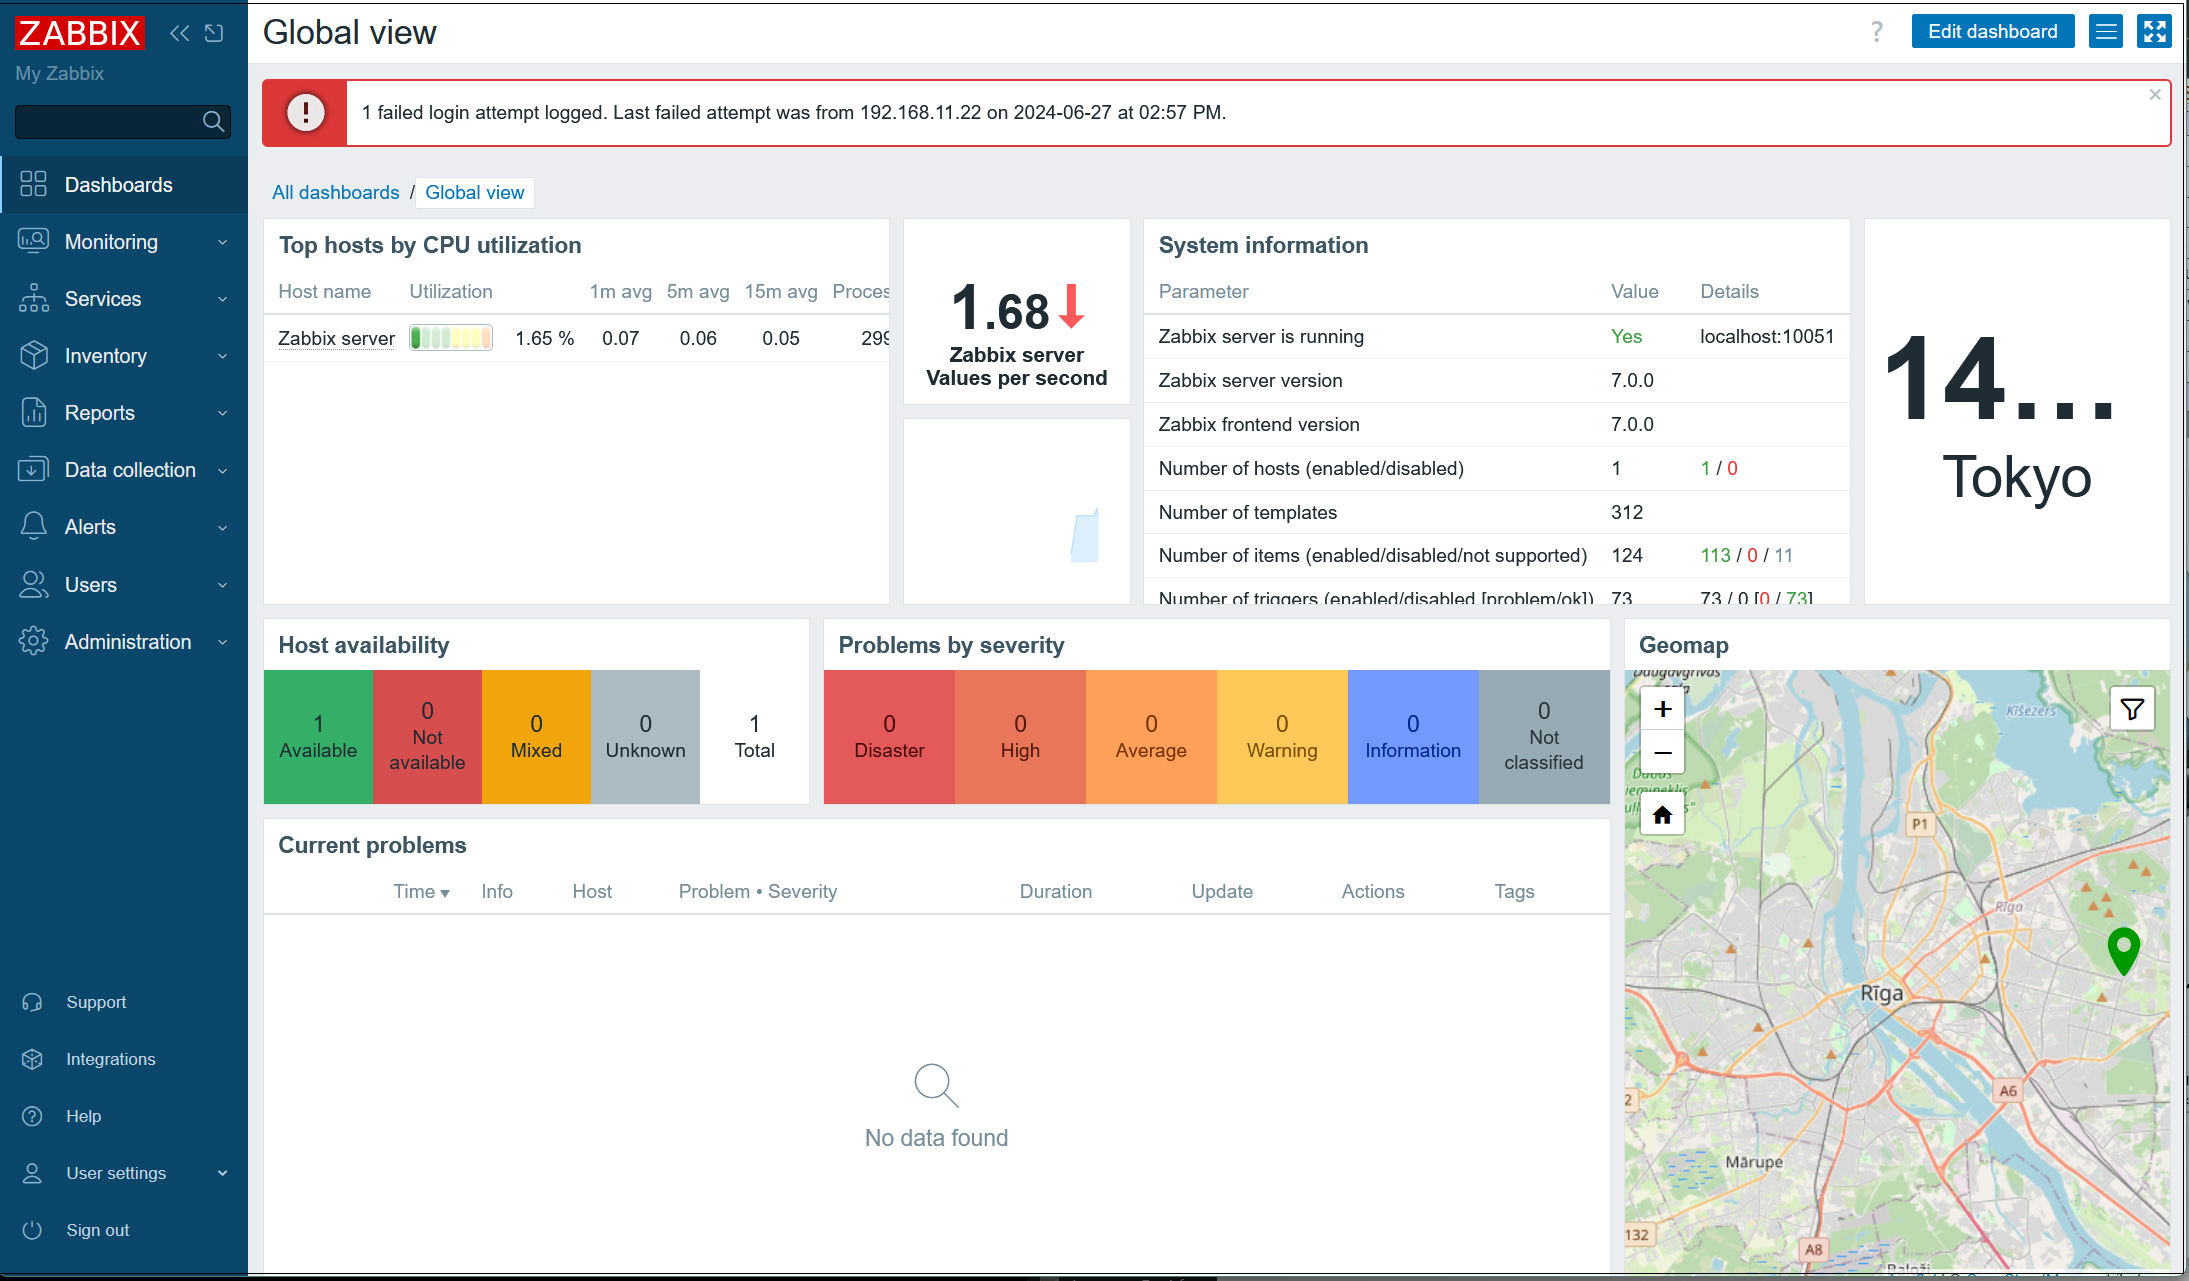
After successful login you will see the following screen (Zabbix Dashboard).
Various settings of Zabbix
Change Admin Password
For security purposes, change the default administrator password
Once the above dashboard is displayed, continue
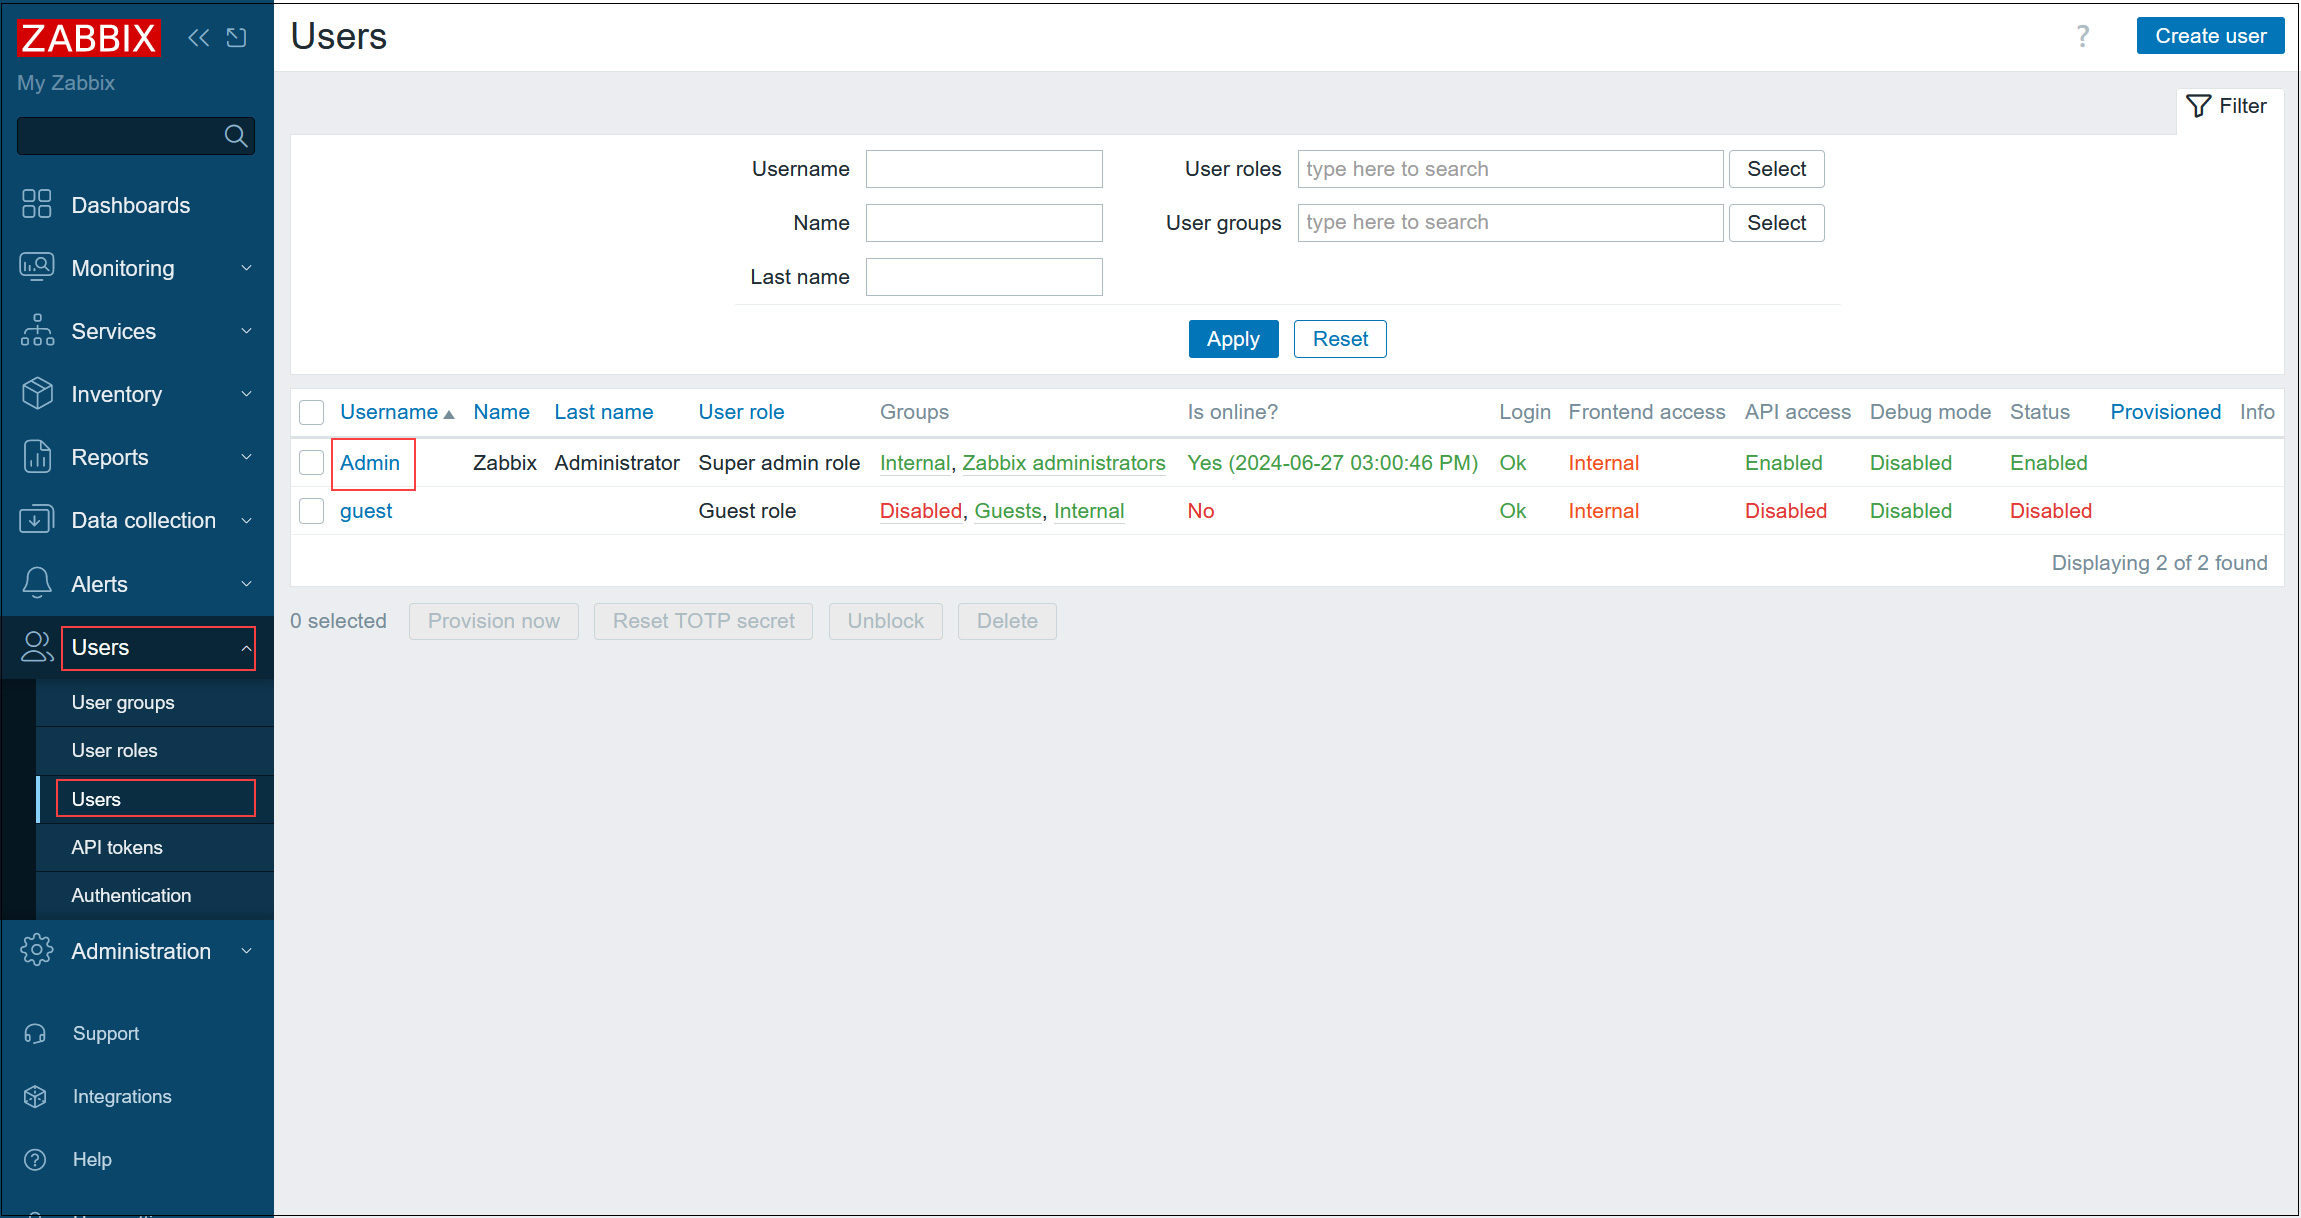
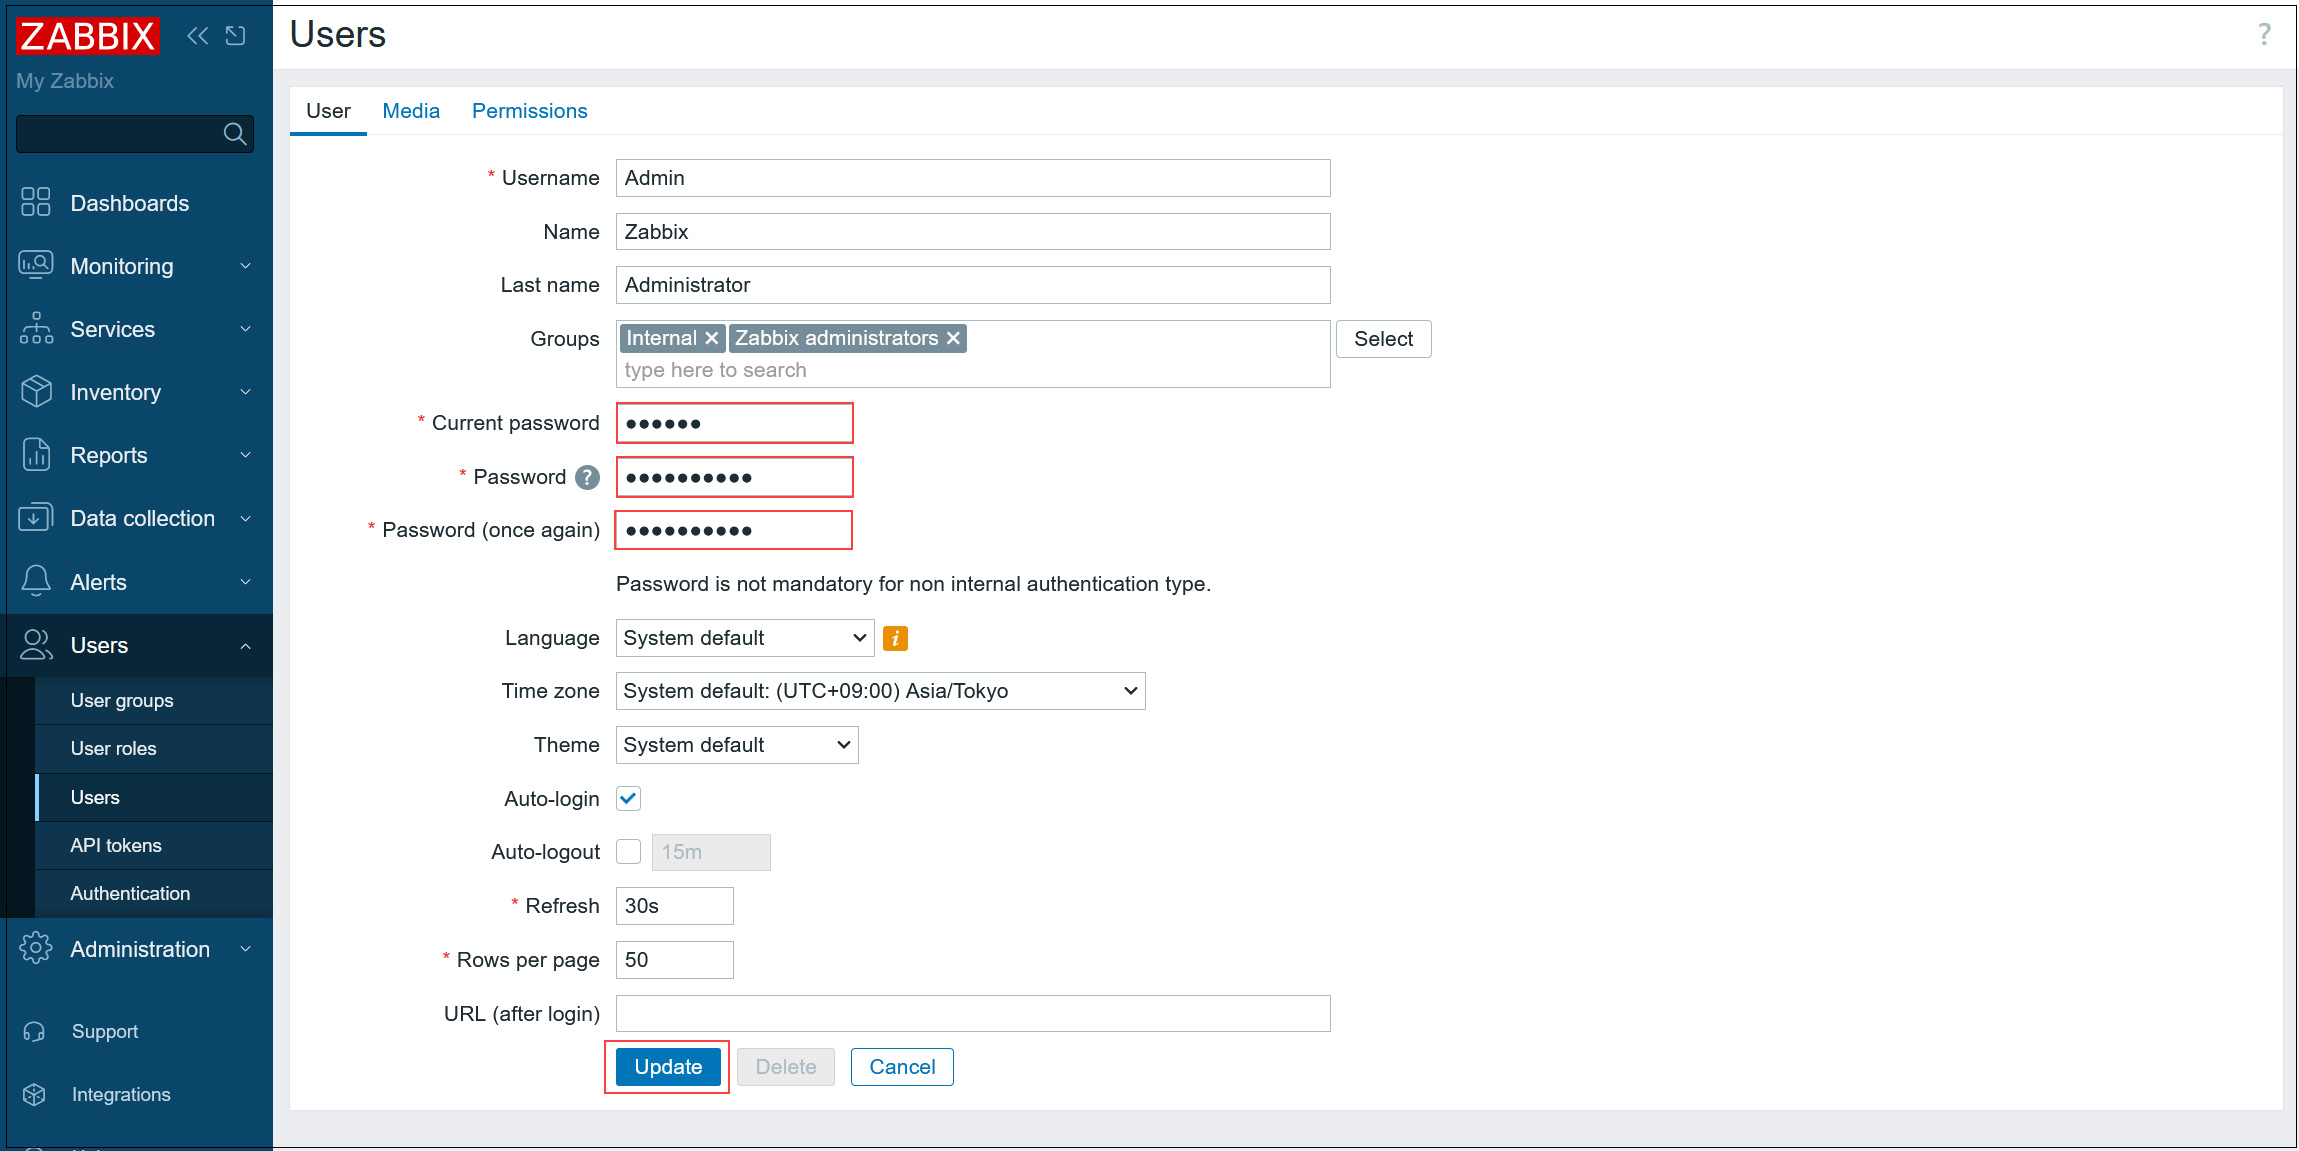
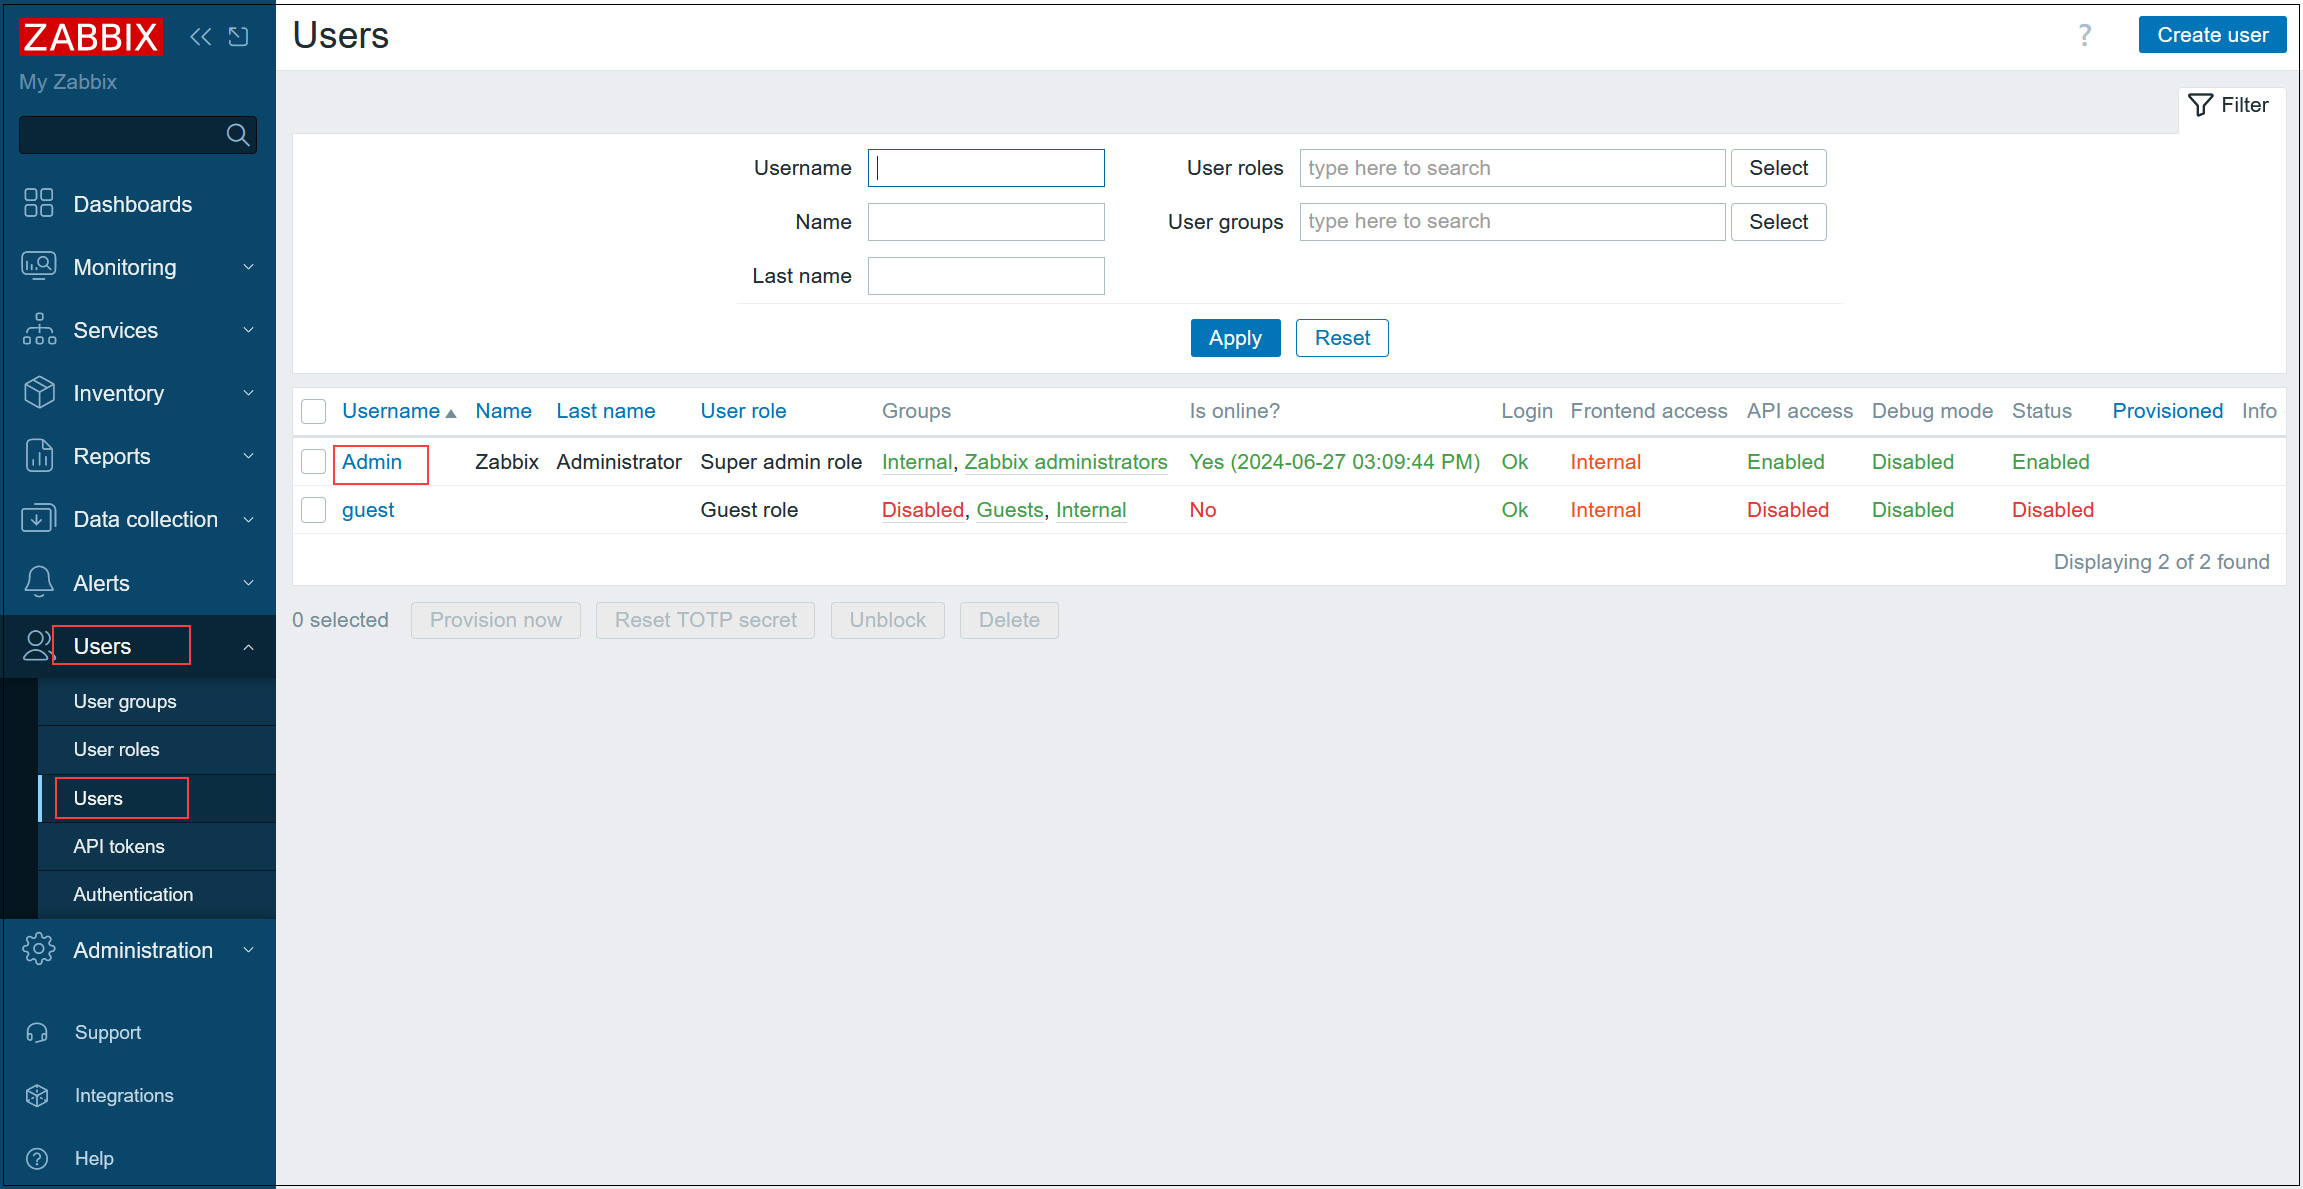
①Select [Users] - [Users] in the left pane and click [Admin] in the right pane
②Click [Change paddword]
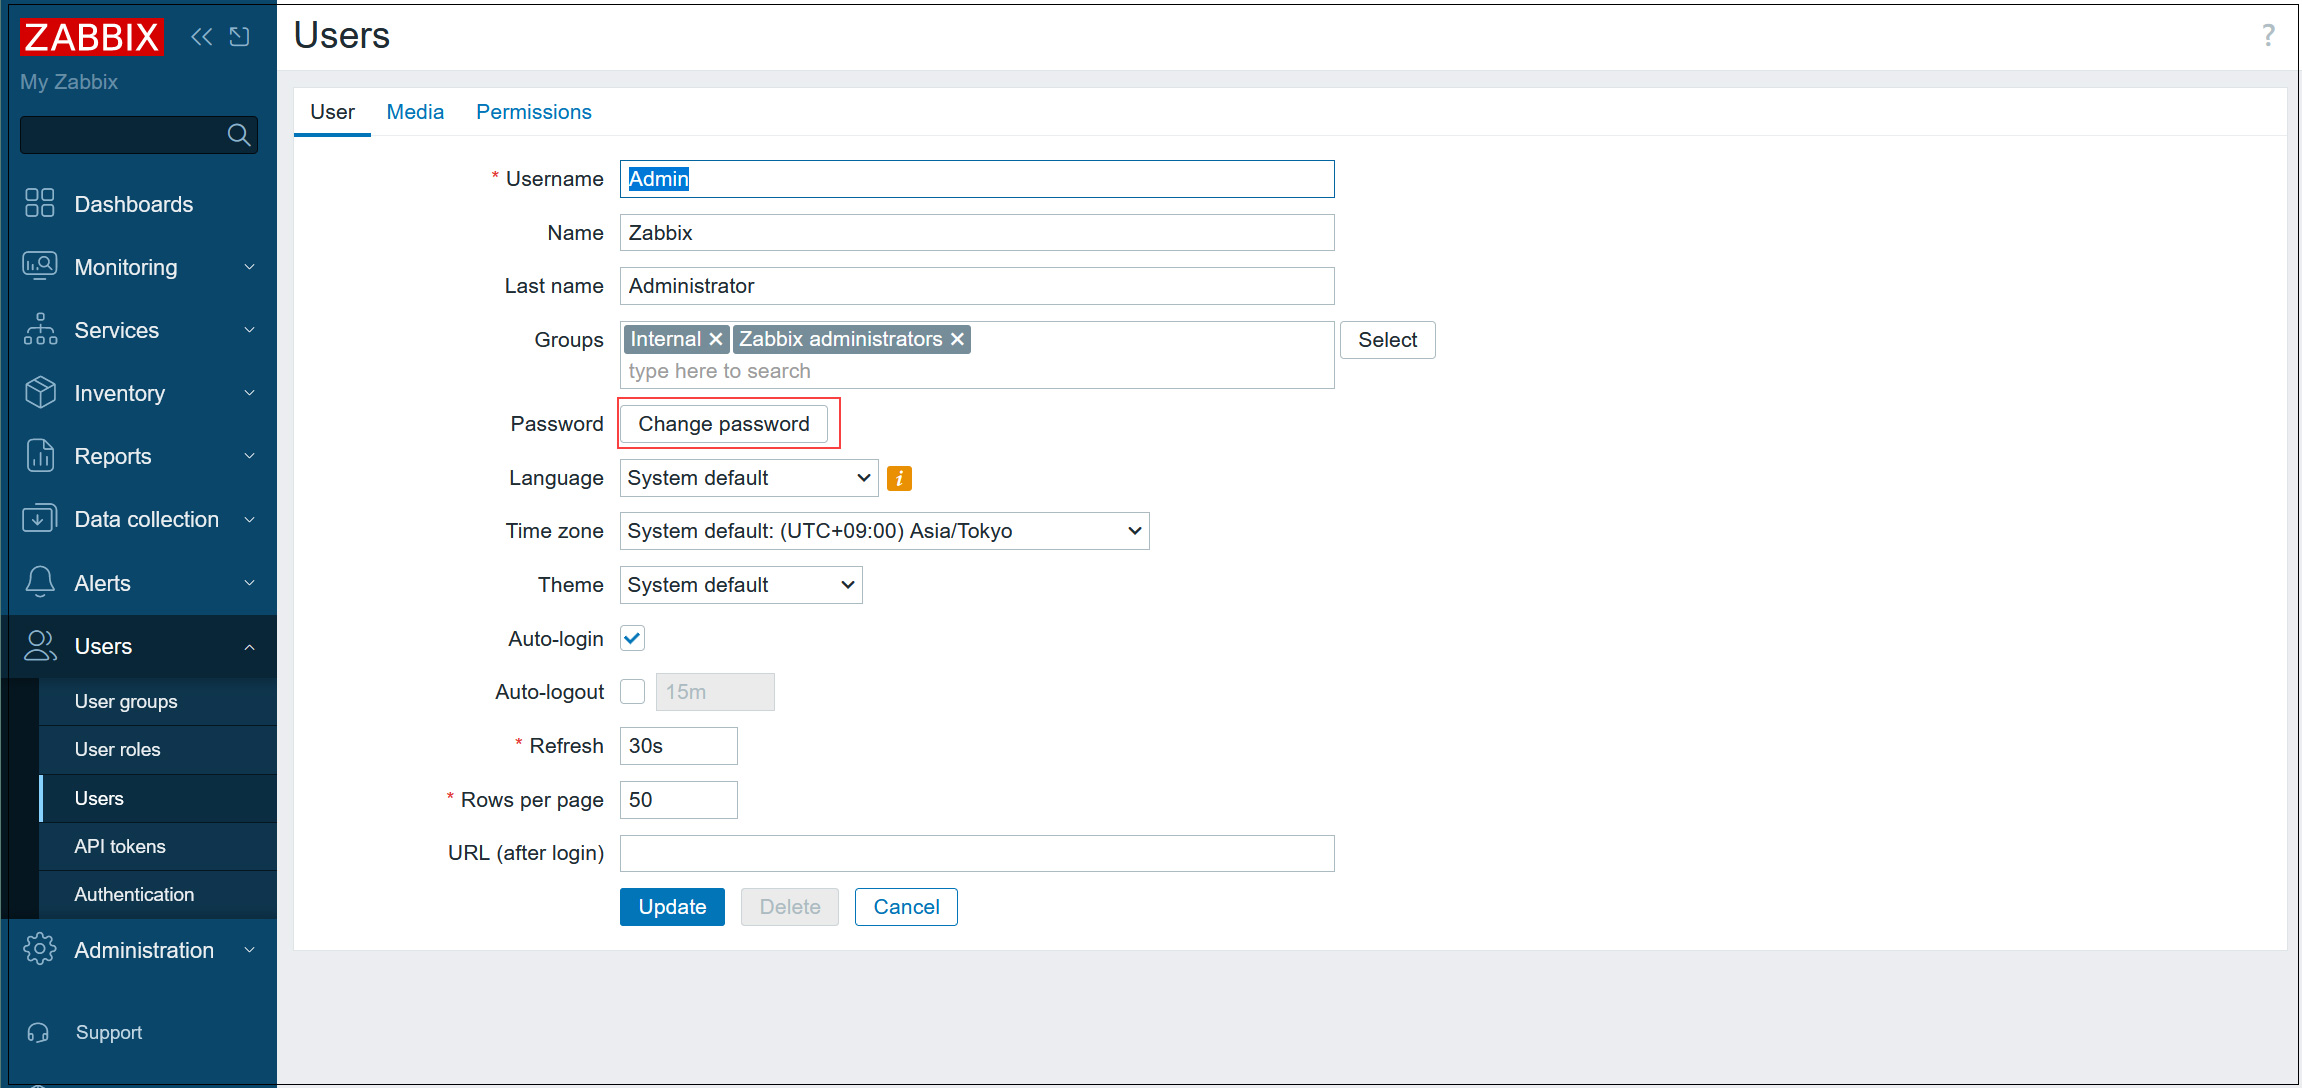
③Current password : Enter default password zabbix
Enter the password you wish to change and click Update.
You will be redirected to the login authentication screen again, so login with the password you created.
Email notification settings
Set up notifications so that you can receive various information, etc. by e-mail.
It is assumed that an SMTP server such as postfix is installed on the server.
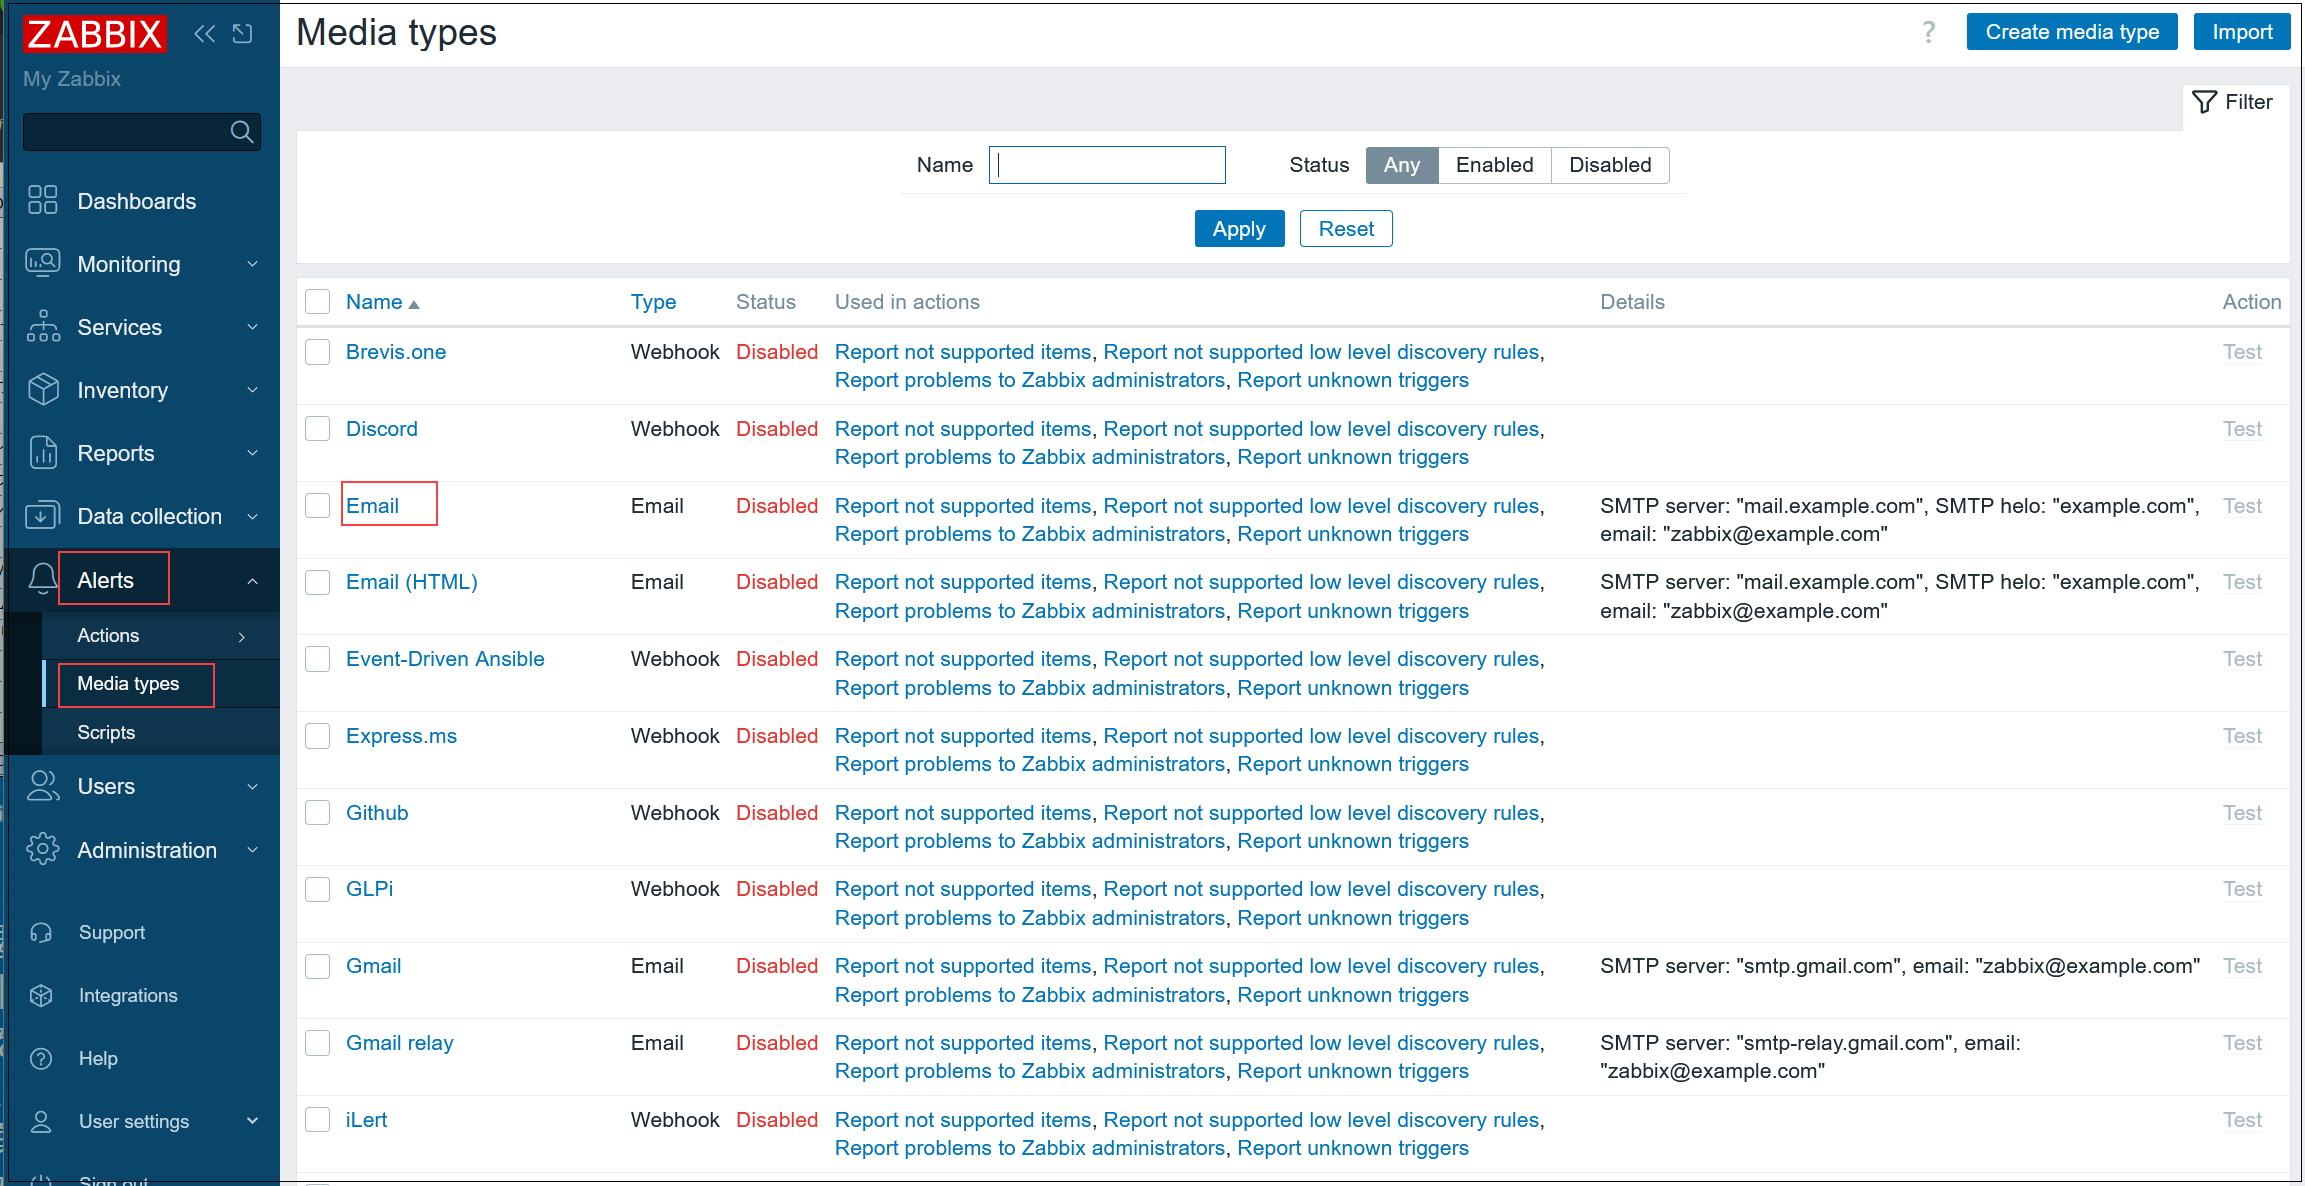
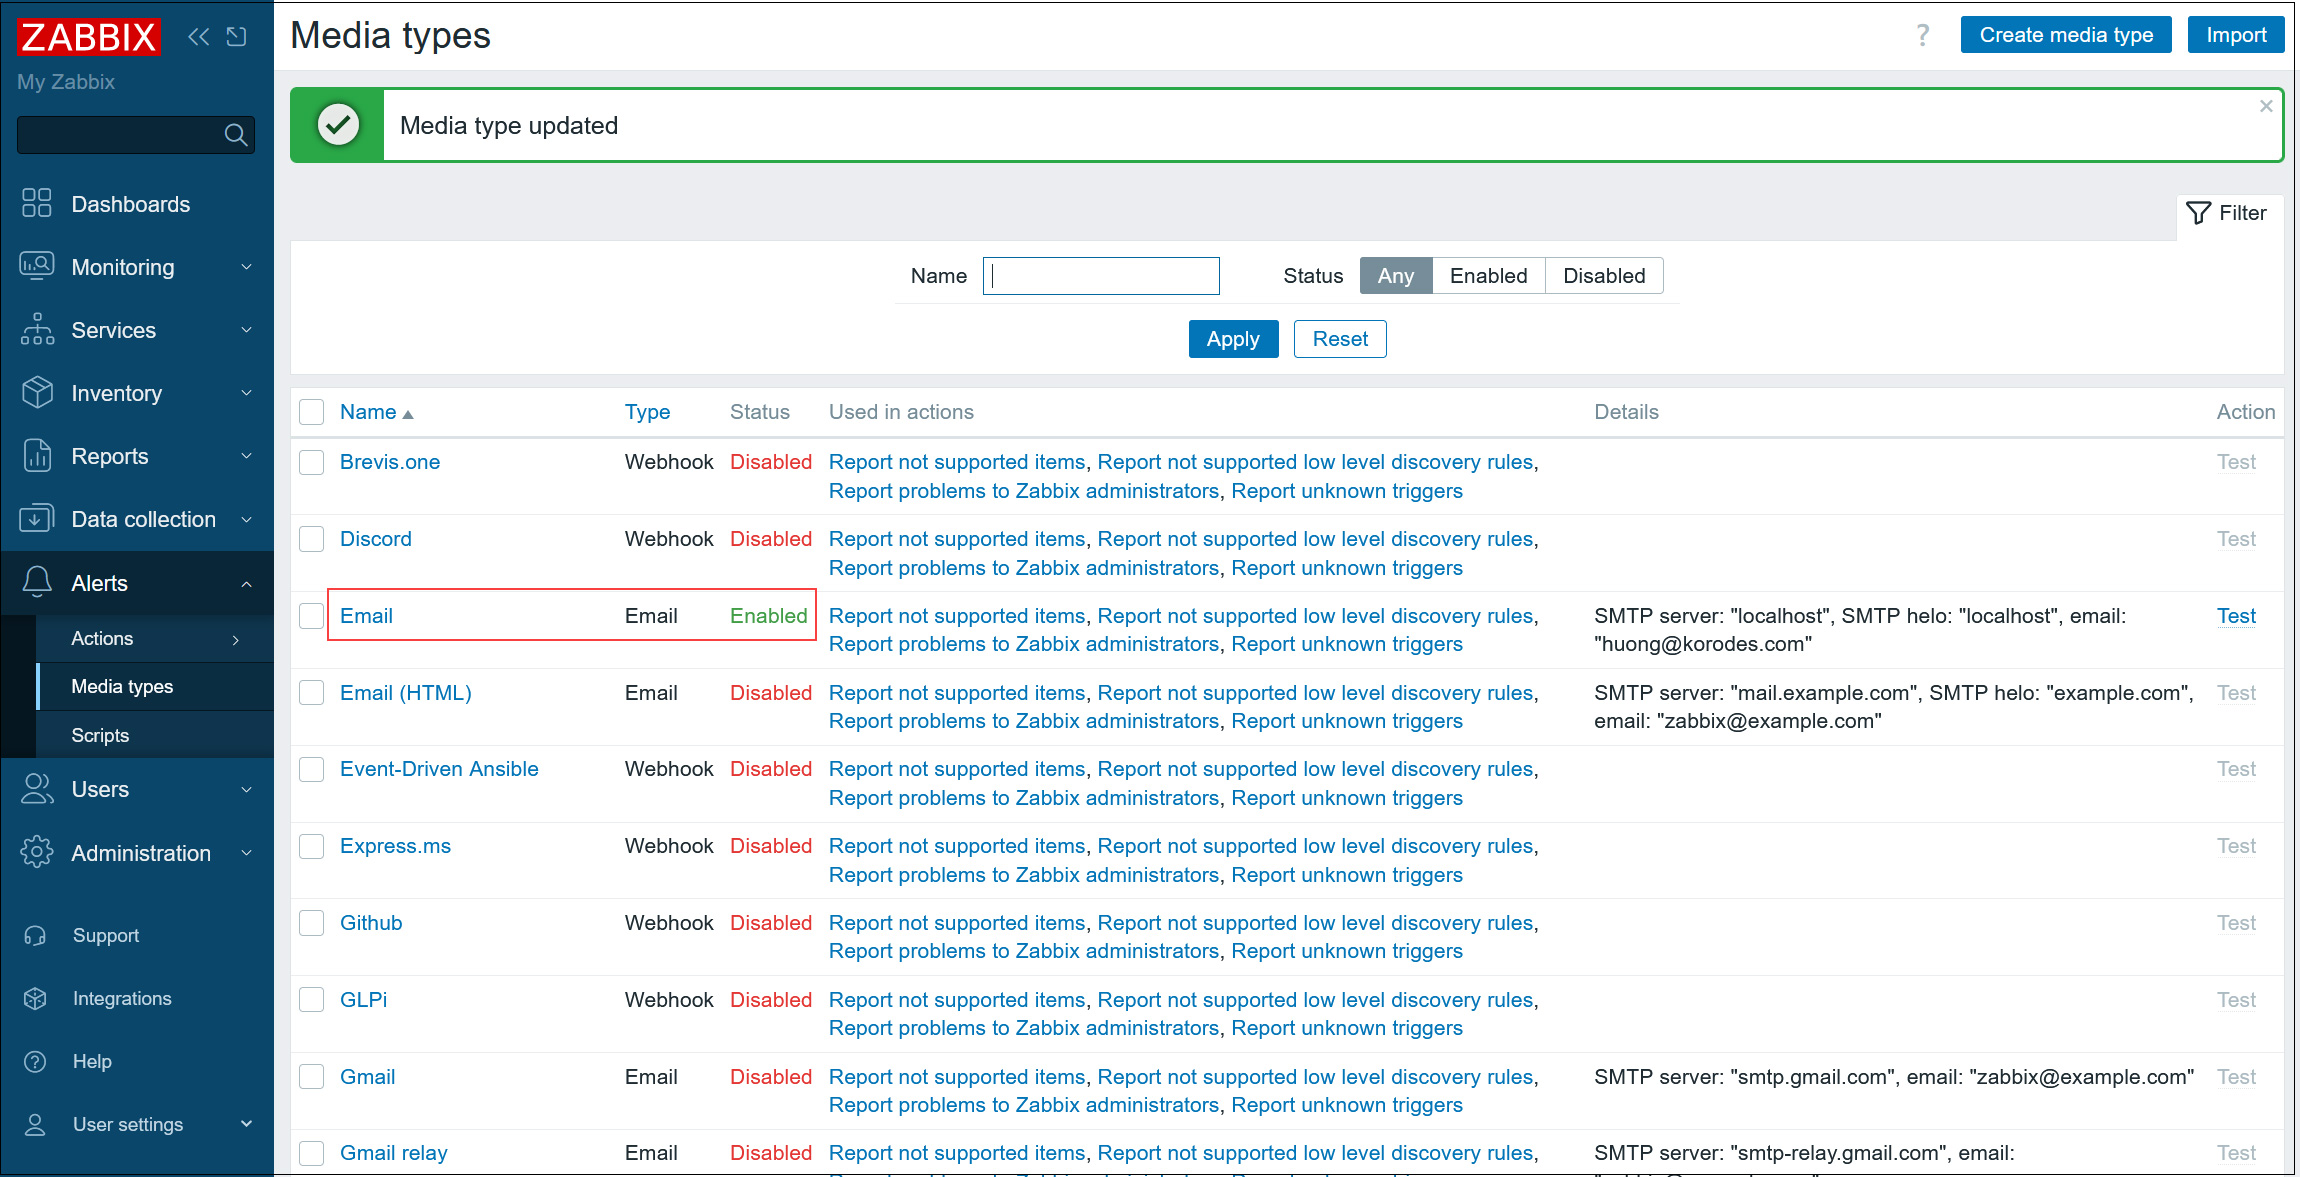
①Select [Alerts] - [Media Types] in the left pane and click [Email] in the right pane
➁Configure the mail server settings as shown below, check the [Enabled] checkbox, and click the [Update] button.
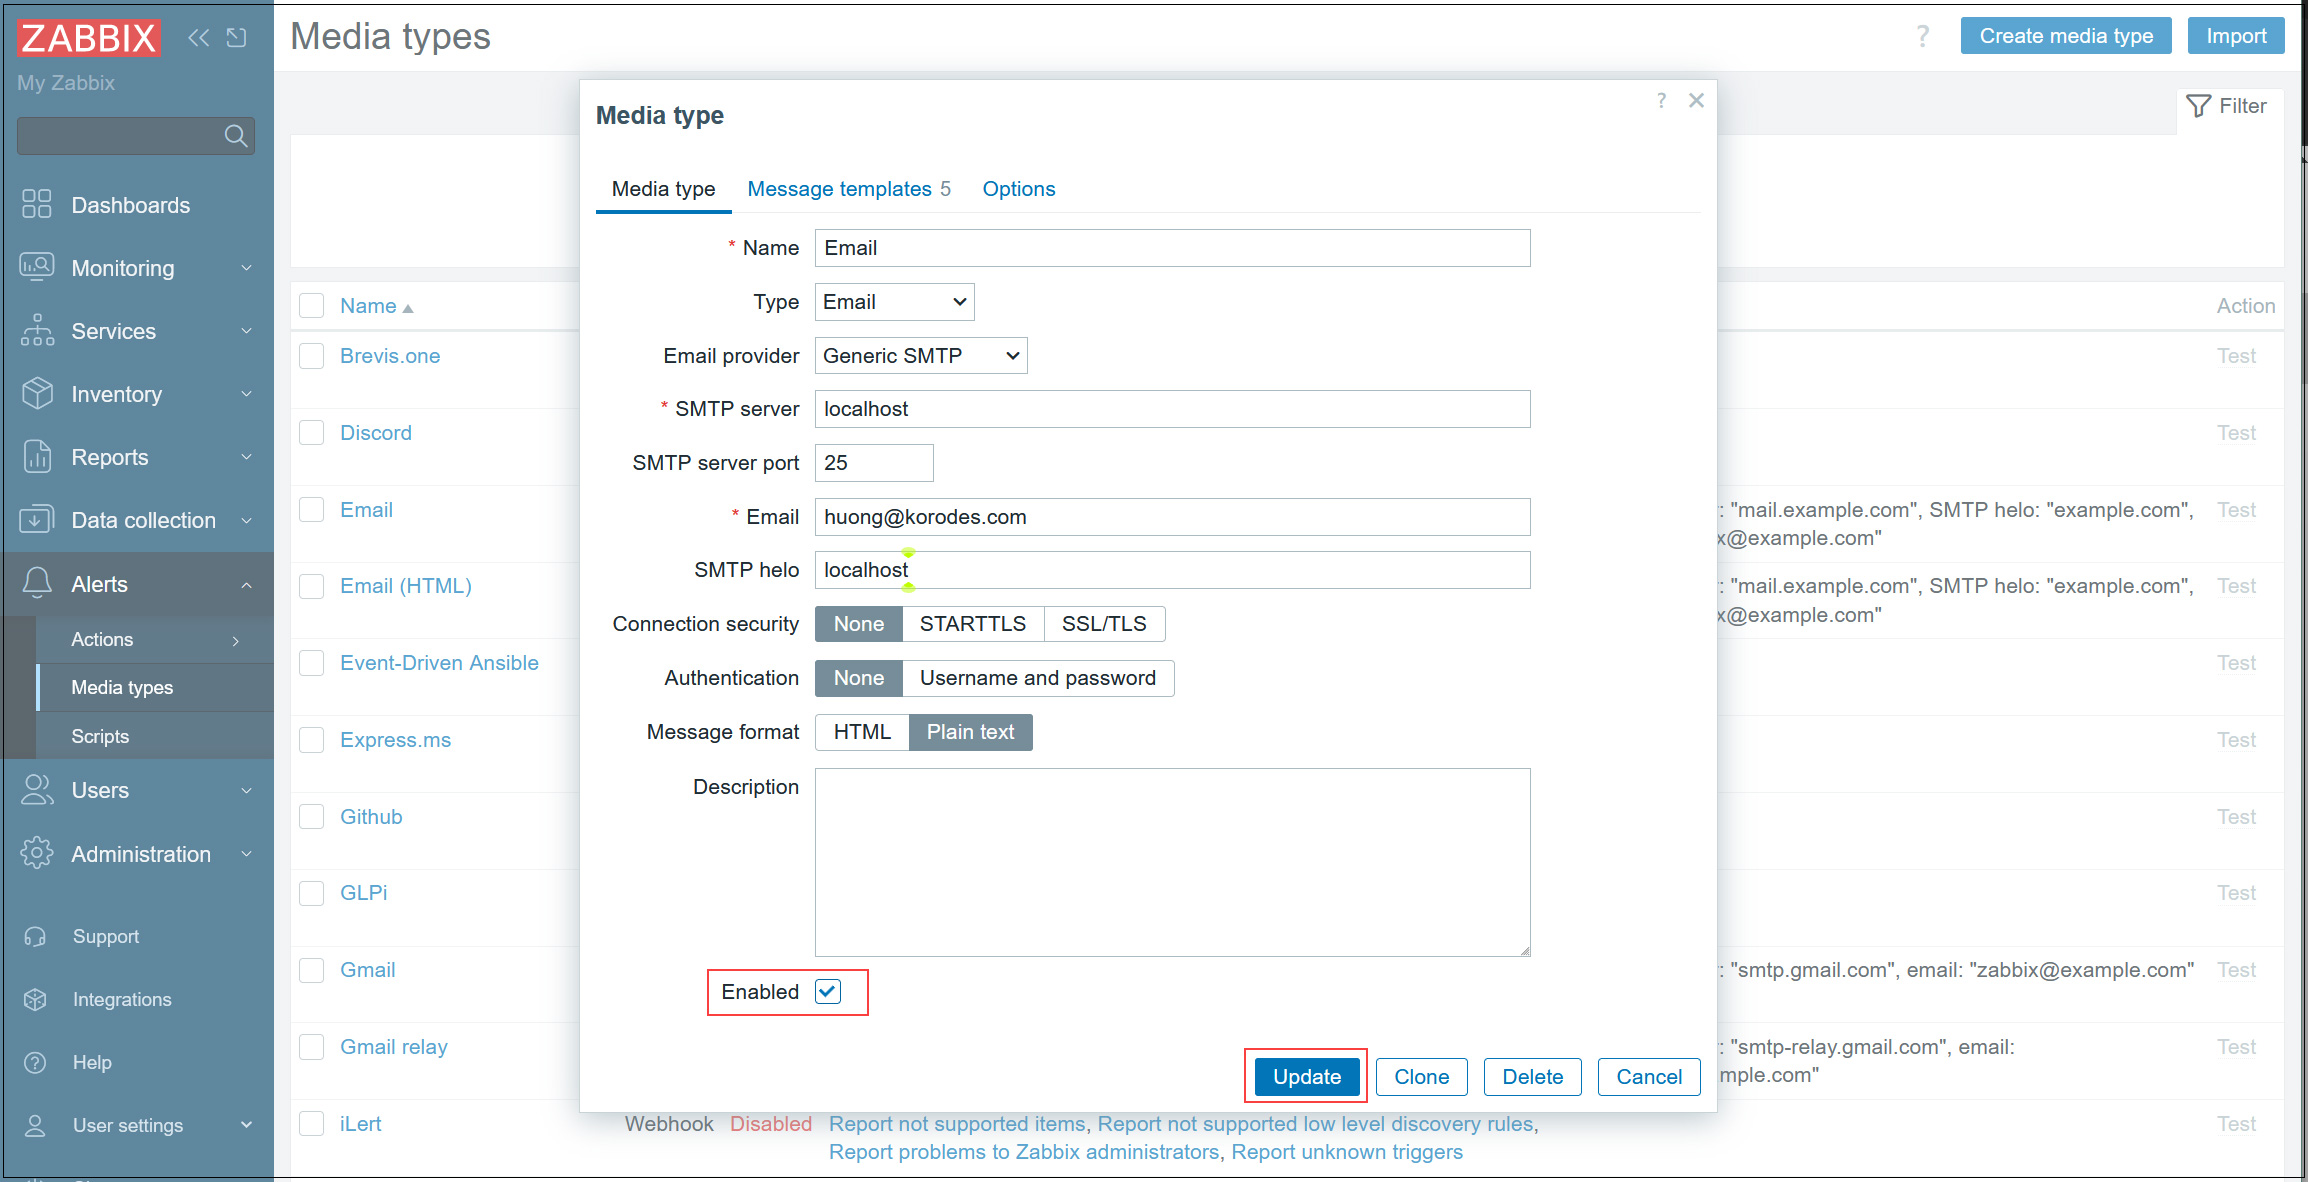
➂[Email] becomes [Enabled]
④Select [Users] - [Users] in the left pane and click [Admin] in the right pane
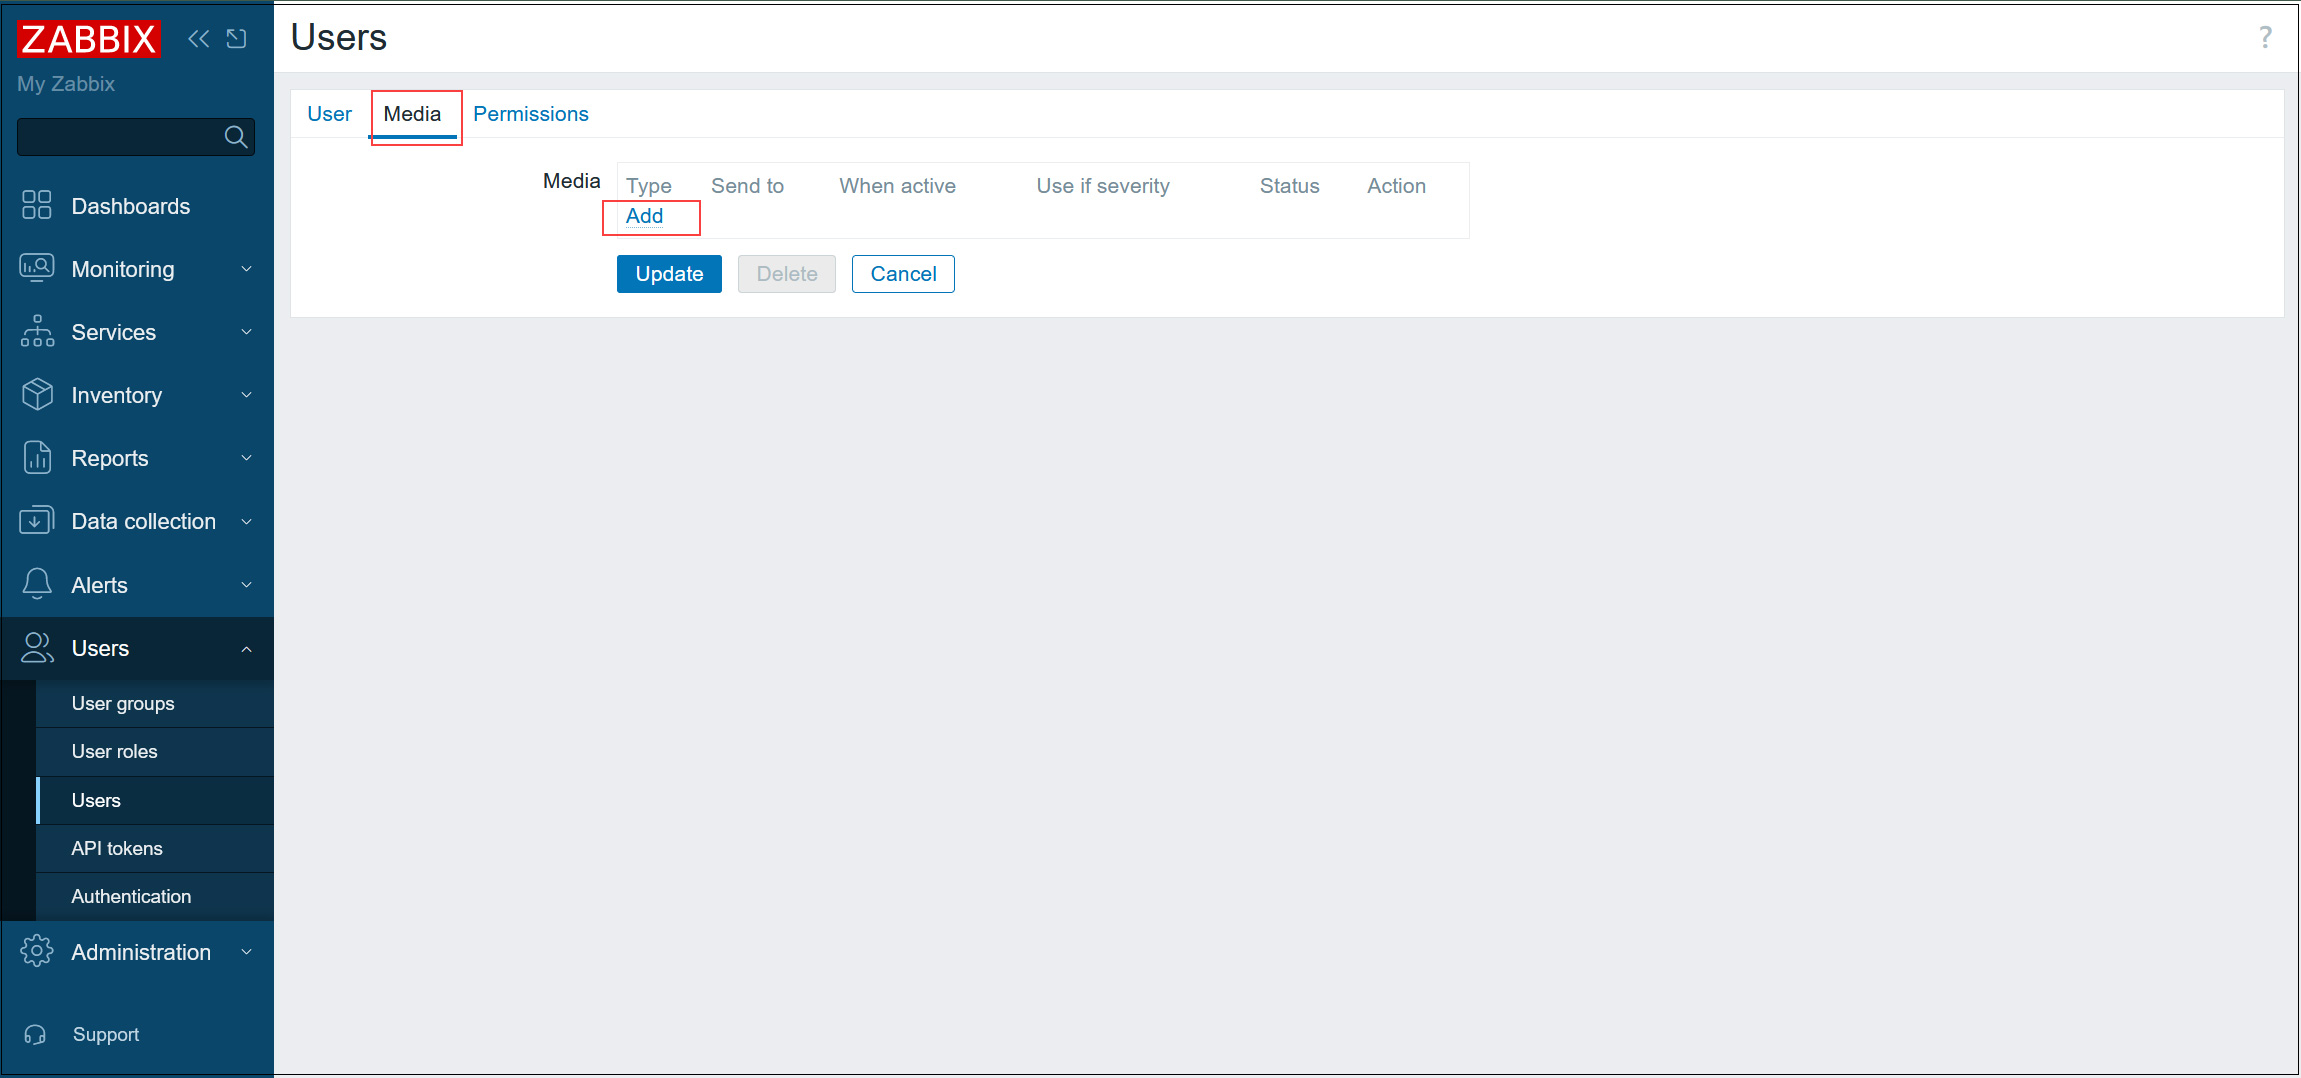
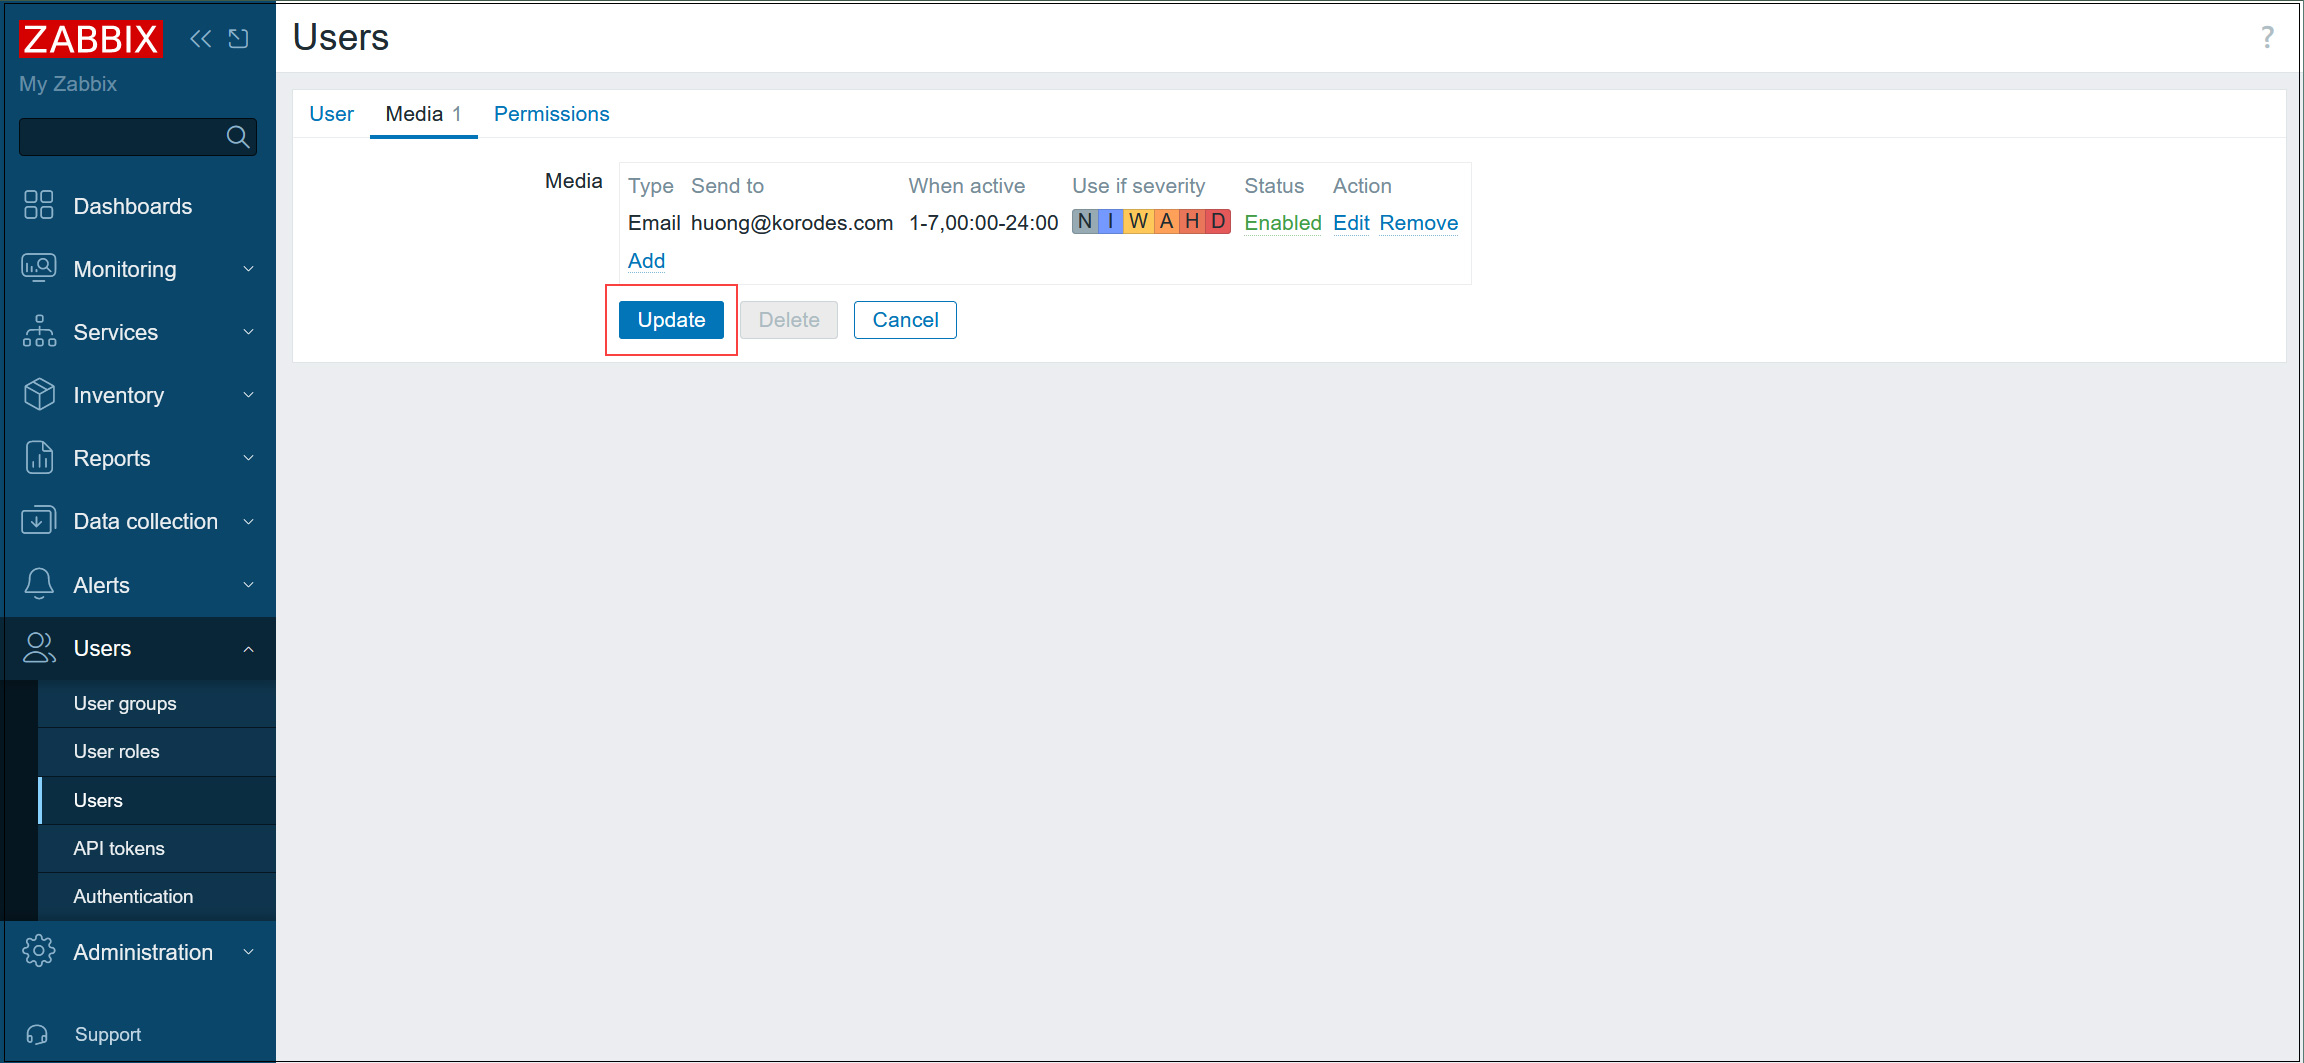
⑤Go to the "Media" tab and click [Add]
⑥Select "Email" for "Type," enter the administrator's email address in the "Send to" field, and click [Add]
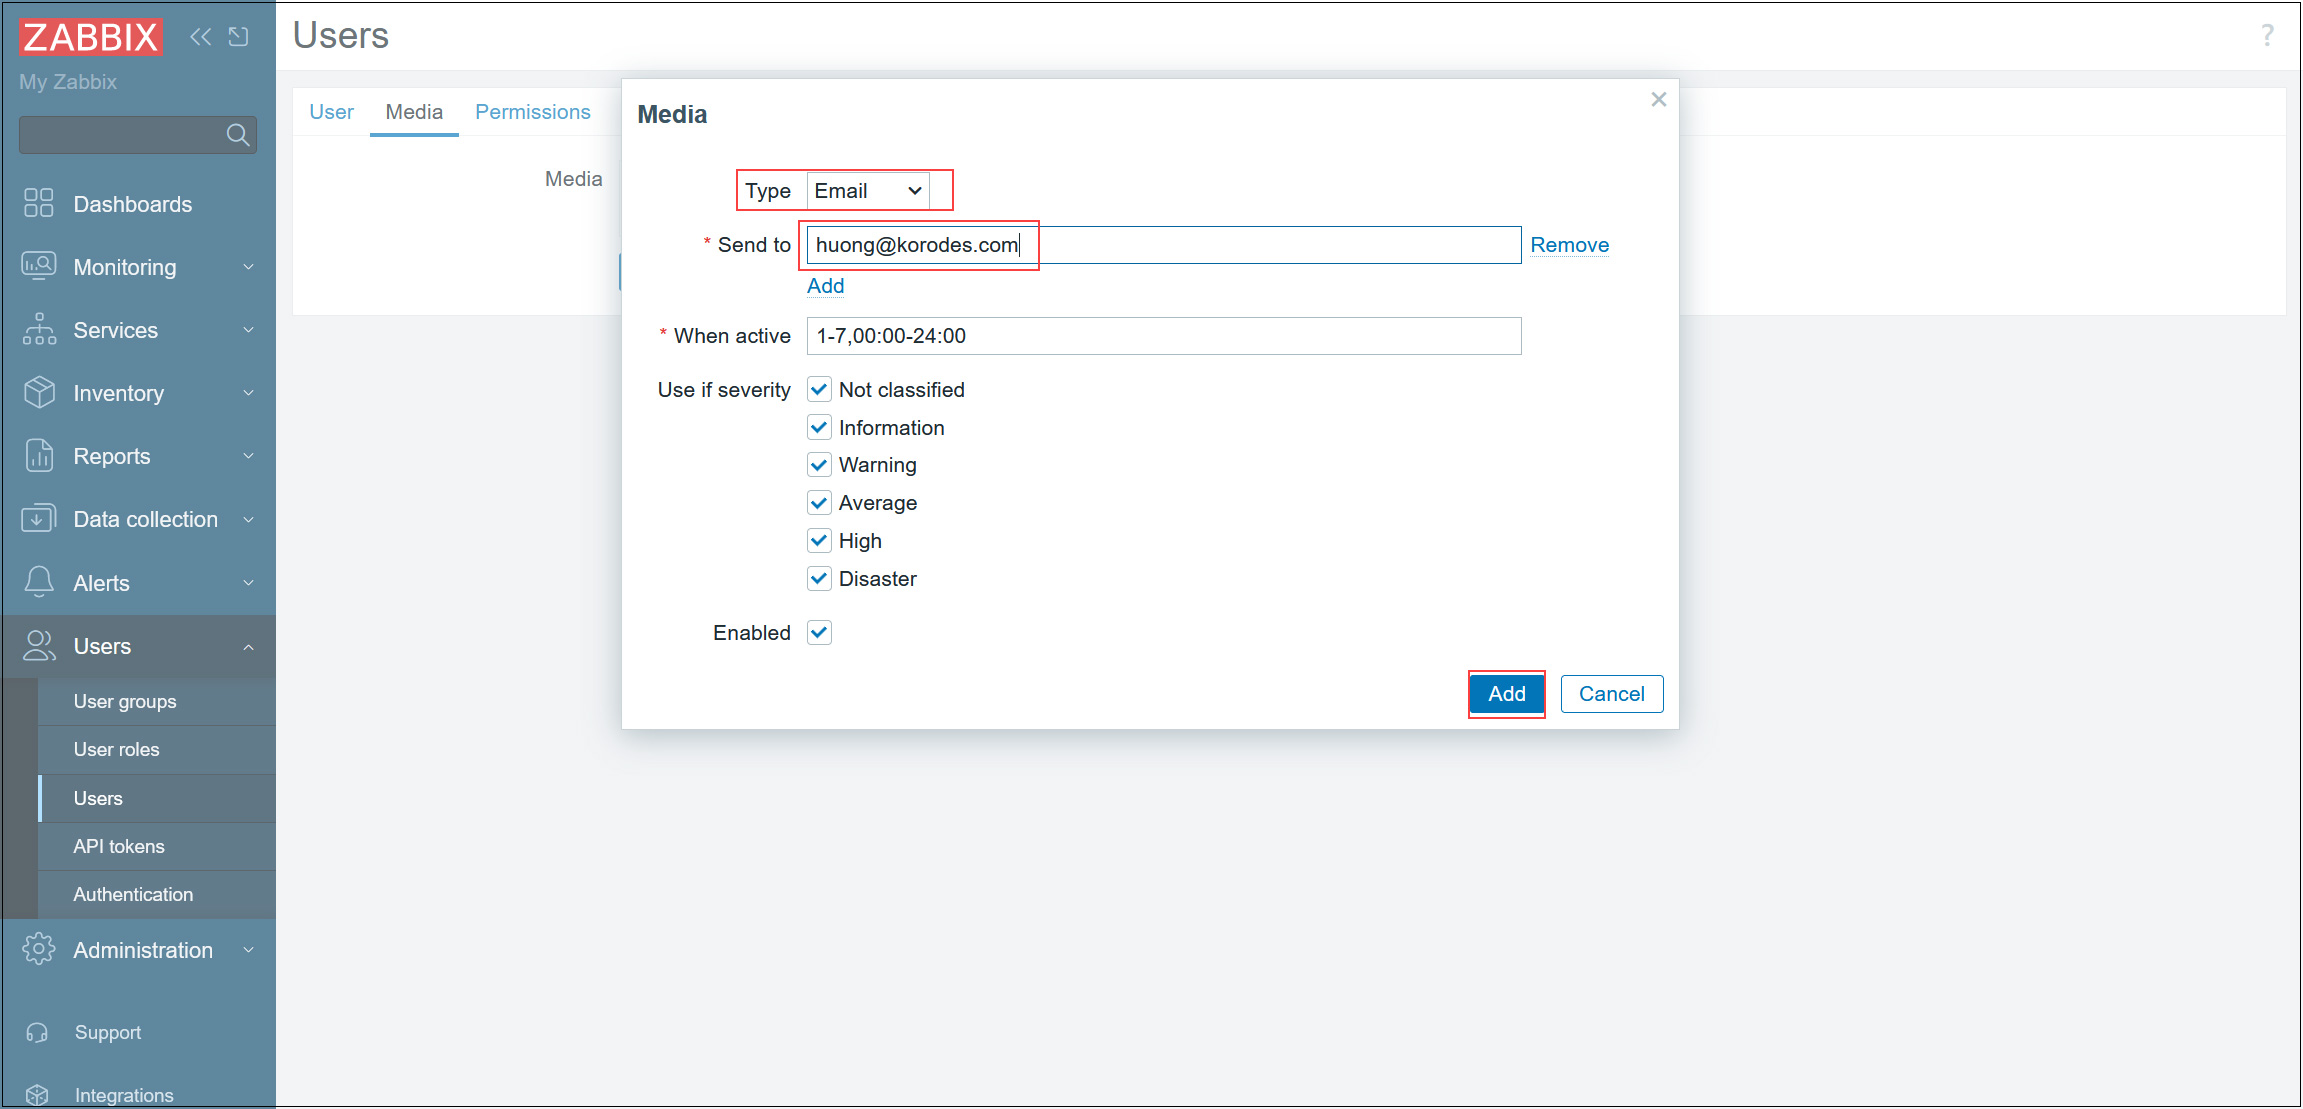
⑦Click the [Update]button.
⑧In the left pane, select [Alerts] - [Actions] - [Trigger actions]
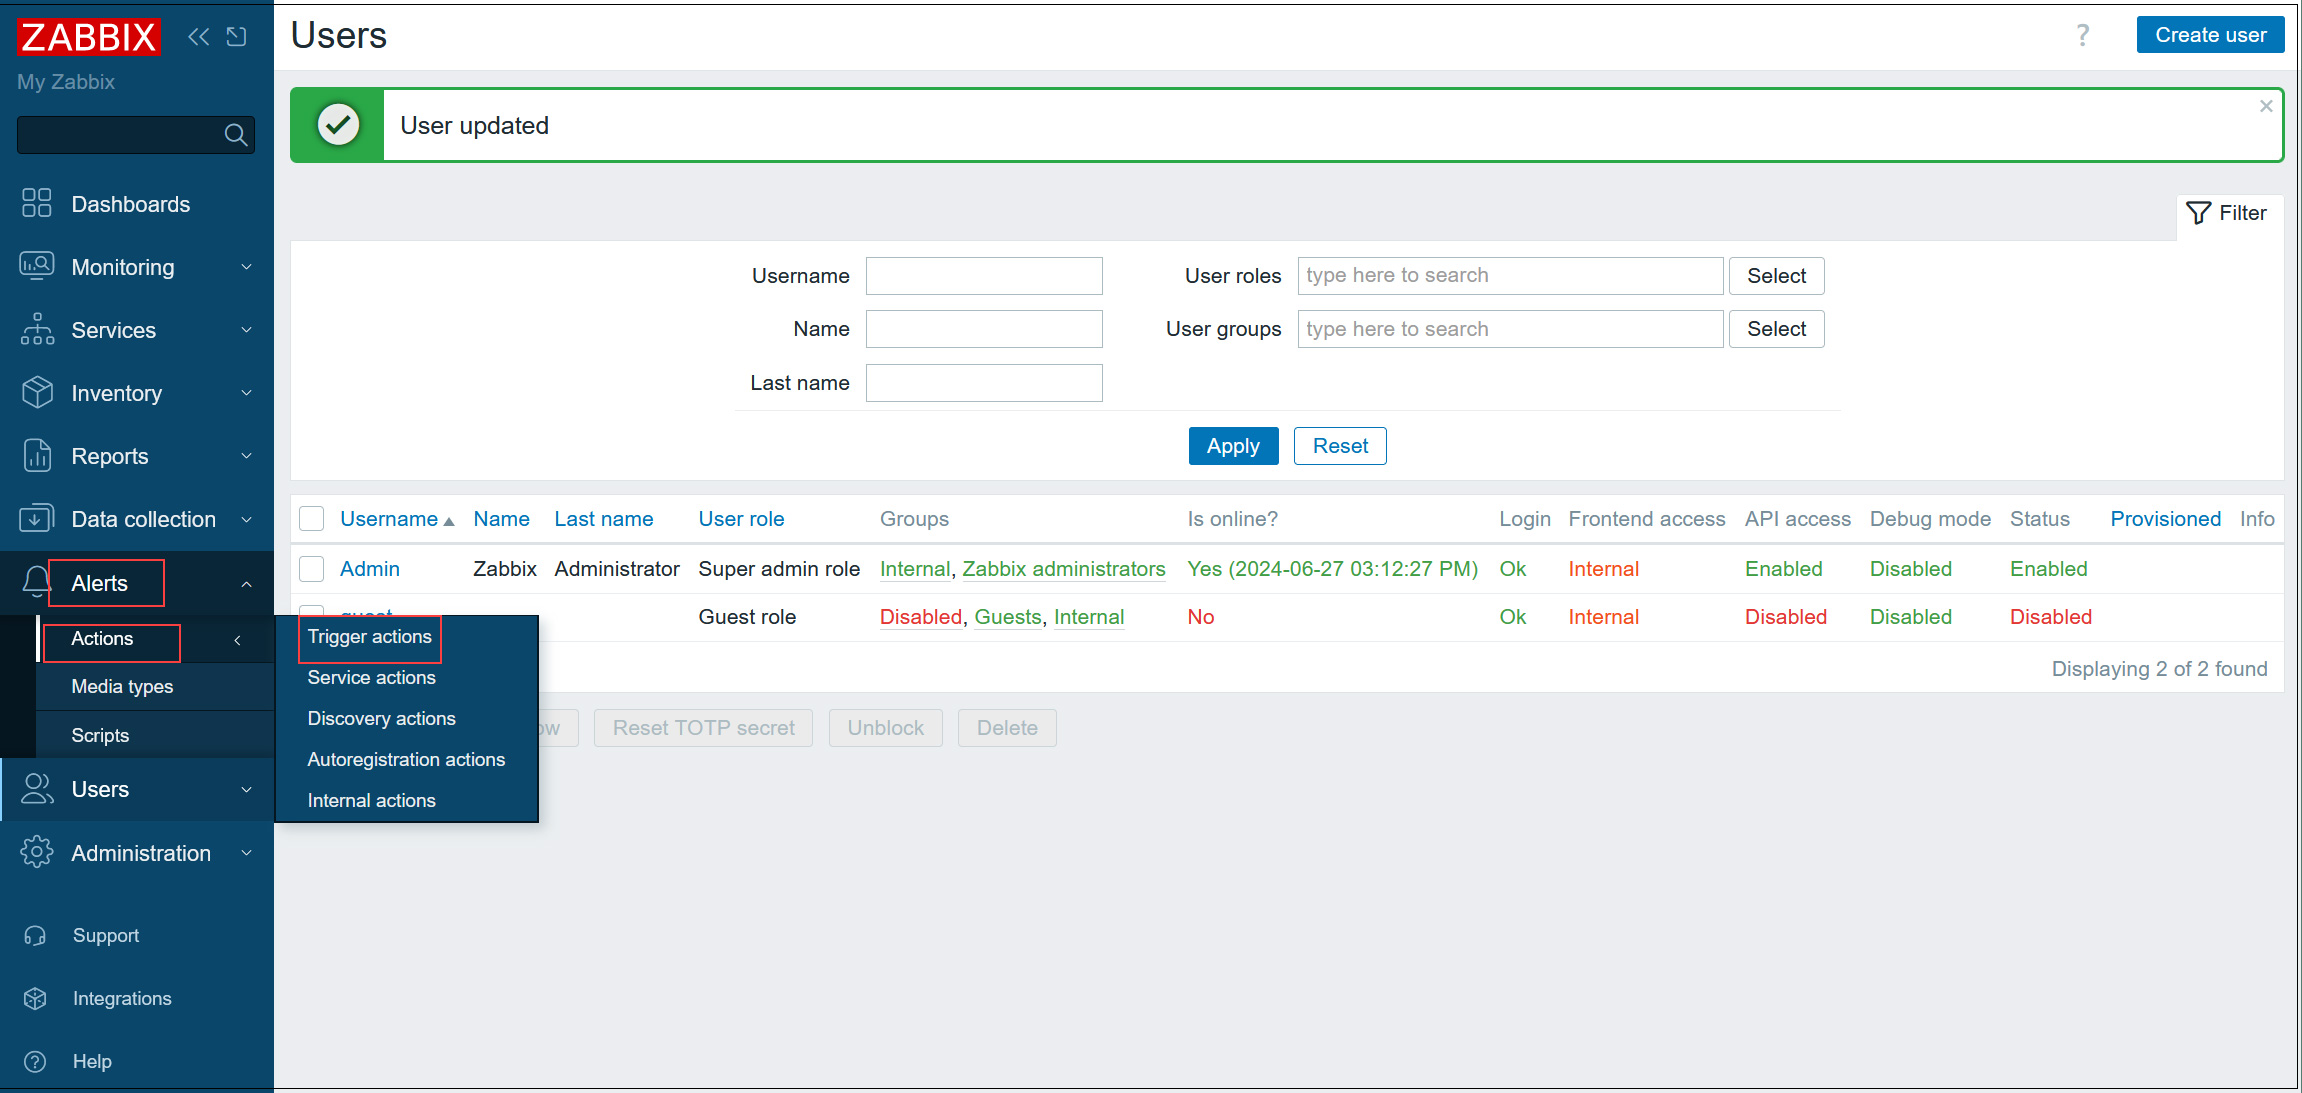
⑨In the right pane, click on [Report problems to Zabbix administrators]
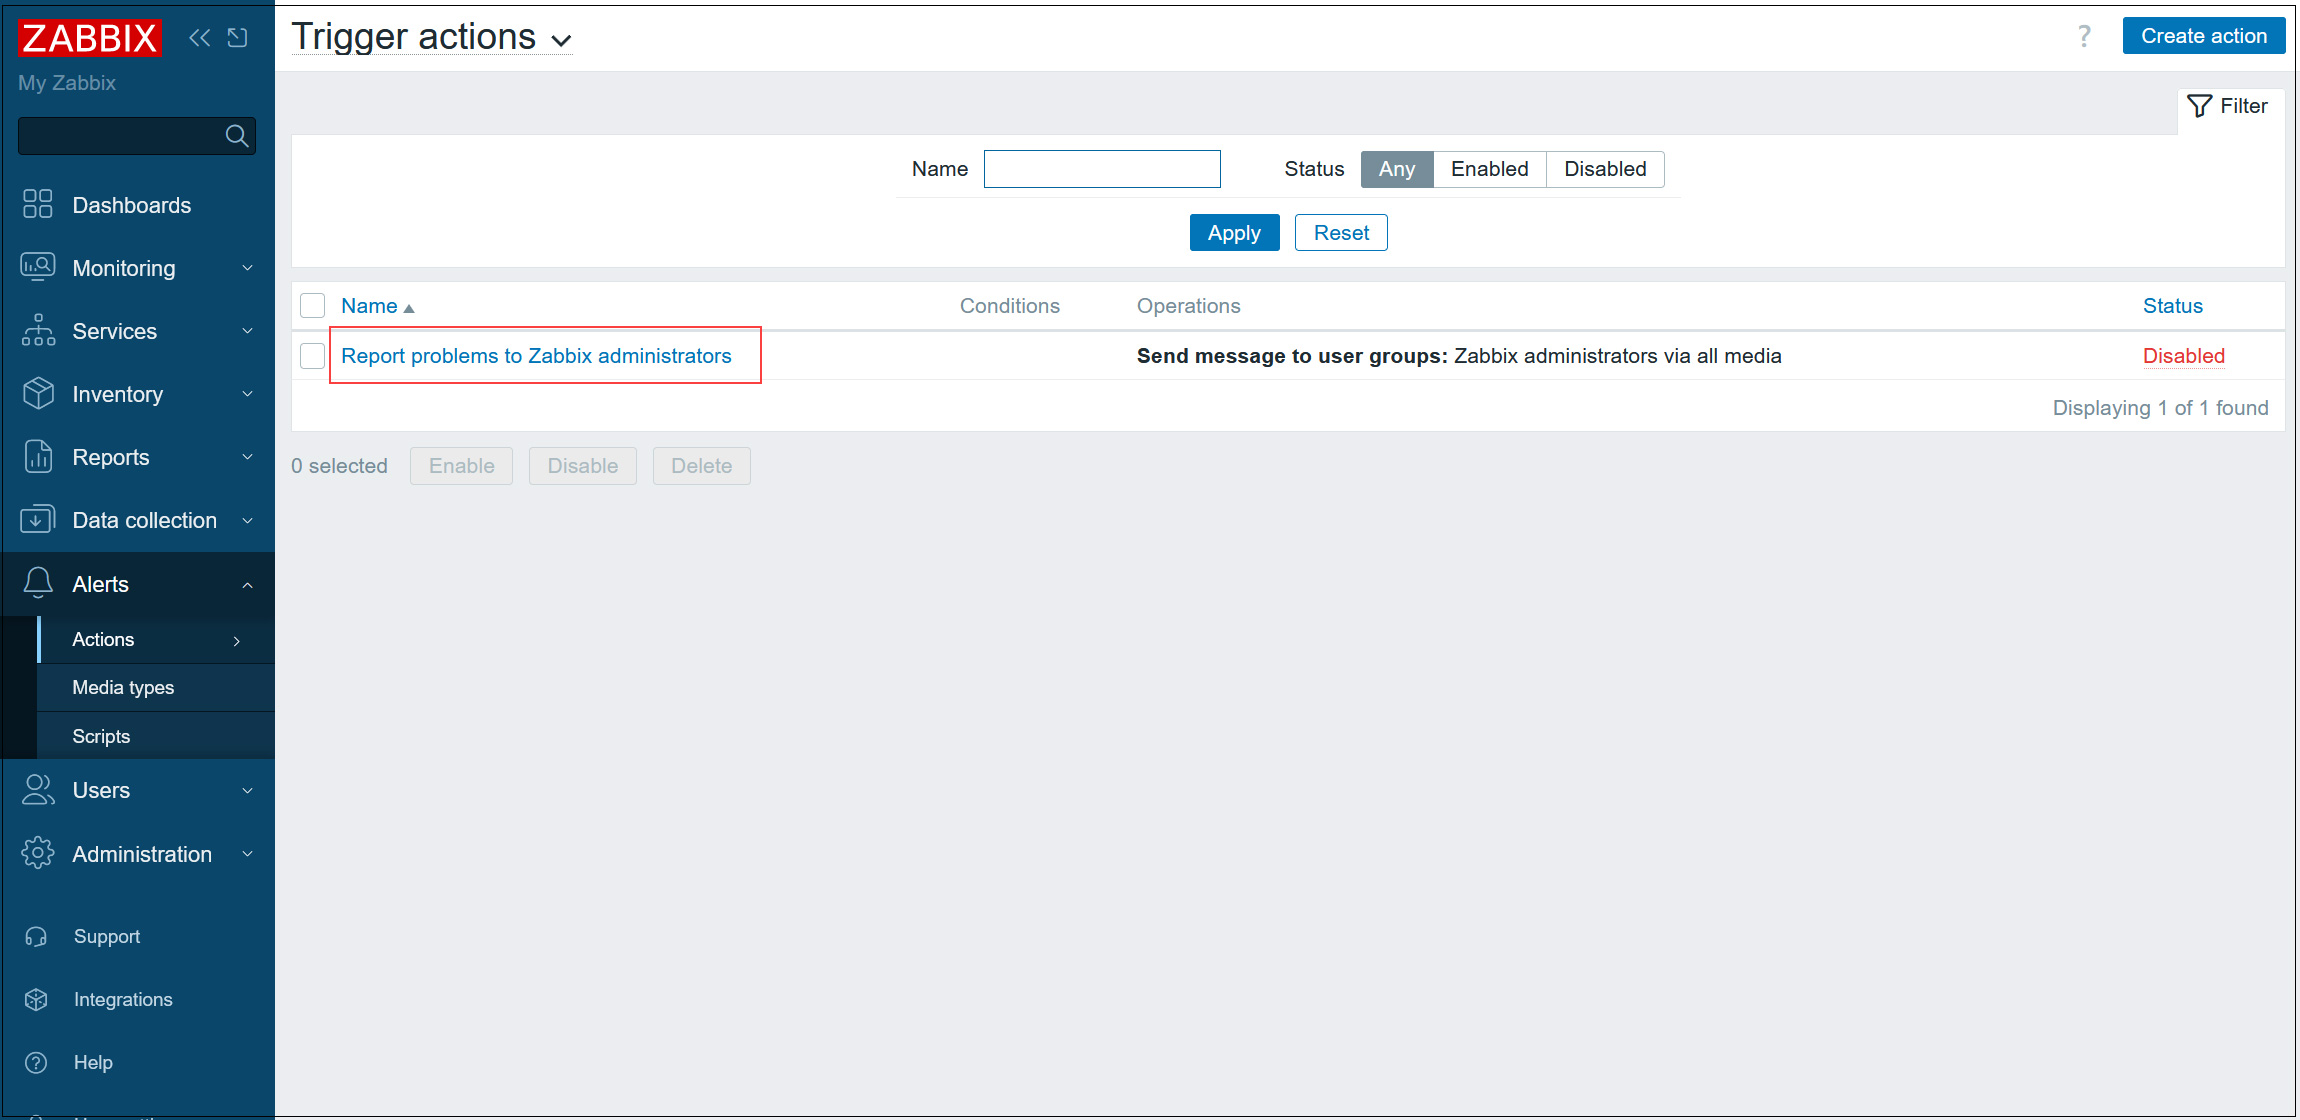
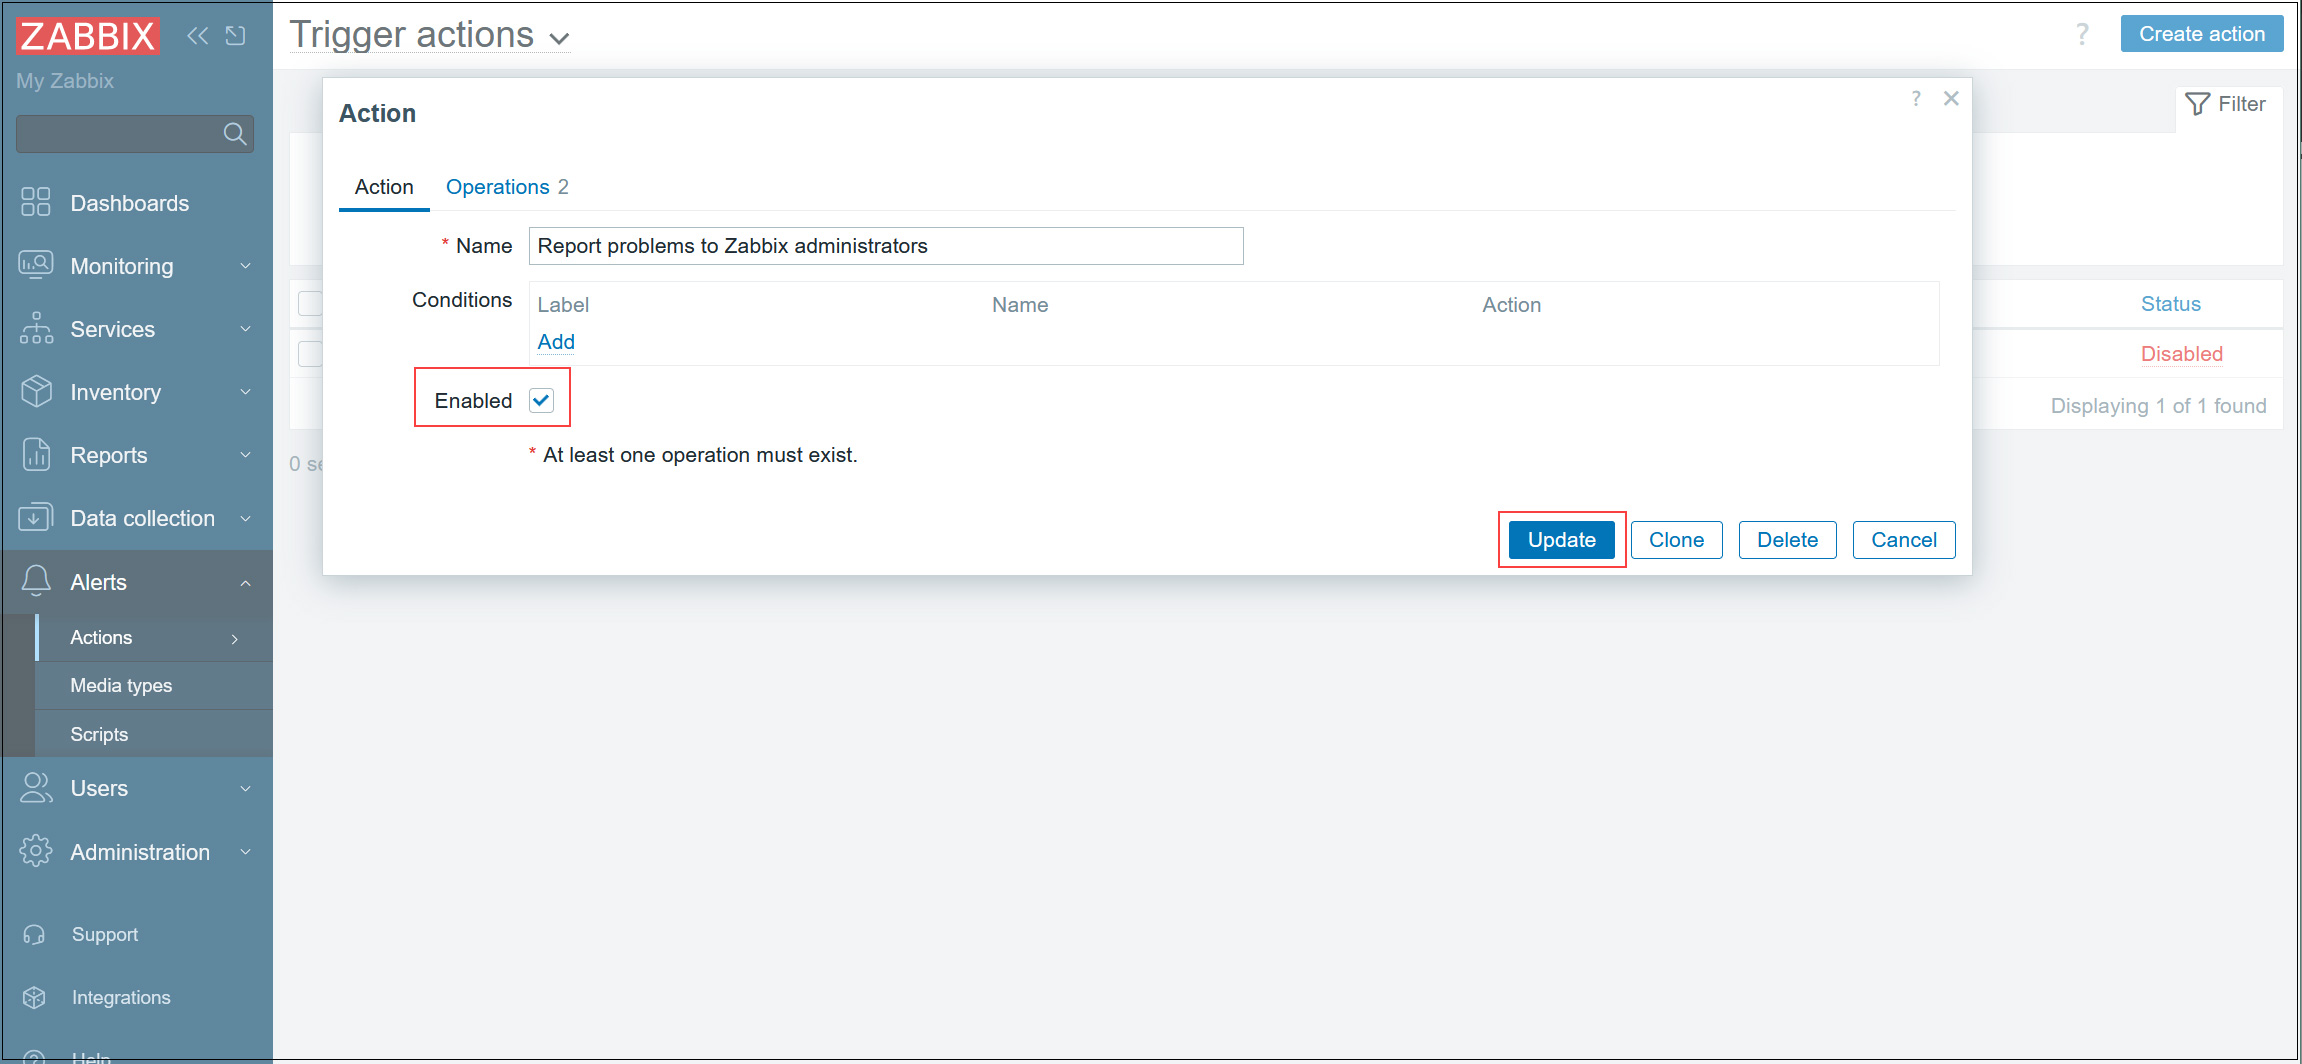
⑩Check [Enabled] and click [Update] button.
Various failure notifications are then sent to the email address you set.
Add monitored hosts
Added the following servers as targets
OS : OracleLinux9.4
IP address : 192.168.11.200
Host name : Lion
1.Configuration on the server you want to monitor
1.1 Disable the Zabbix package provided by EPEL if it is installed. Edit /etc/yum.repos.d/epel.repo and add the following statement
|
1 2 3 |
[epel] ... excludepkgs=zabbix* |
1.2 Install Zabbix Agent on the server you want to monitor
|
1 |
# rpm -Uvh https://repo.zabbix.com/zabbix/7.0/oracle/9/x86_64/zabbix-release-7.0-2.el9.noarch.rpm |
|
1 |
# dnf clean all |
|
1 |
# dnf install zabbix-agent2 zabbix-agent2-plugin-* |
1.3 Edit zabbix-agent configuration file
|
1 2 3 4 5 6 7 8 |
# vi /etc/zabbix/zabbix_agent2.conf # Line 80 : Specify Zabbix server (in this case 192.168.11.83) Server=192.168.11.83 # Line 133 : Specify Zabbix server (in this case 192.168.11.83) ServerActive=192.168.11.83 # Line 144 : Change to your own host name (Lion in this case) Hostname=Lion |
|
1 2 |
# systemctl restart zabbix-agent2 # systemctl enable zabbix-agent2 |
1.4 Configure firewall on Zabbix-agent side
Zabbix ports 10050 (on Zabbix server side) and 10051 (on zabbix agent side) must be allowed.
|
1 2 3 |
# firewall-cmd --add-port=10050/tcp --permanent # firewall-cmd --add-port=10051/tcp --permanent # firewall-cmd --reload |
2. Configuration in Zabbix WEB UI
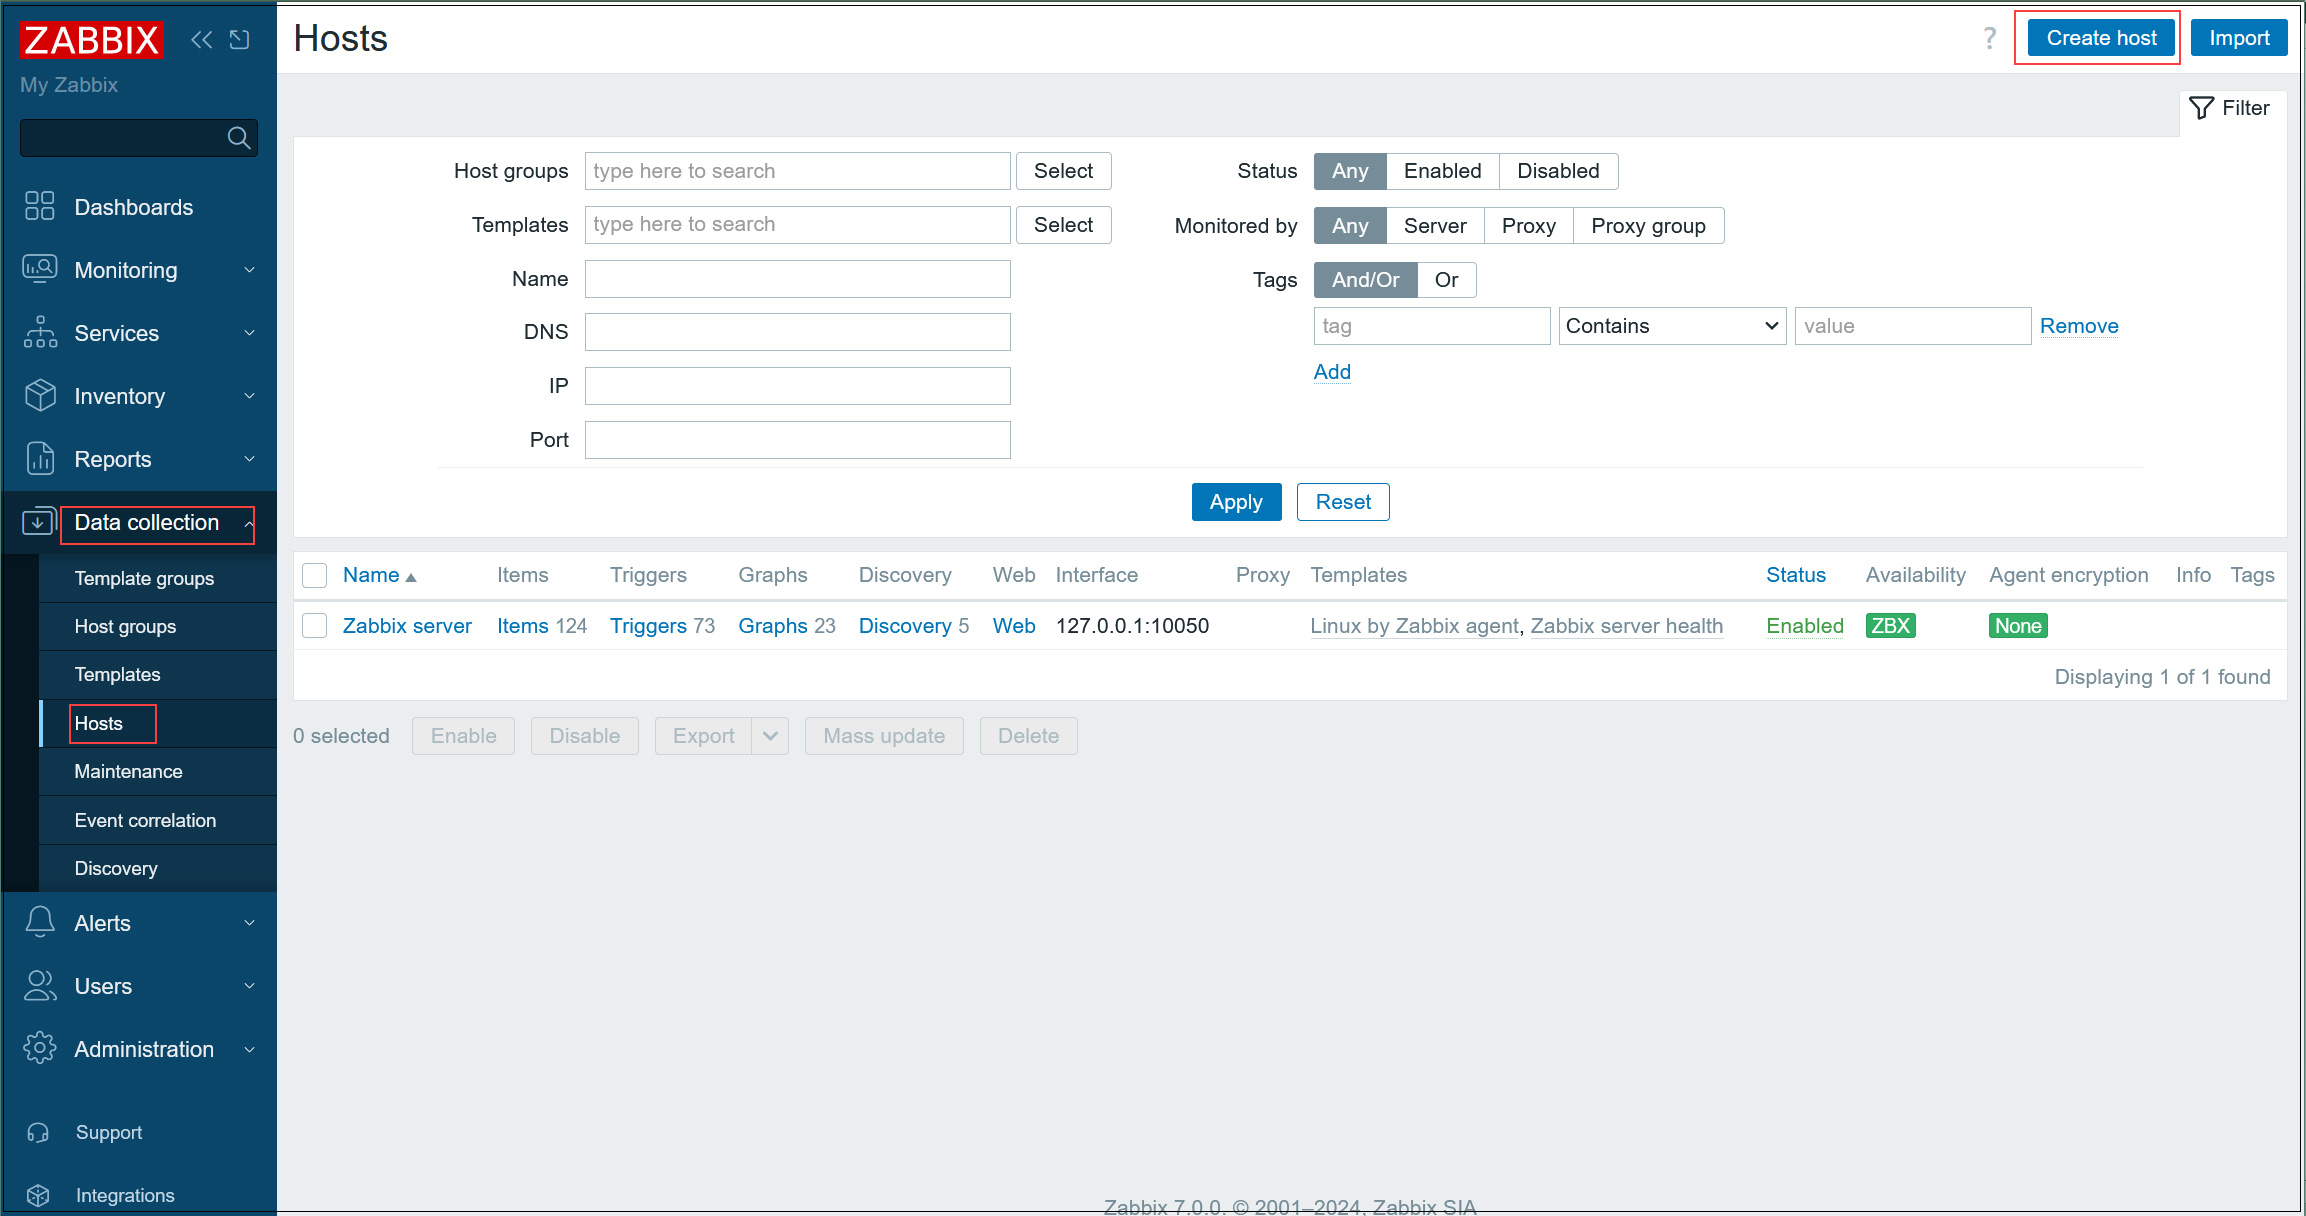
2.1 Log in to the Zabbix administration site, select [Datacollection] - [Hosts] in the left pane and click the [Create Host] button at the top of the right pane.
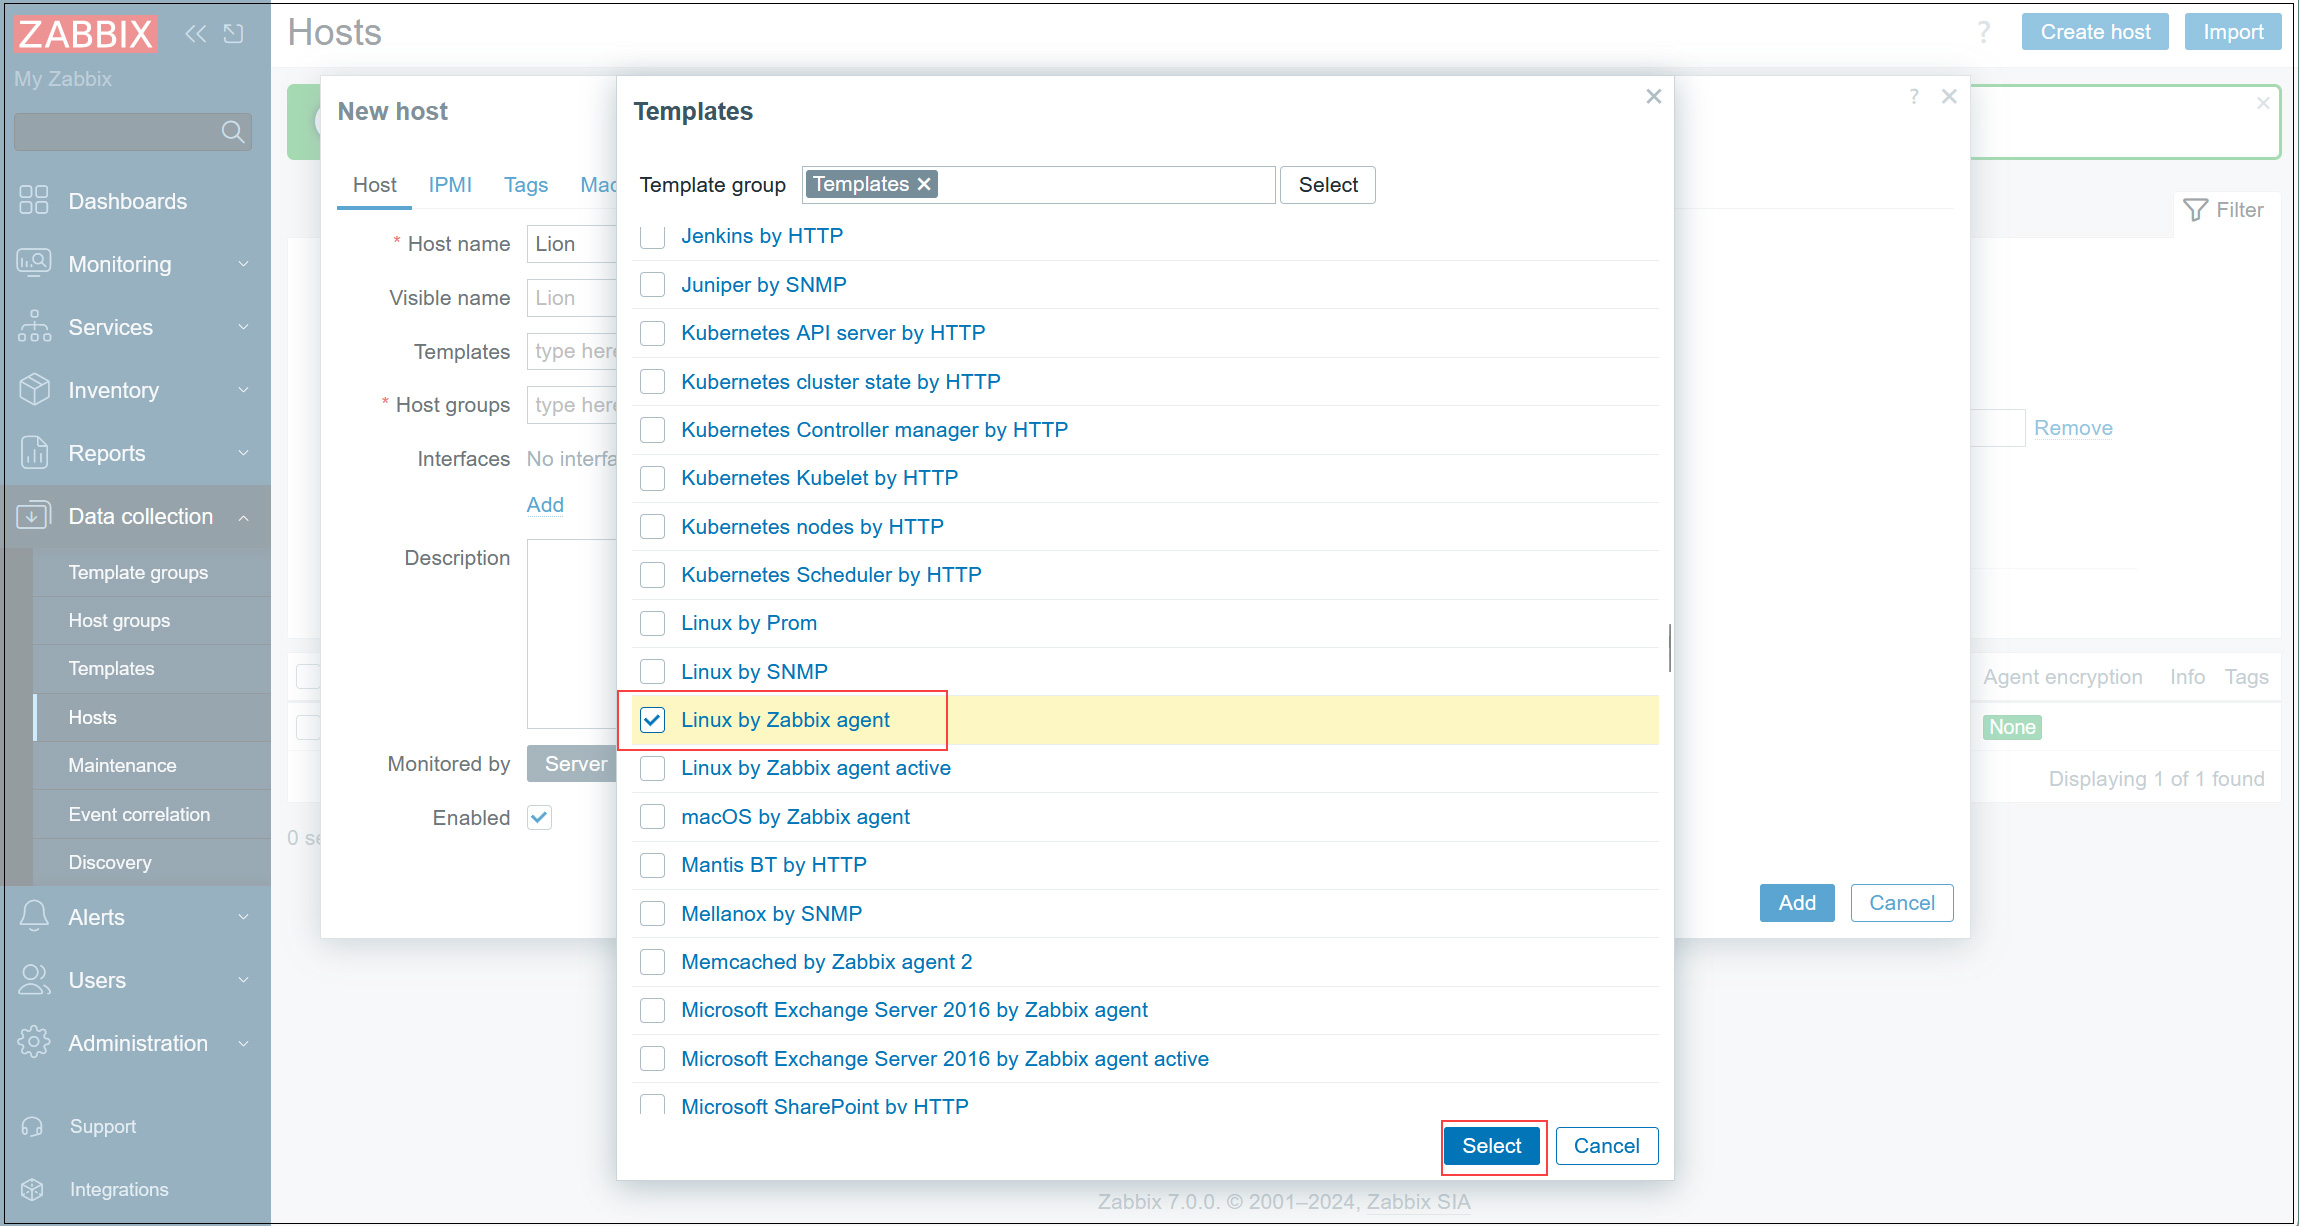
2.2 Enter a hostname in the [Hostname] field (in this case, Lion).
For [Templates], click on the [Select] button and select [Linux by Zabbix agent] from the list of monitoring templates if you want to monitor common items such as CPU on Linux OS.
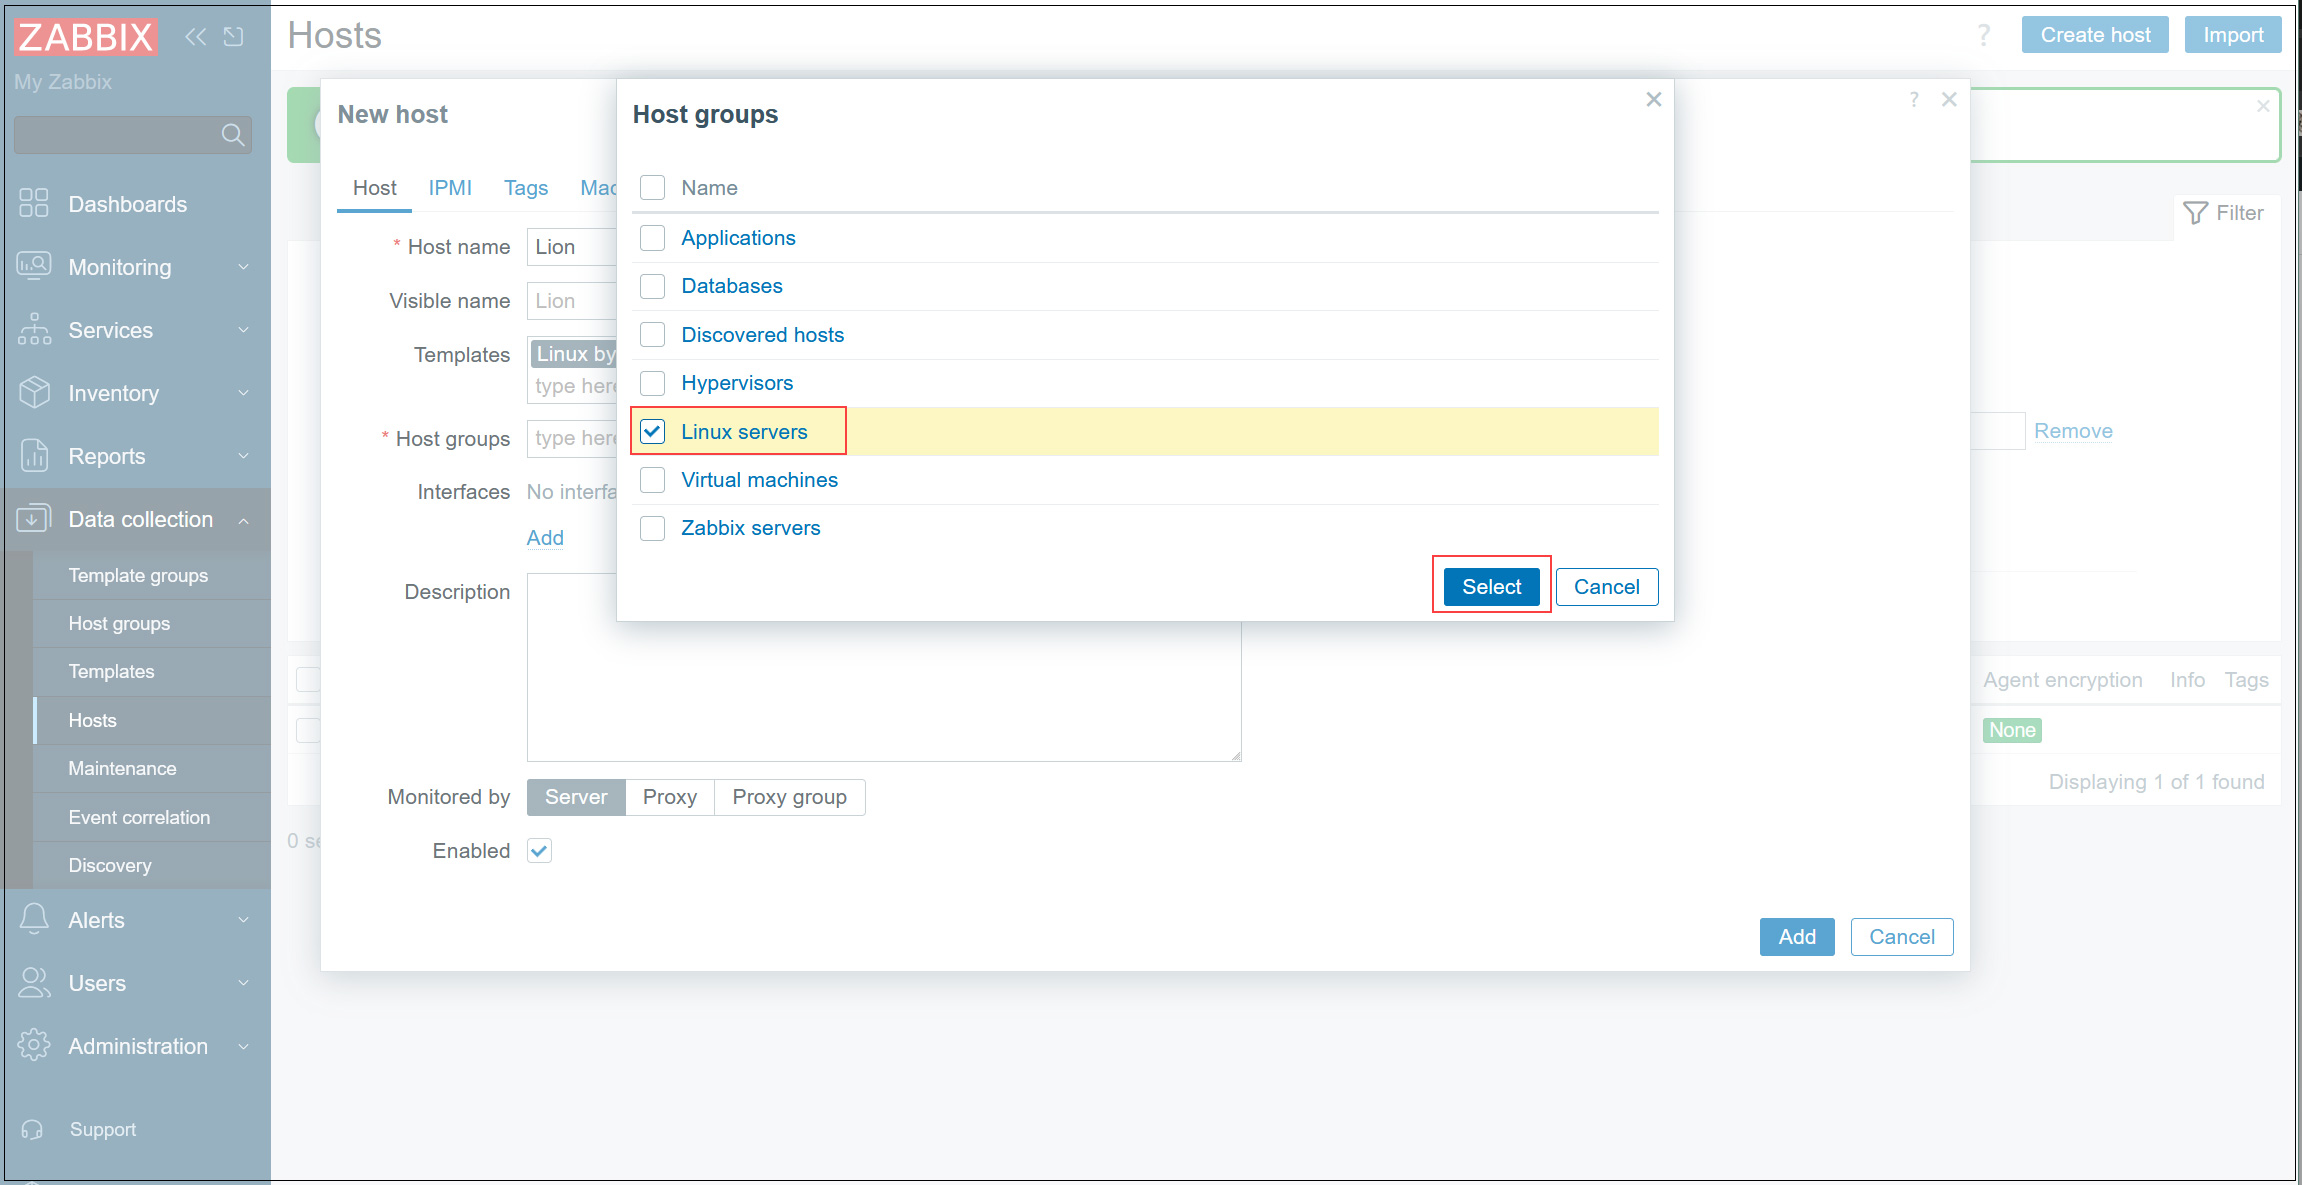
2.3 Select [Linux servers] for [Host groups]
2.4 In [Interfaces], click [Add] under Interfaces, enter the IP address to be monitored, and then click [Add] at the bottom.
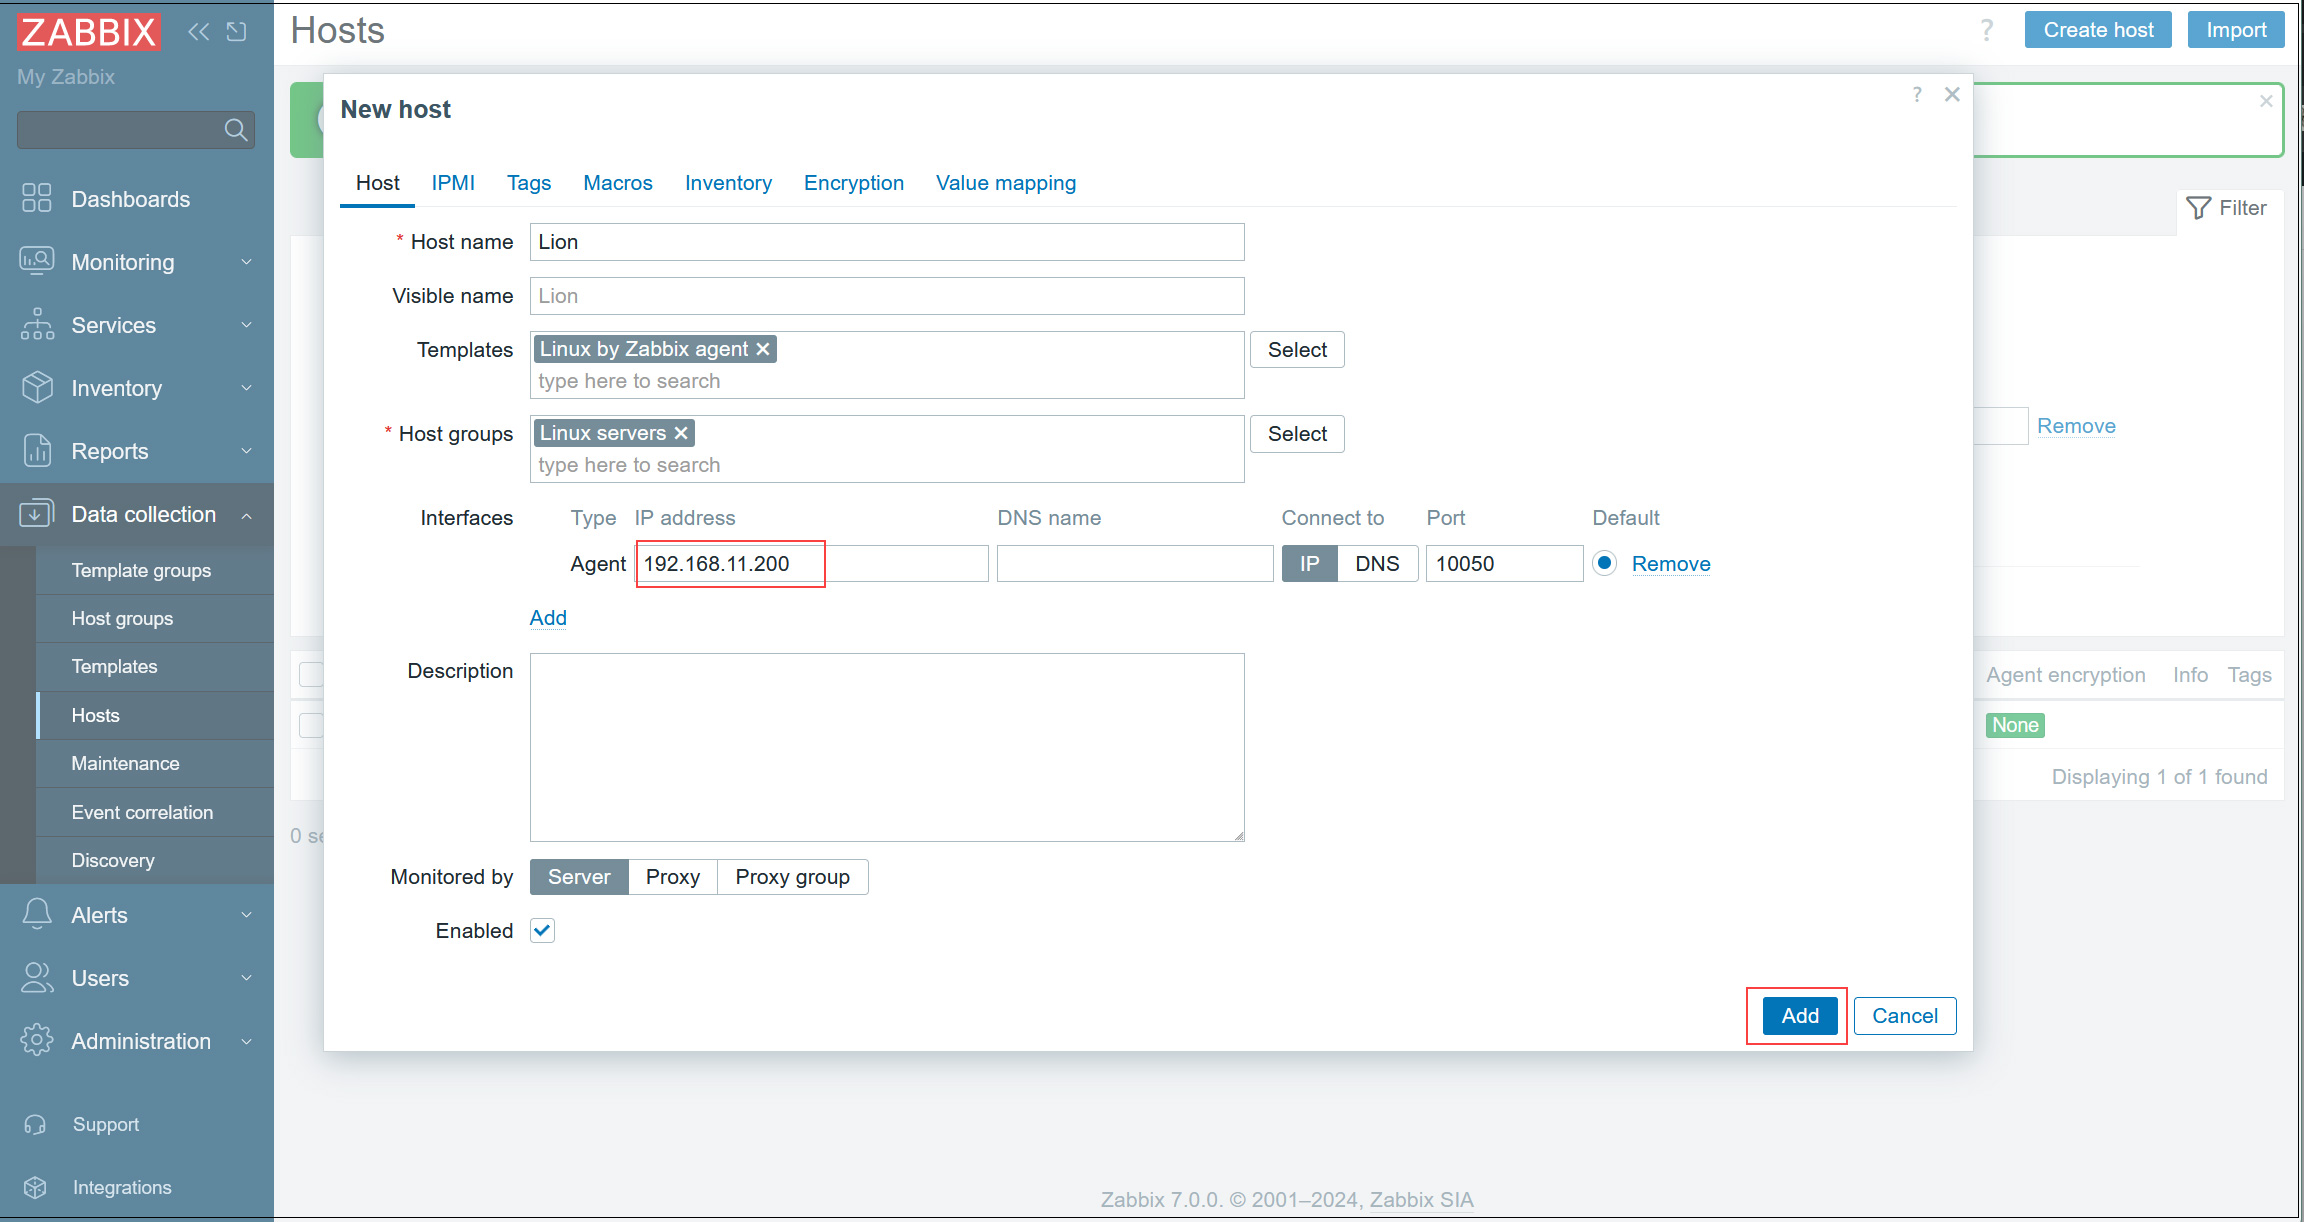
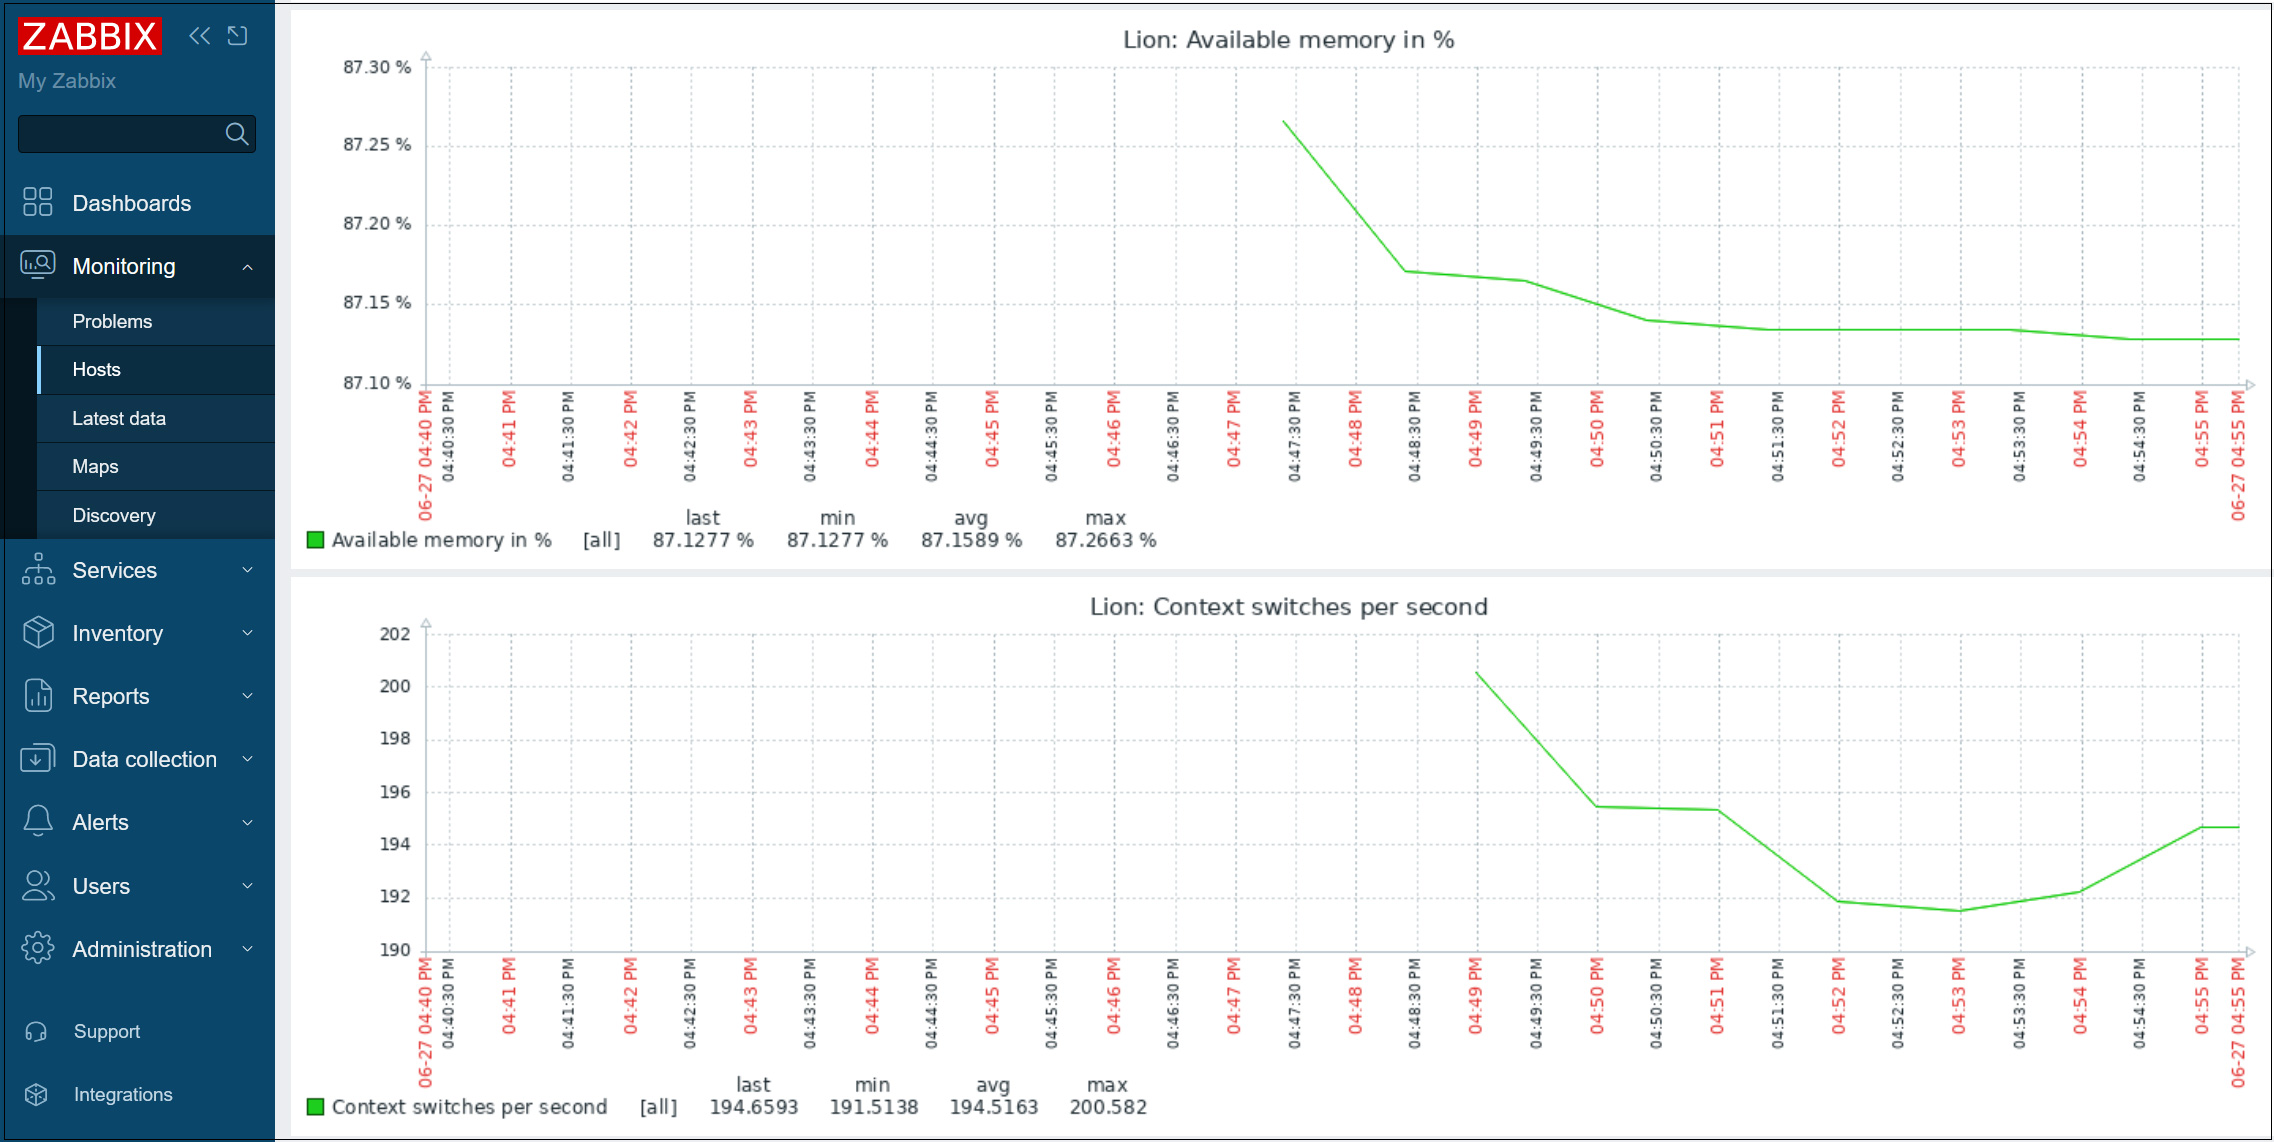
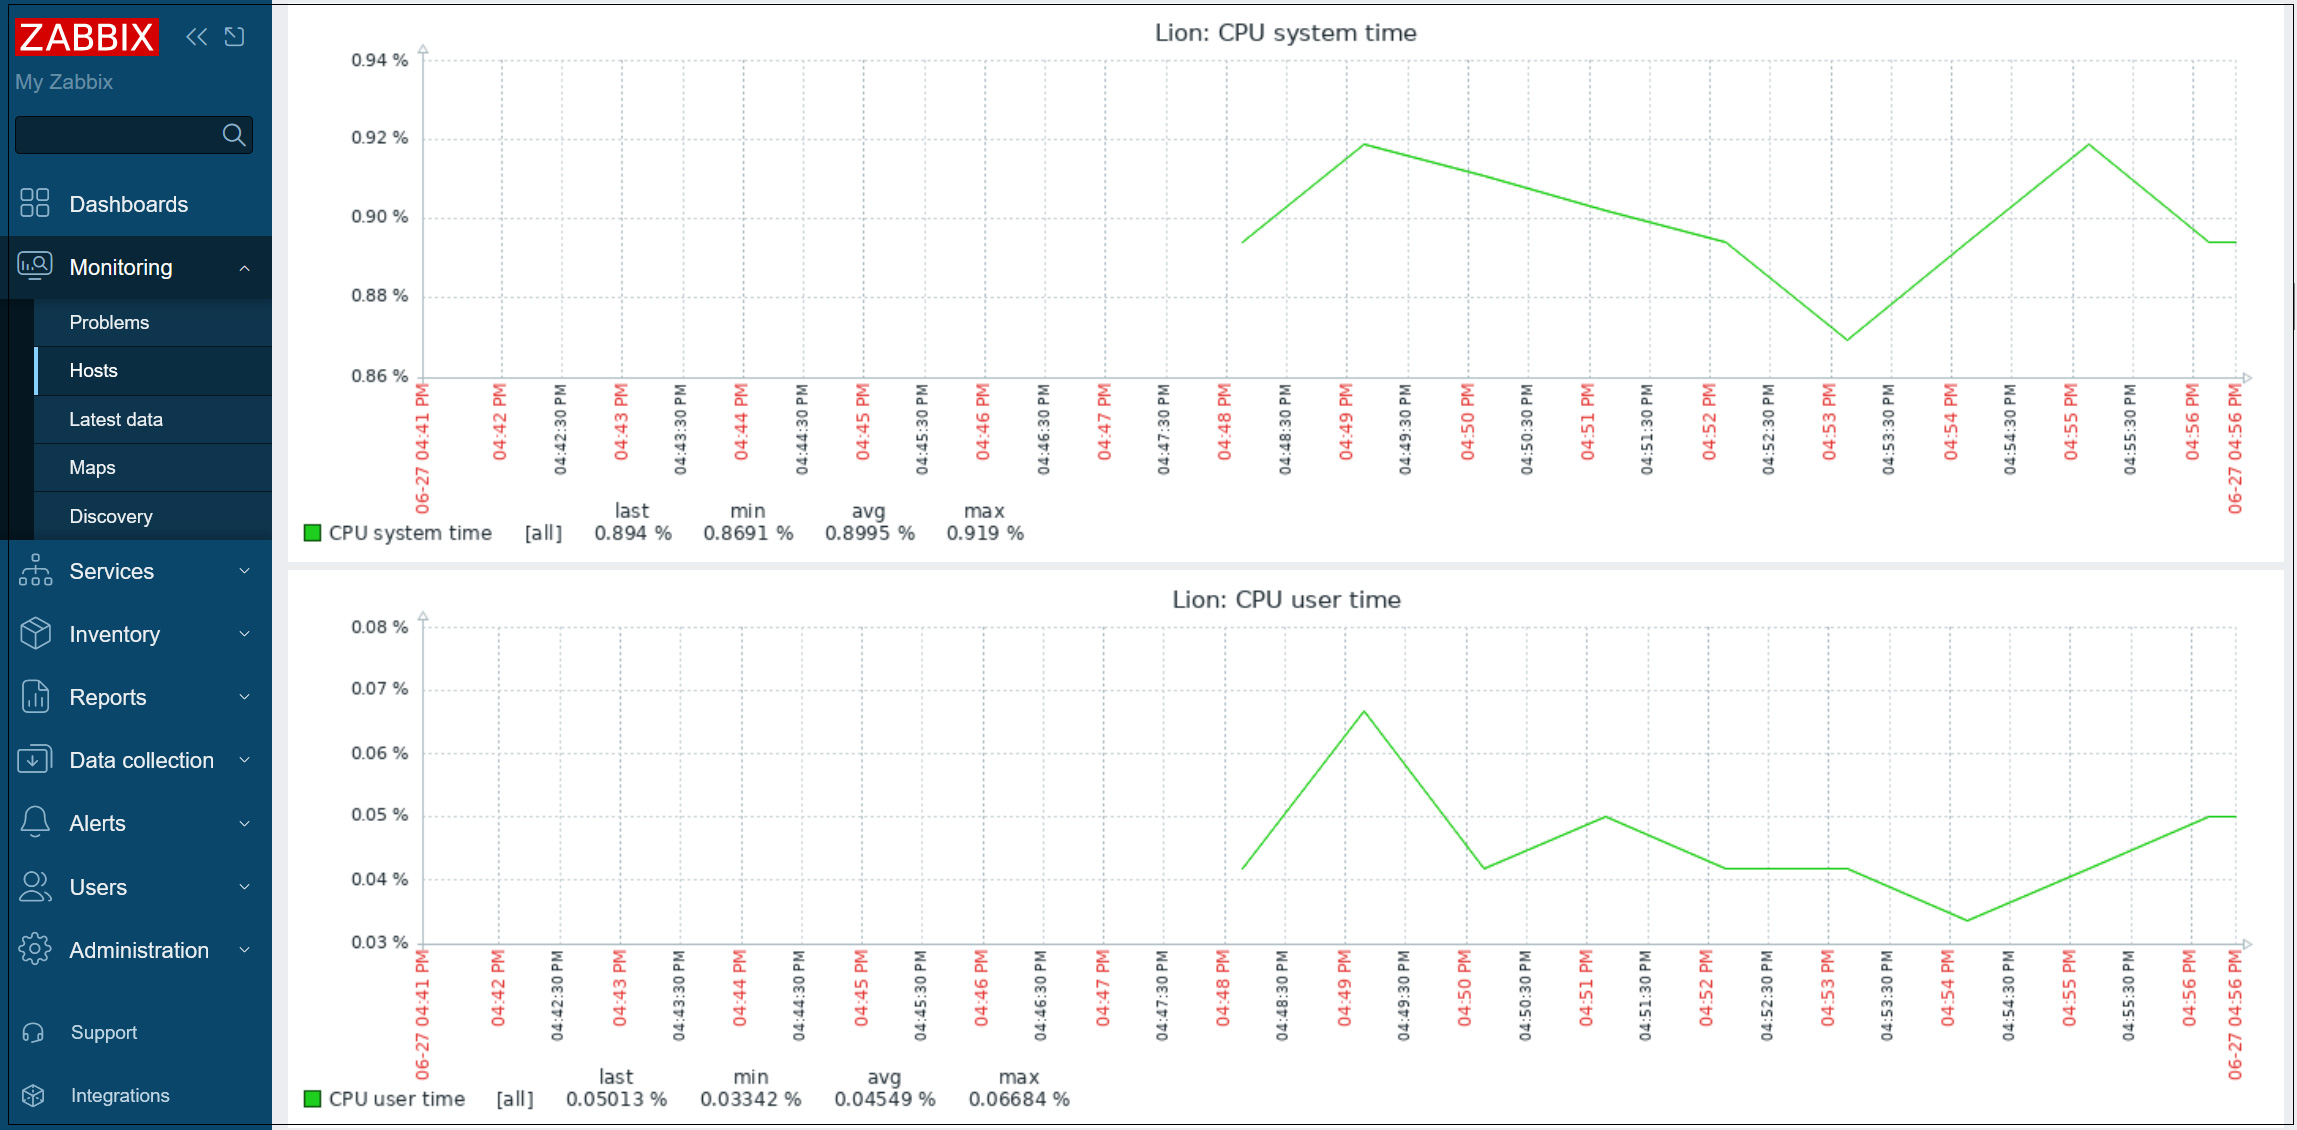
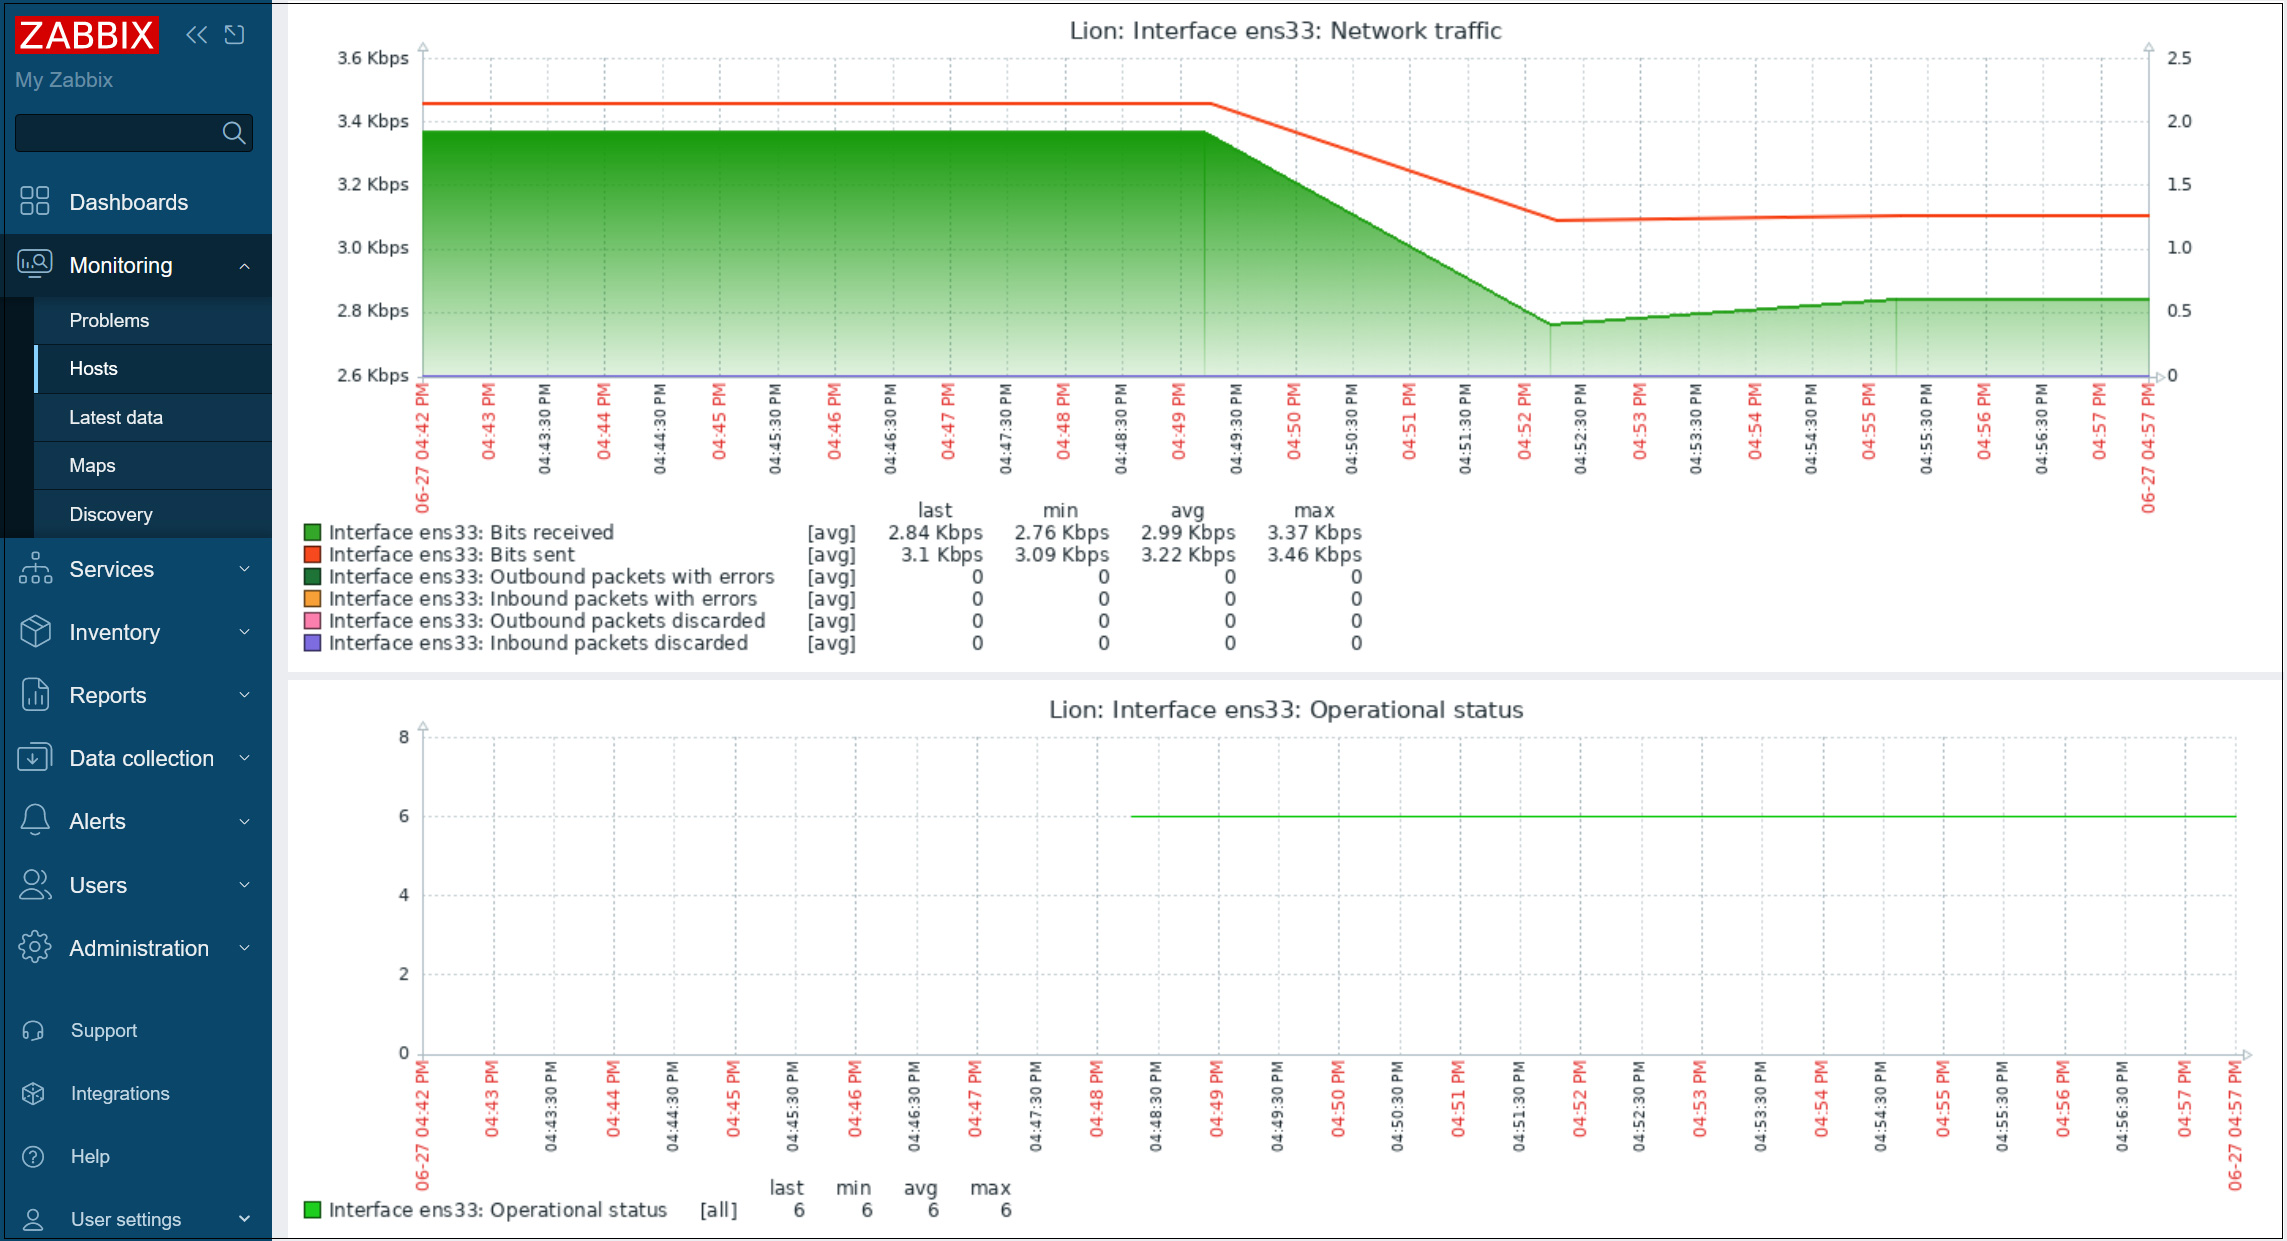
2.5 New monitored servers are registered.
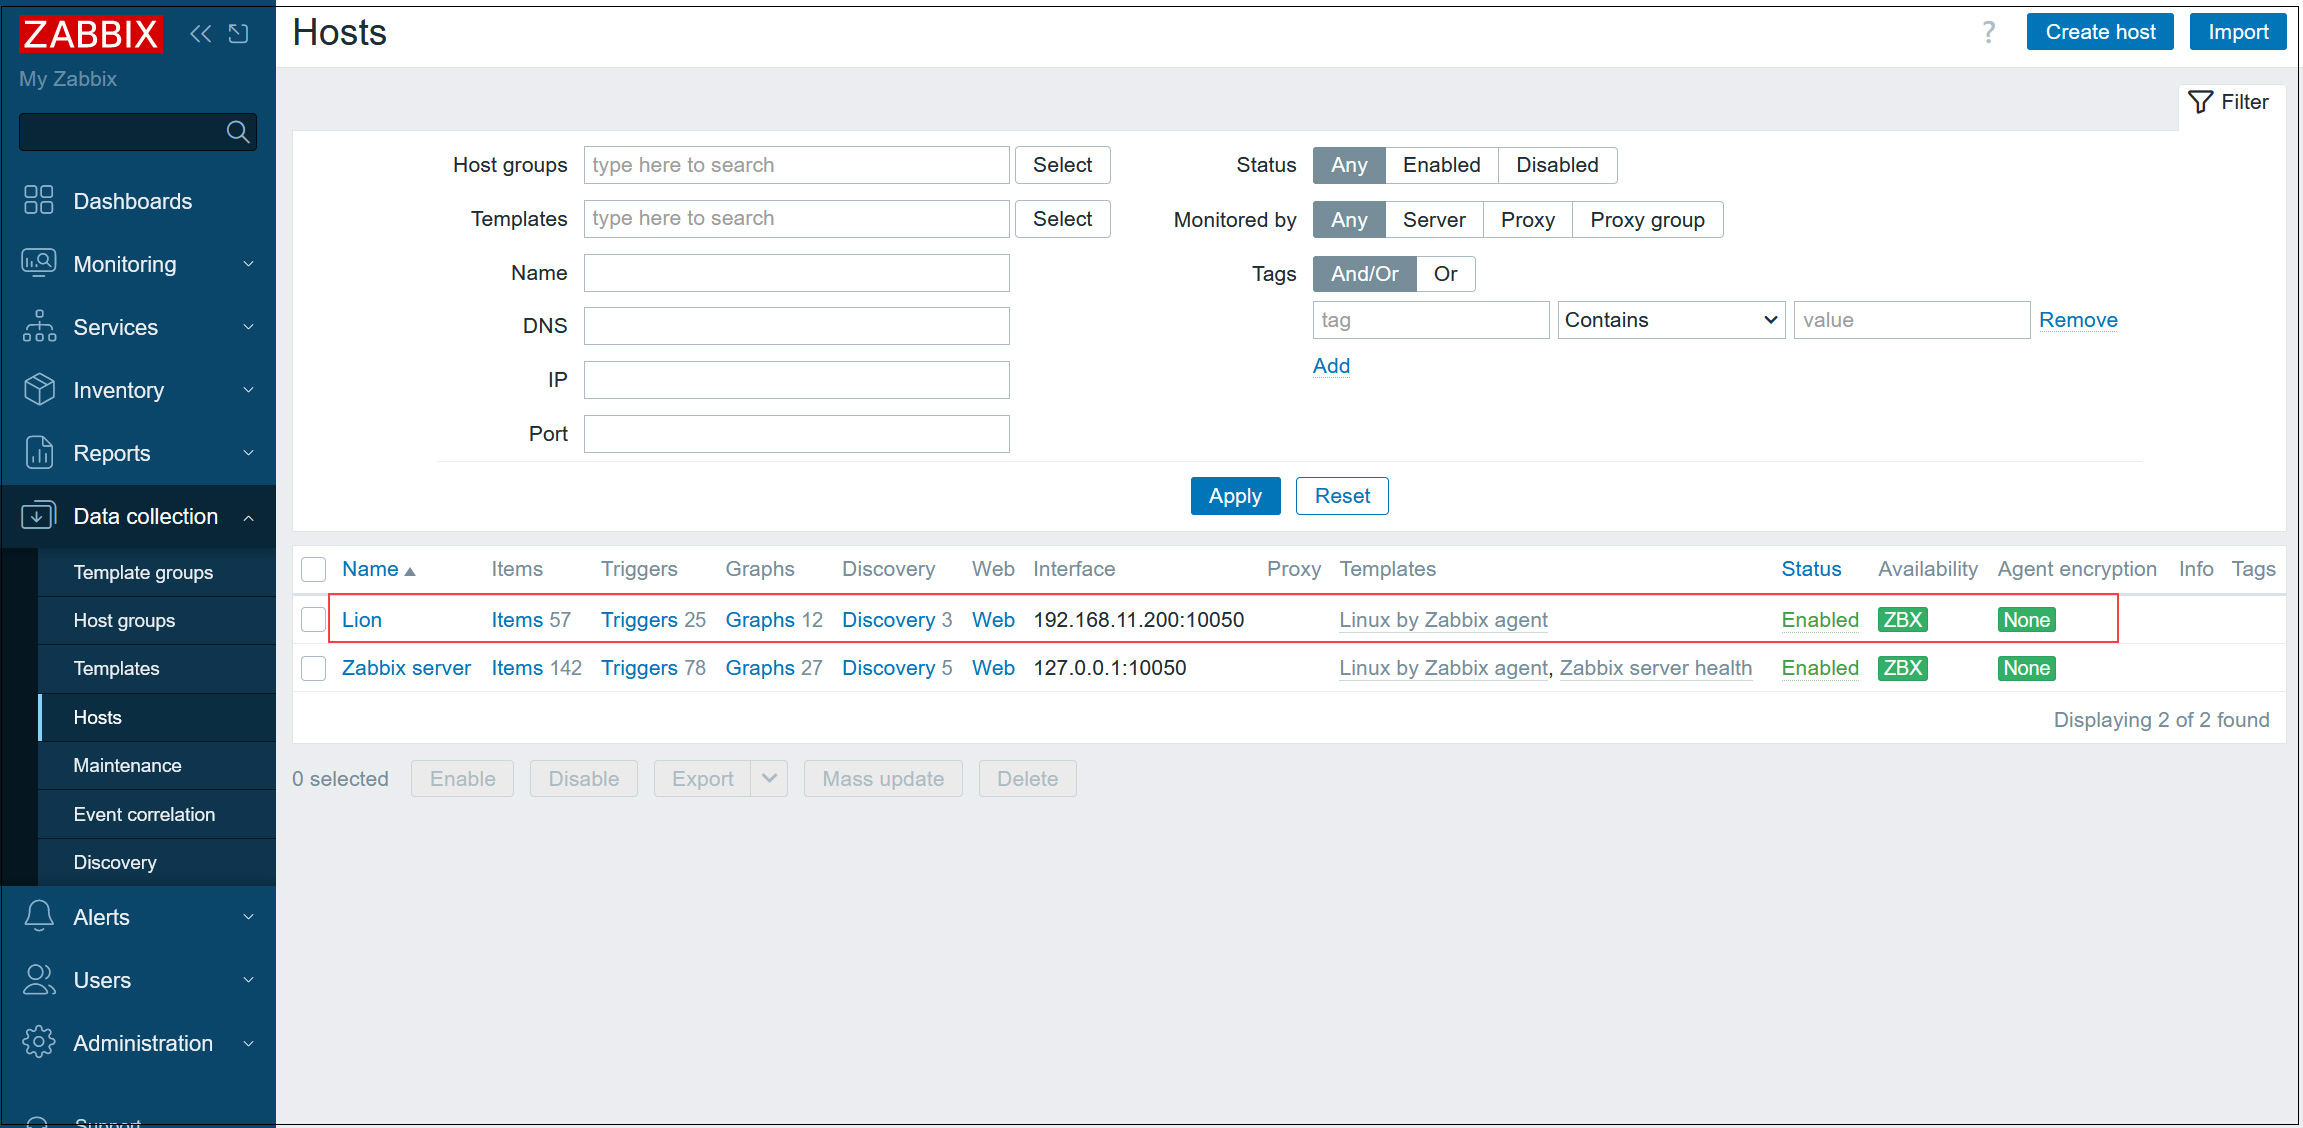
After a while, the data of the added target hosts will be displayed.
Add items to be monitored
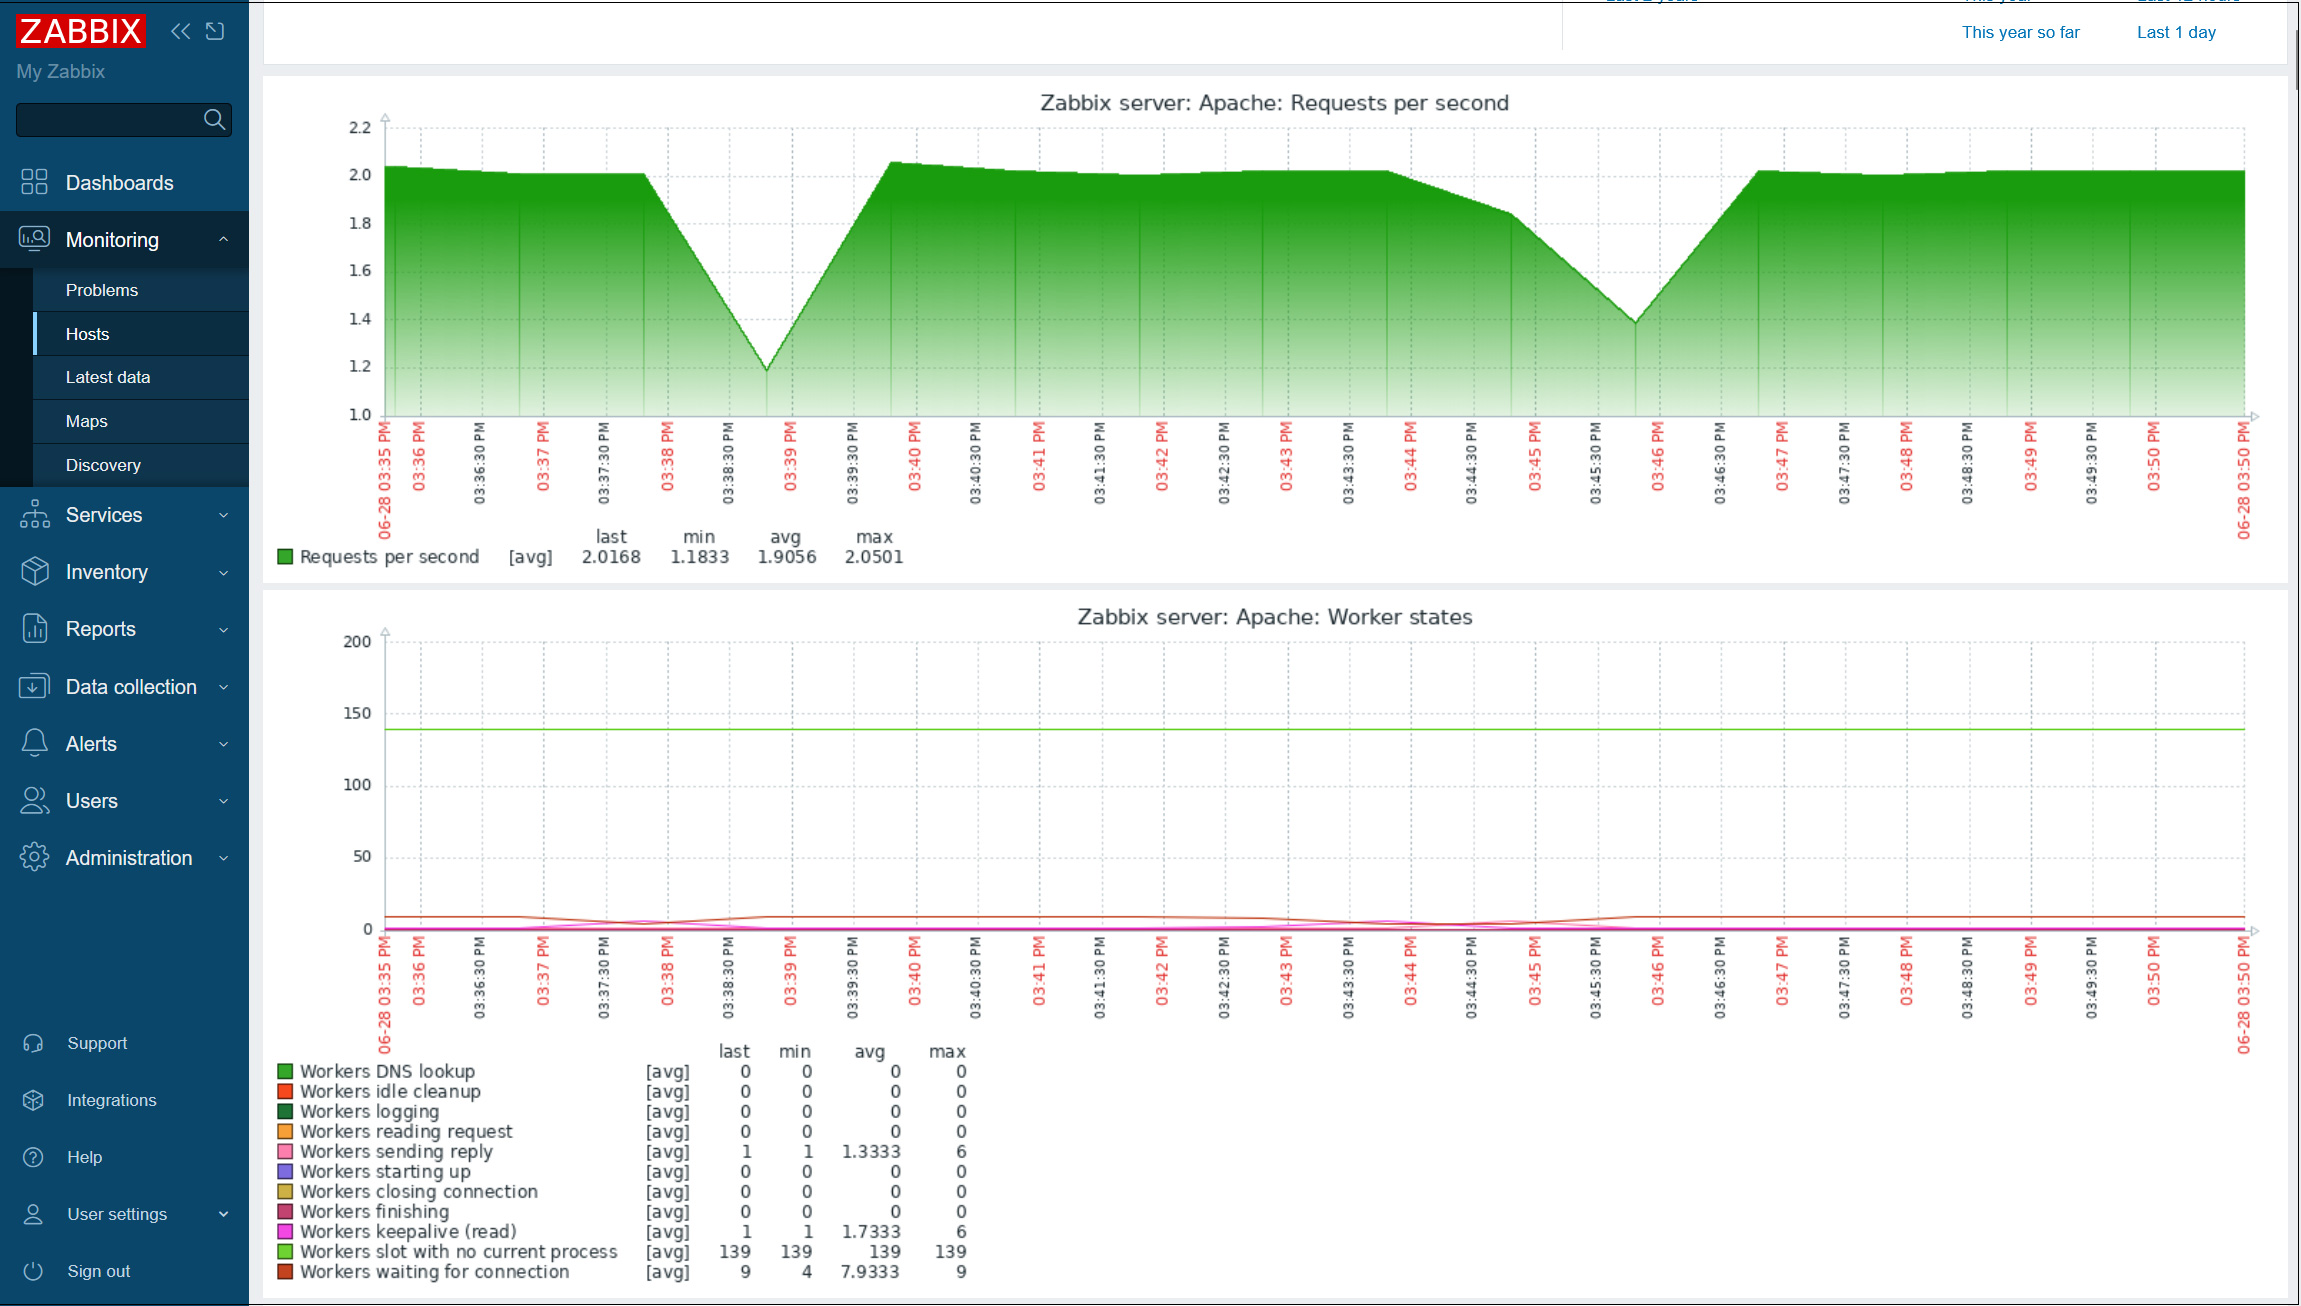
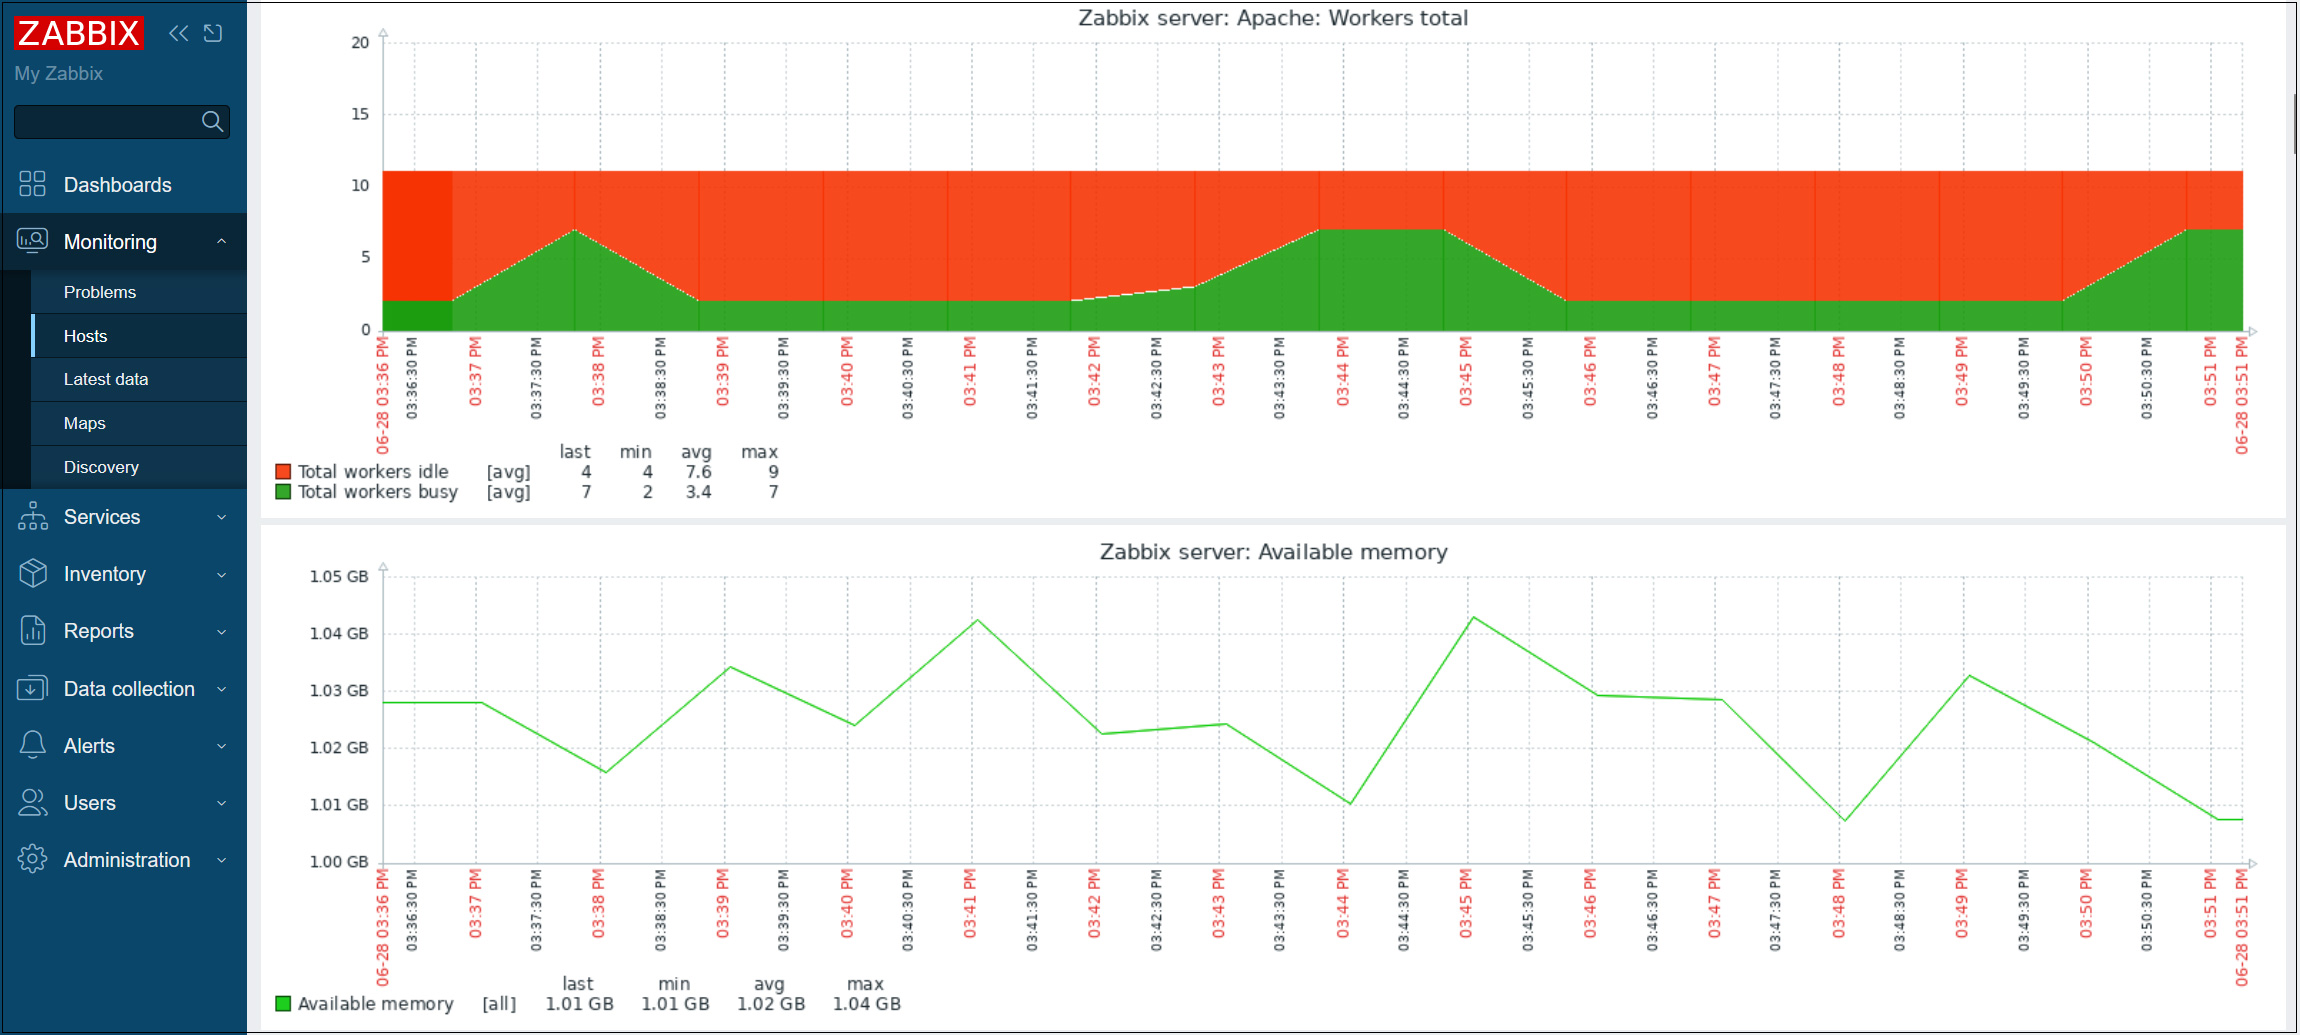
This time we will add Apache httpd service on Zabbix server to be monitored
1. Enable server-status in Apache httpd on monitored Zabbix server
|
1 2 3 4 5 6 7 |
Create New # vi /etc/httpd/conf.d/server-status.conf <Location /server-status> SetHandler server-status Require local </Location> |
|
1 |
# systemctl reload httpd |
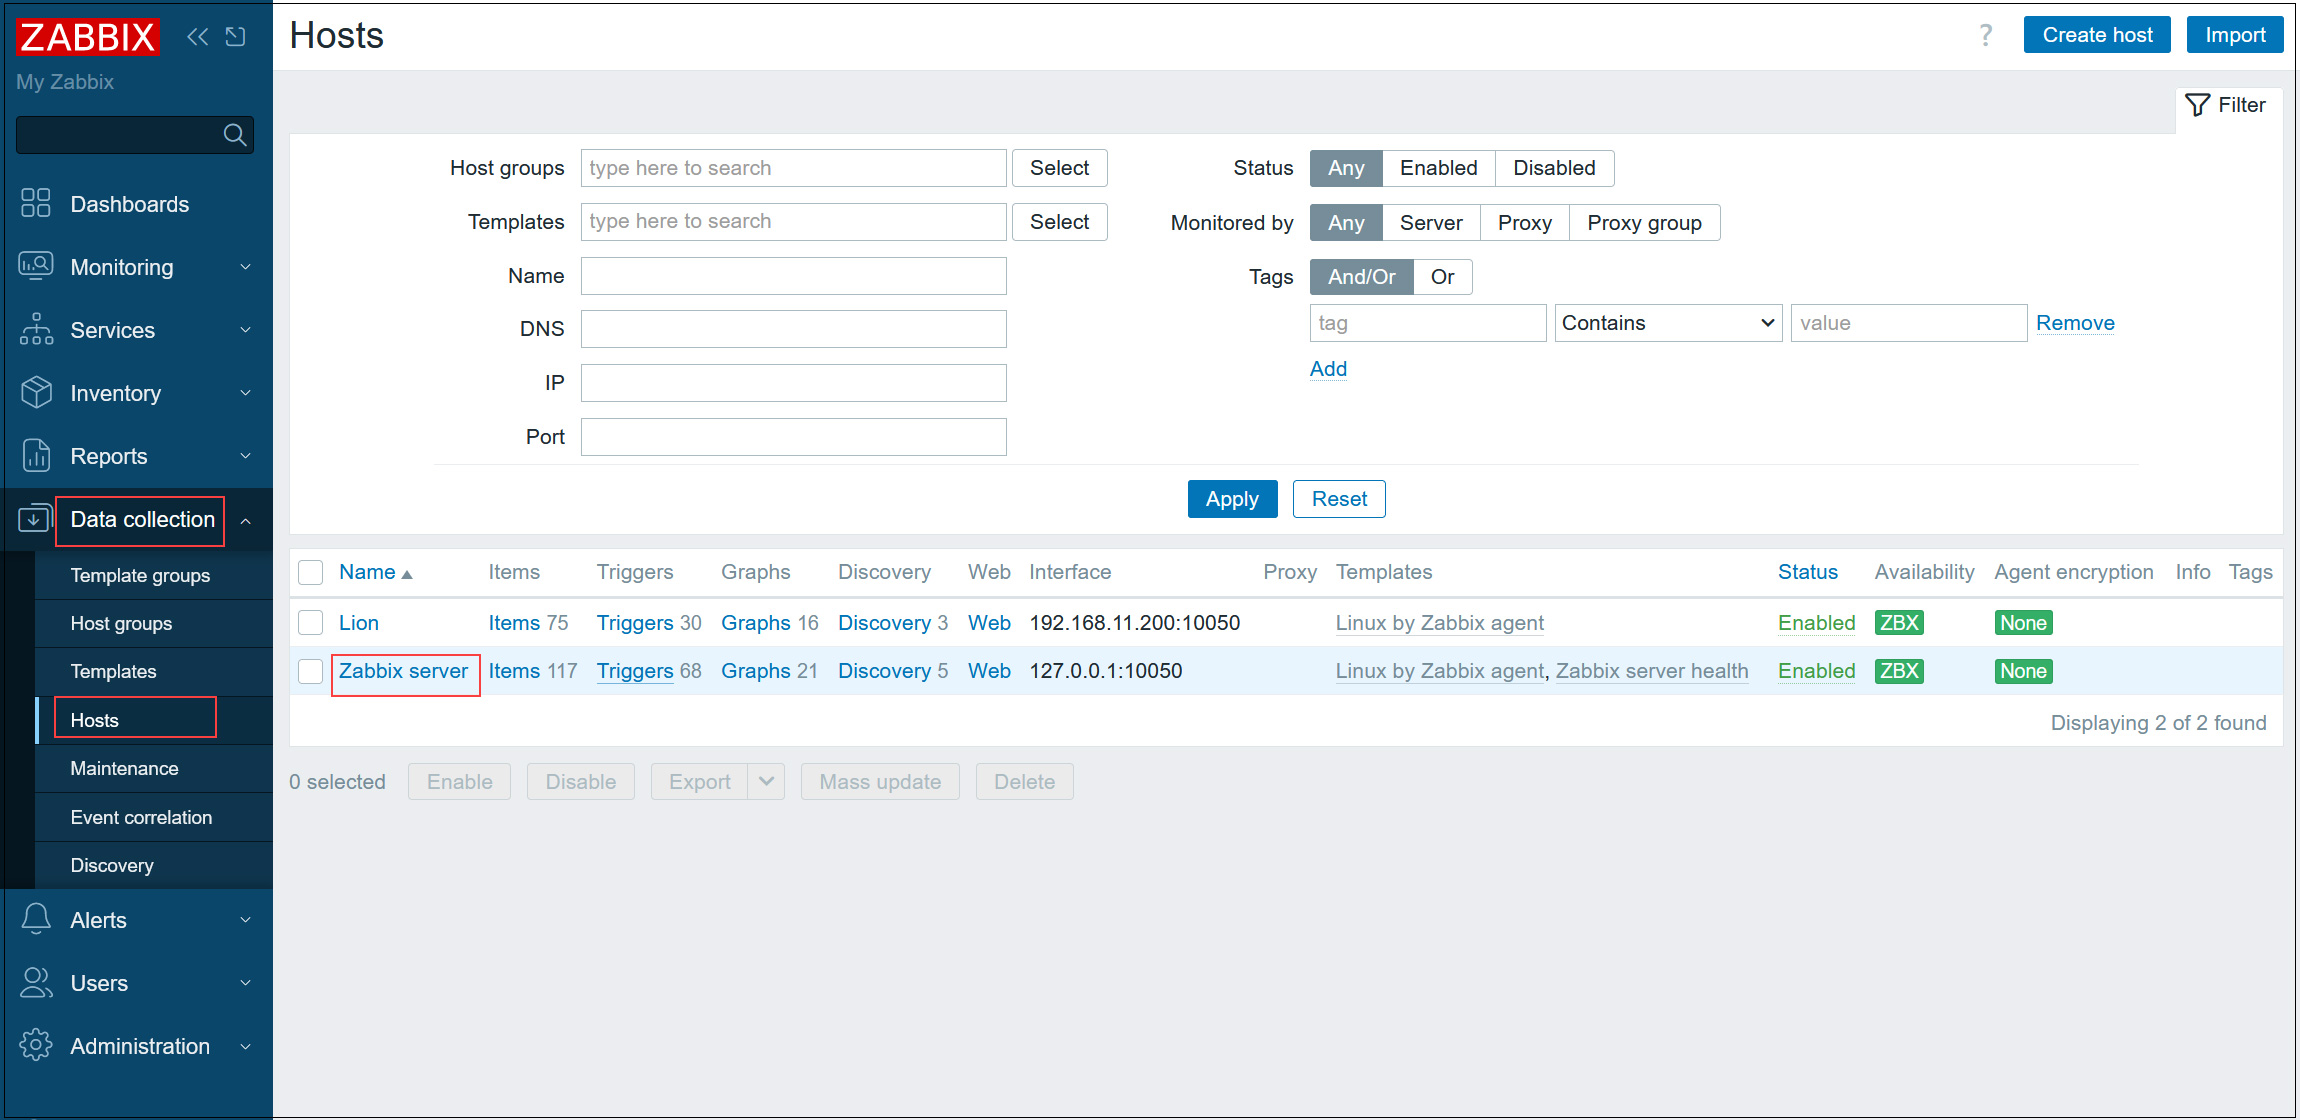
2. Log in to Zabbix administration site, in the left pane click on [Data collection] - [Hosts], in the right pane click on the host you want to add monitoring items for (in this case Zabbix server)
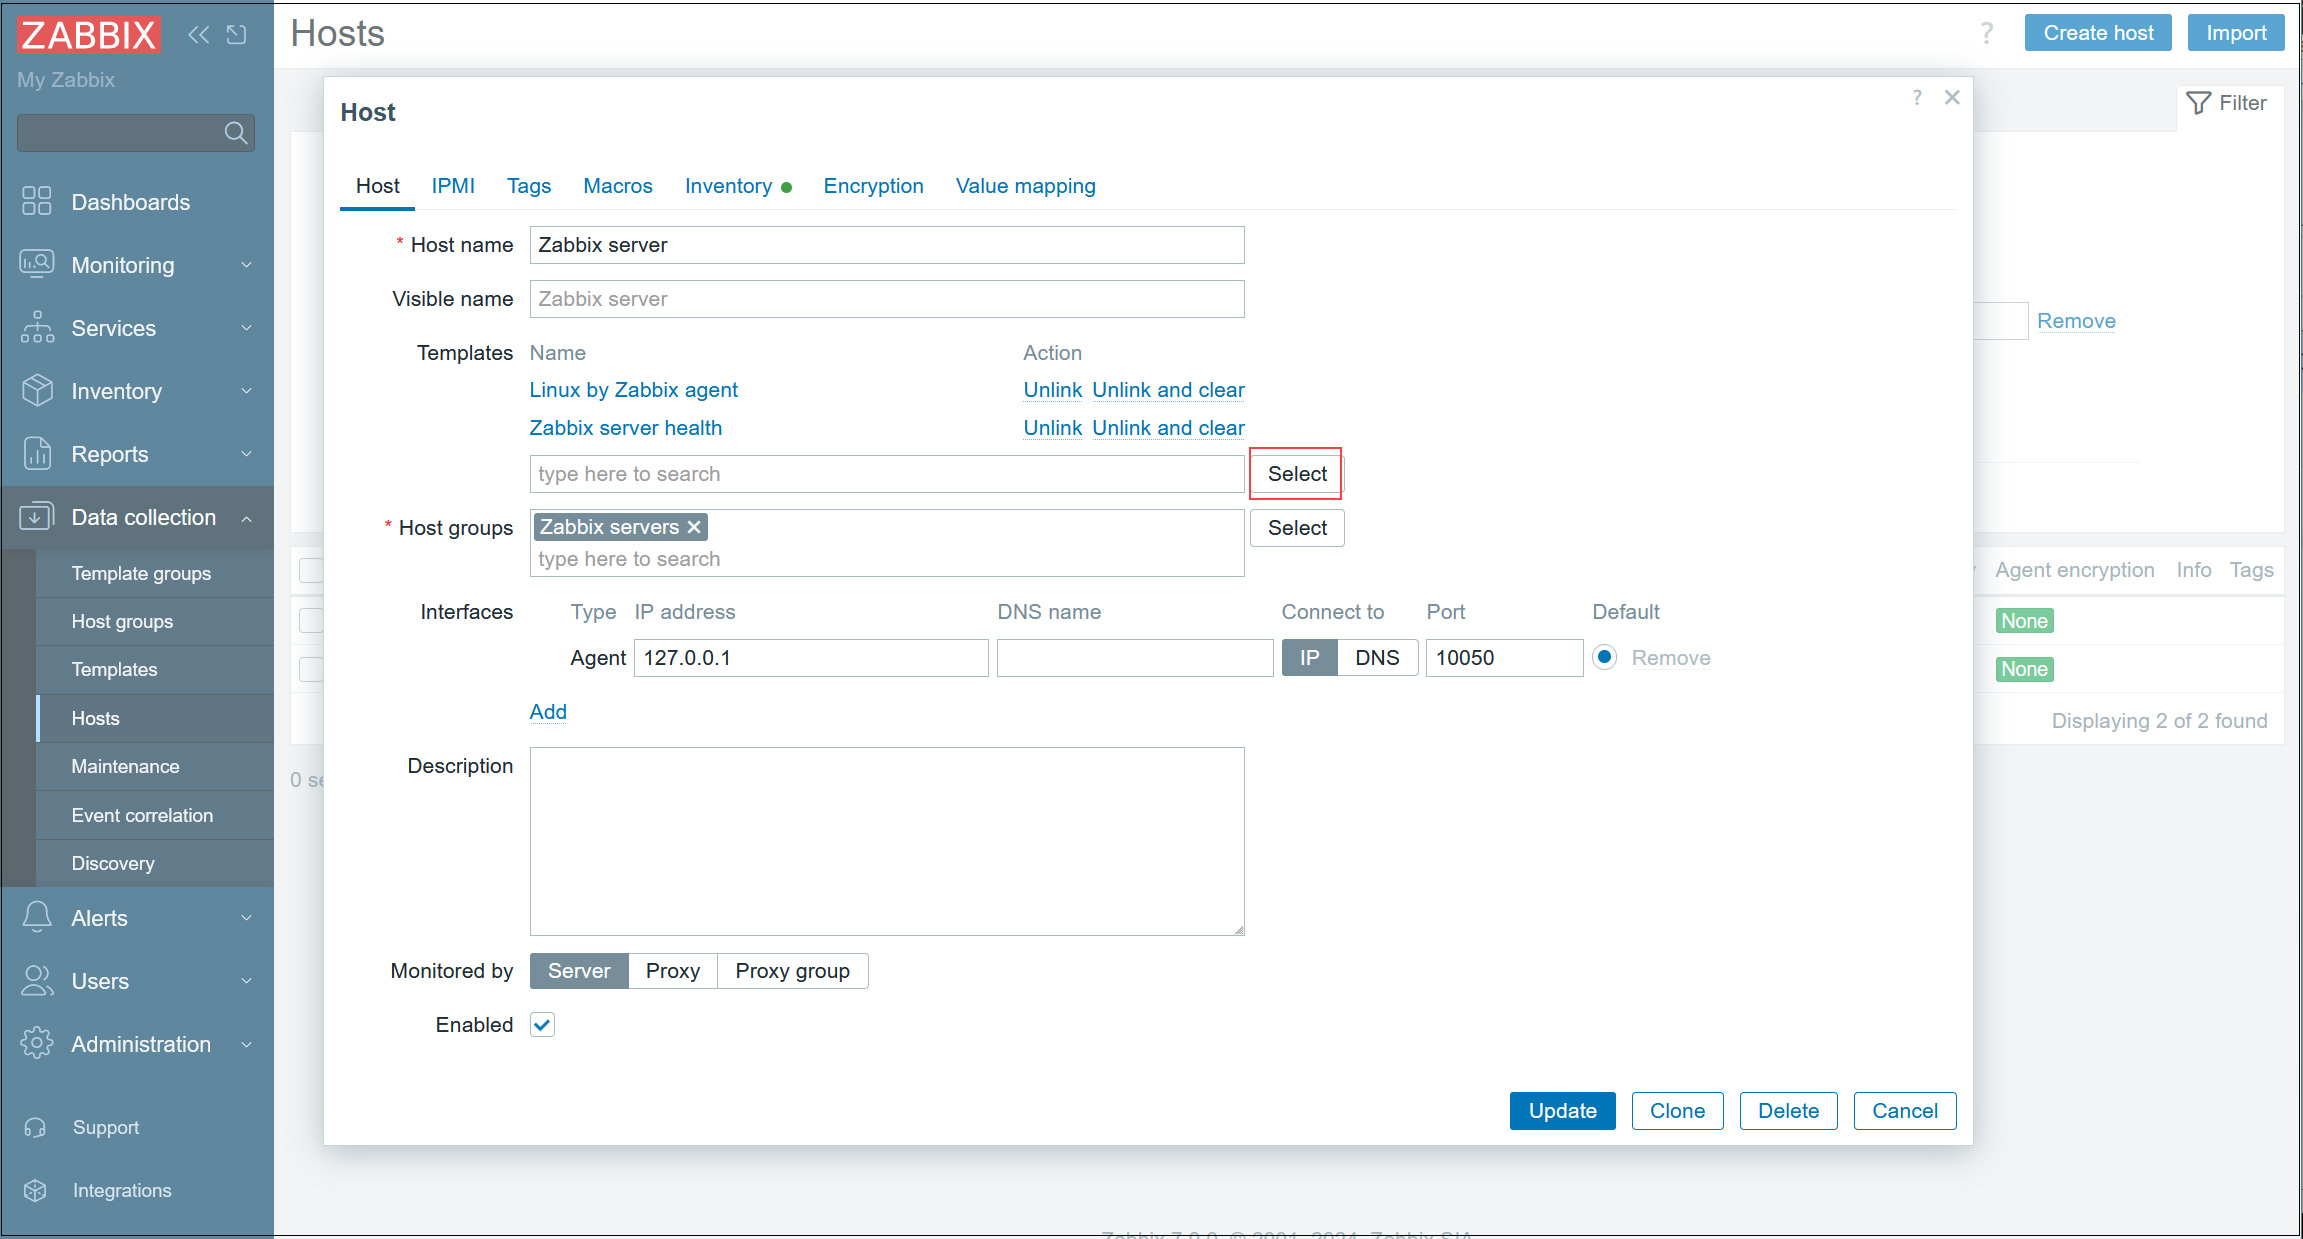
3. Click the [Select] button in the [Templates] section
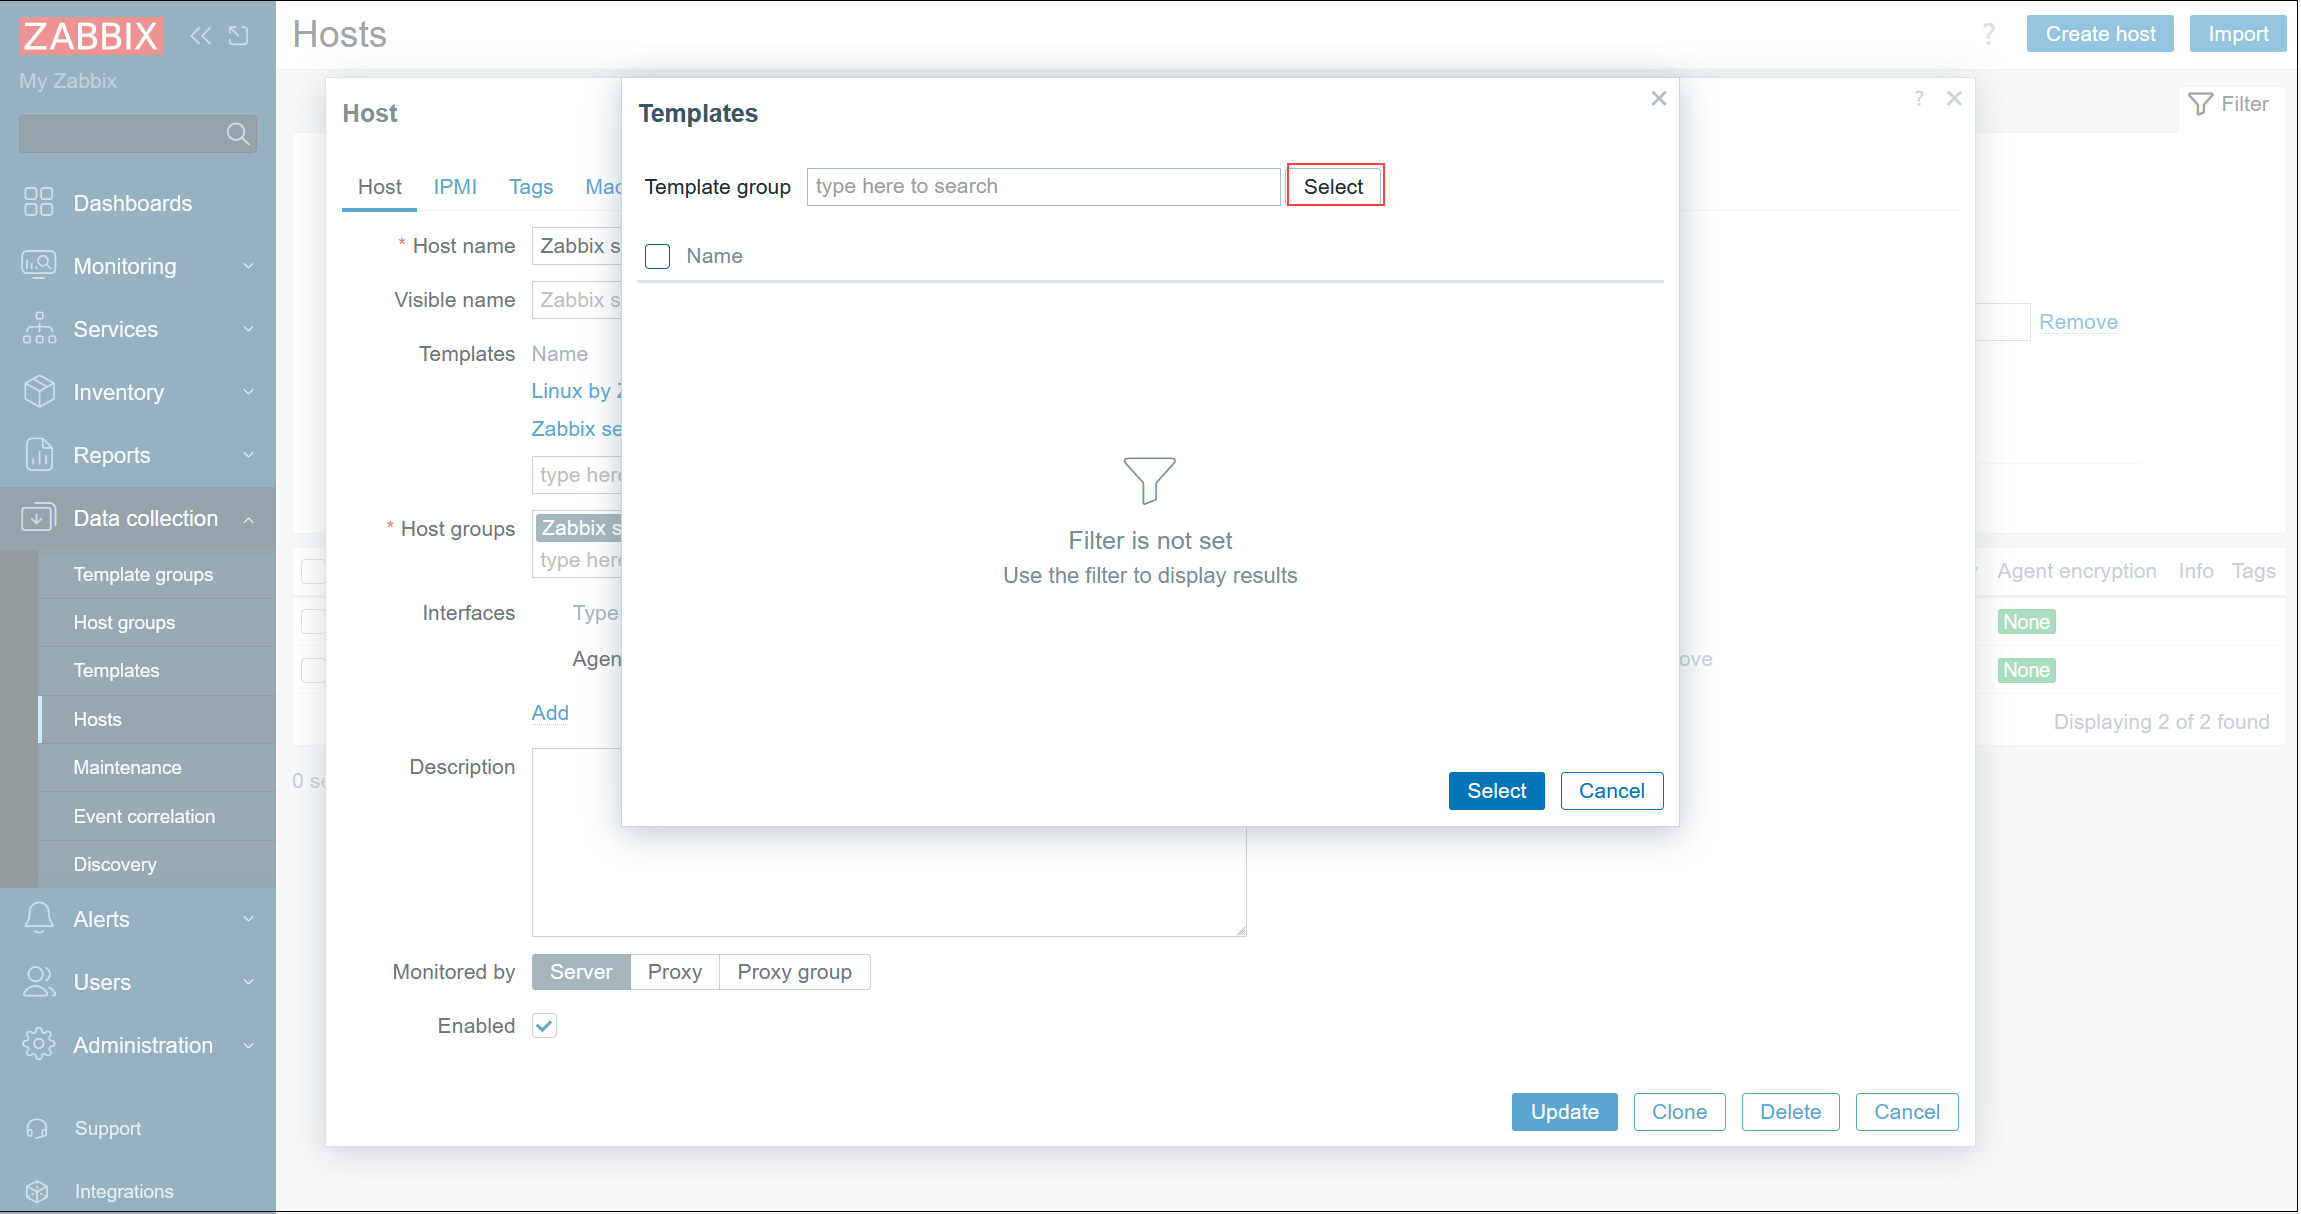
4. Click the [Select] button.
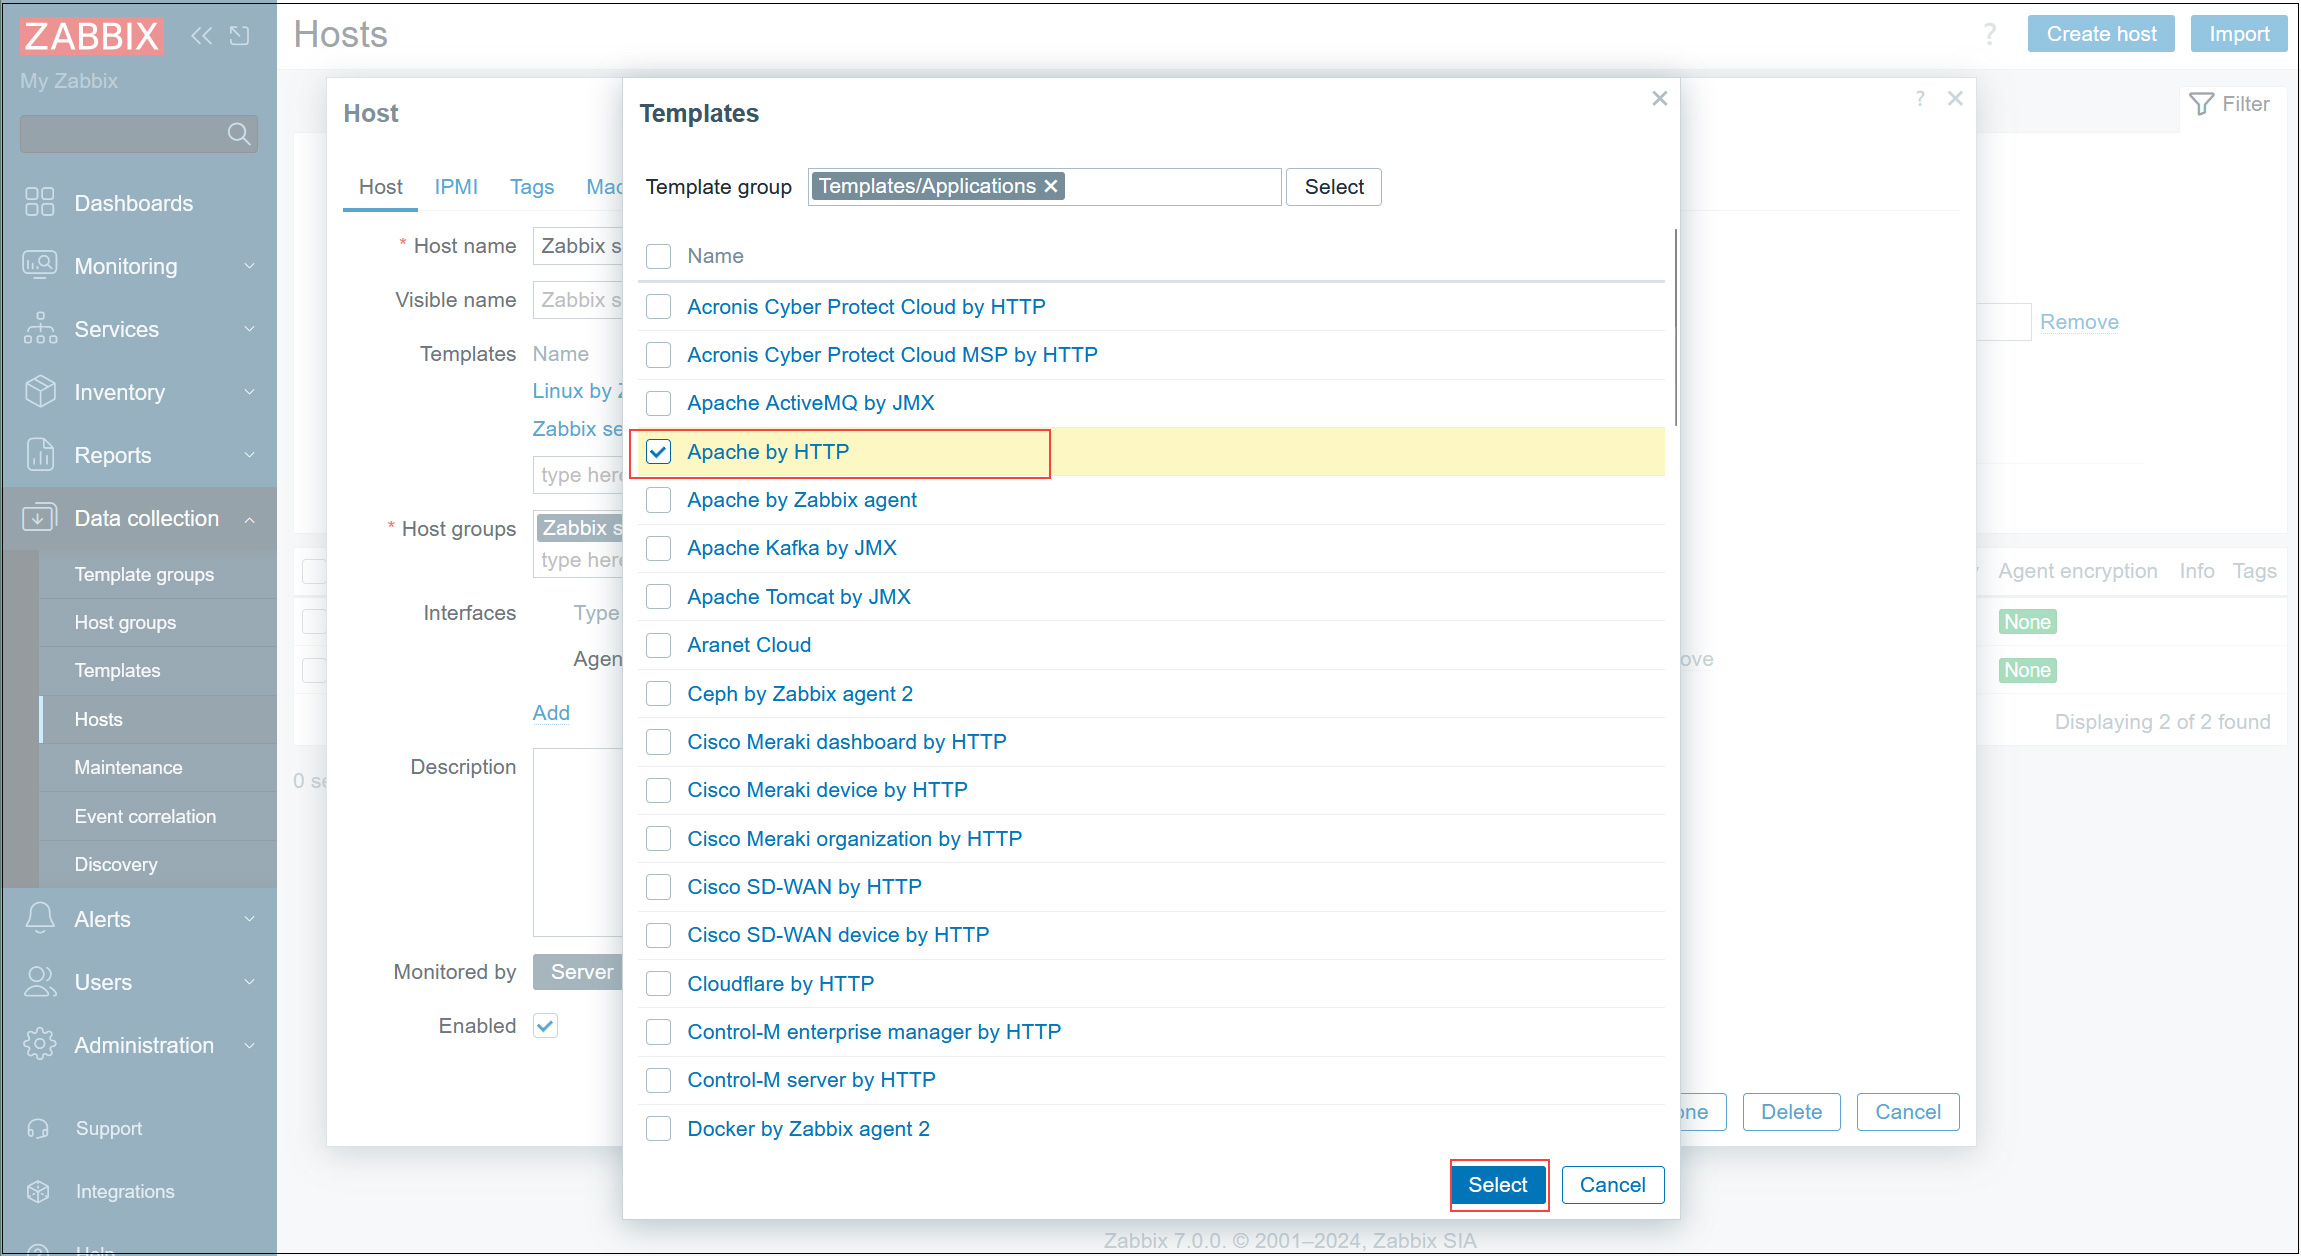
5.Click on [Templates/Applications]
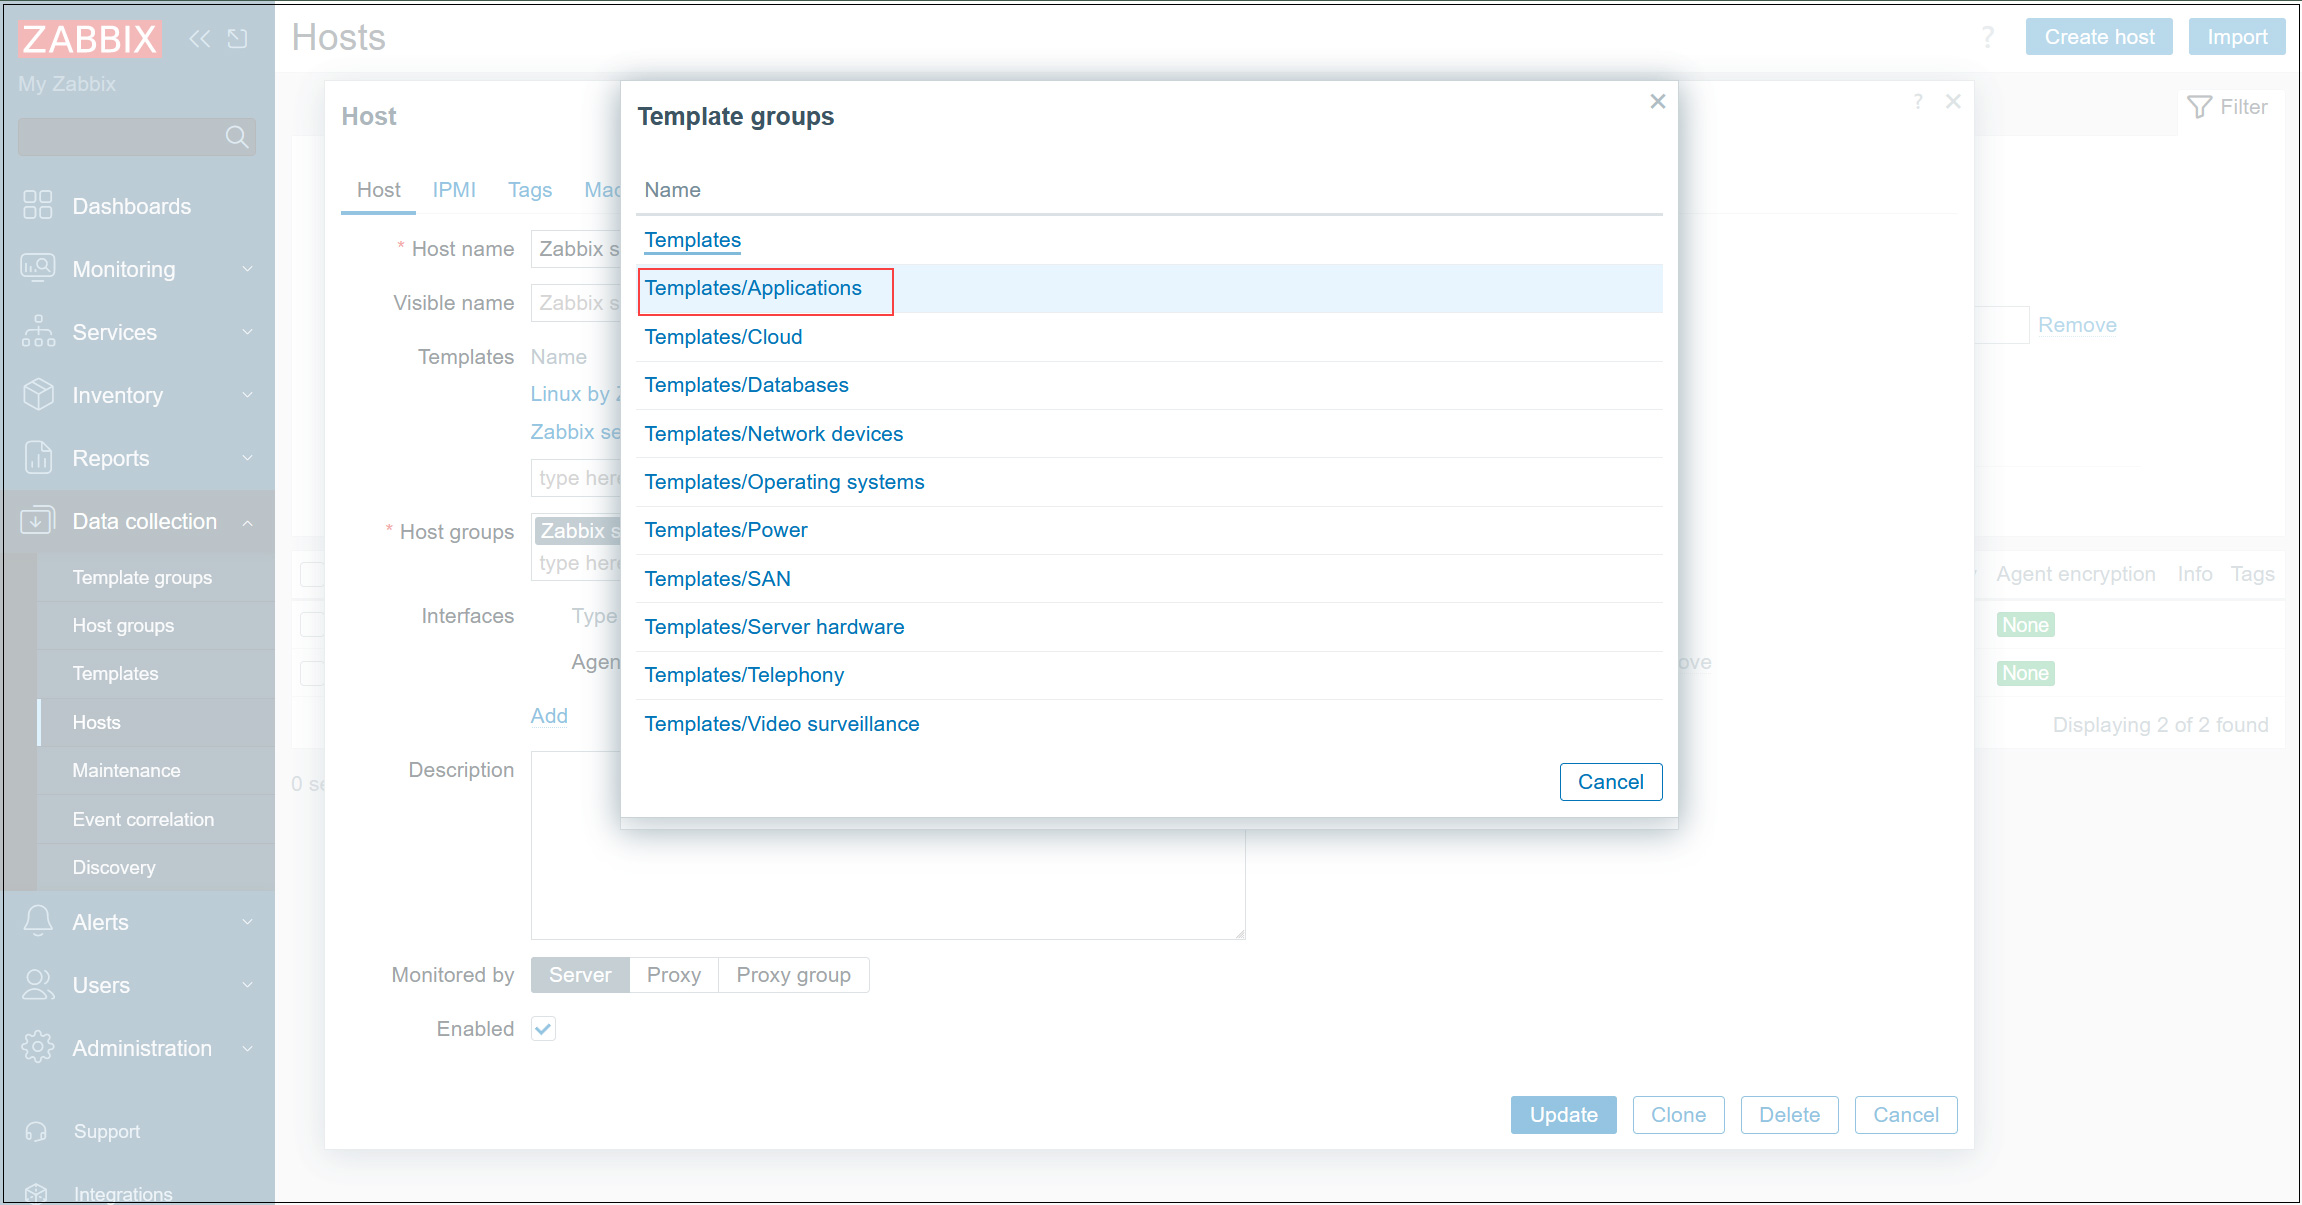
6.Select [Apache by HTTP], then [Select]
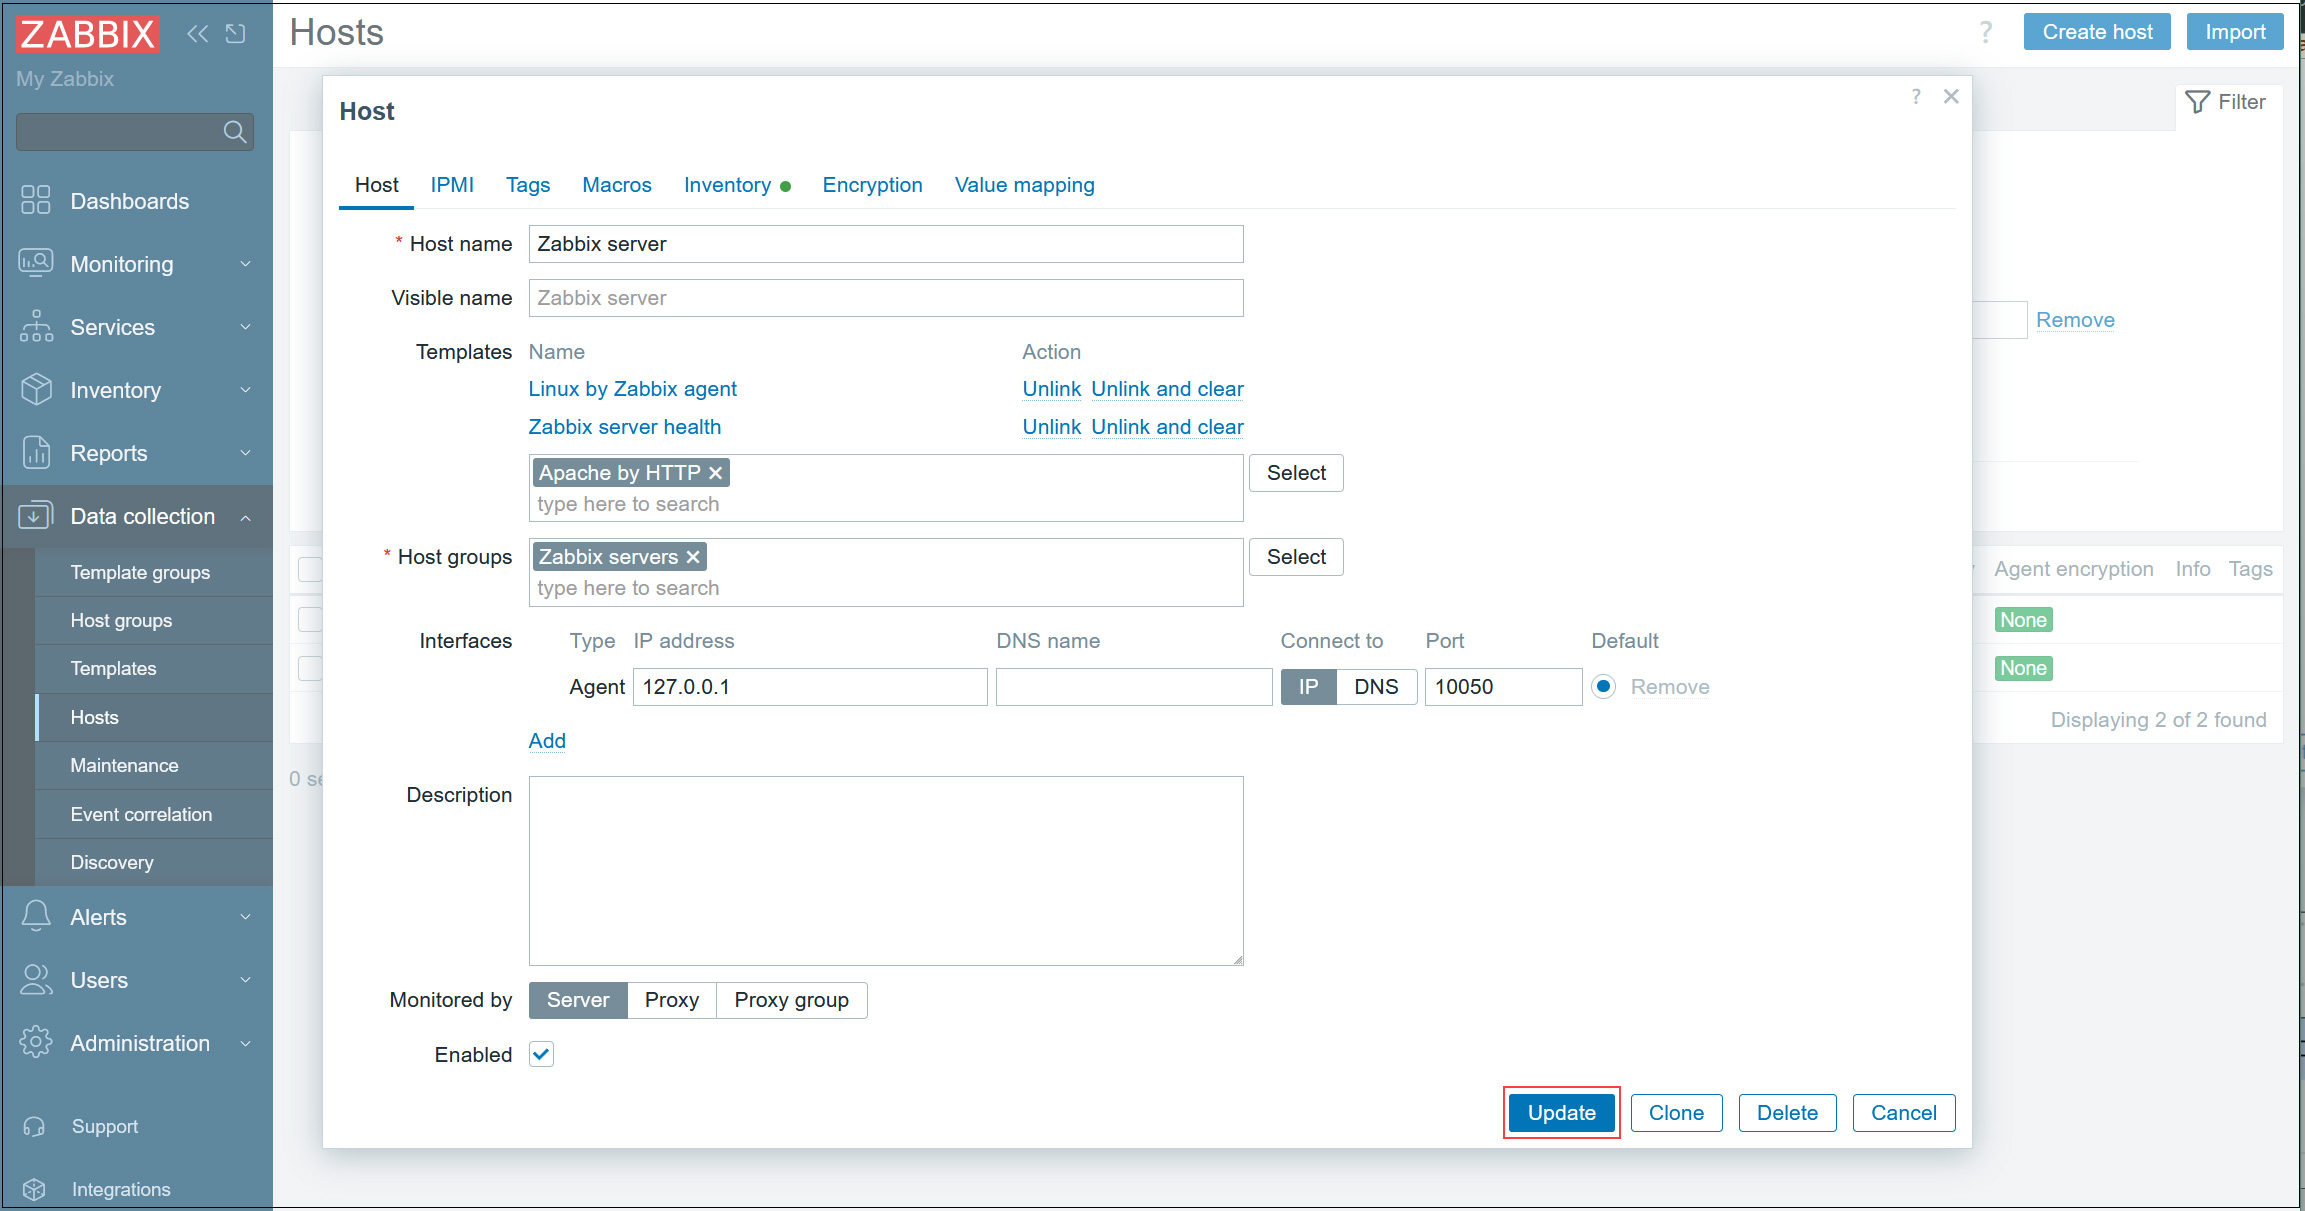
7. Click [Update] button to update settings
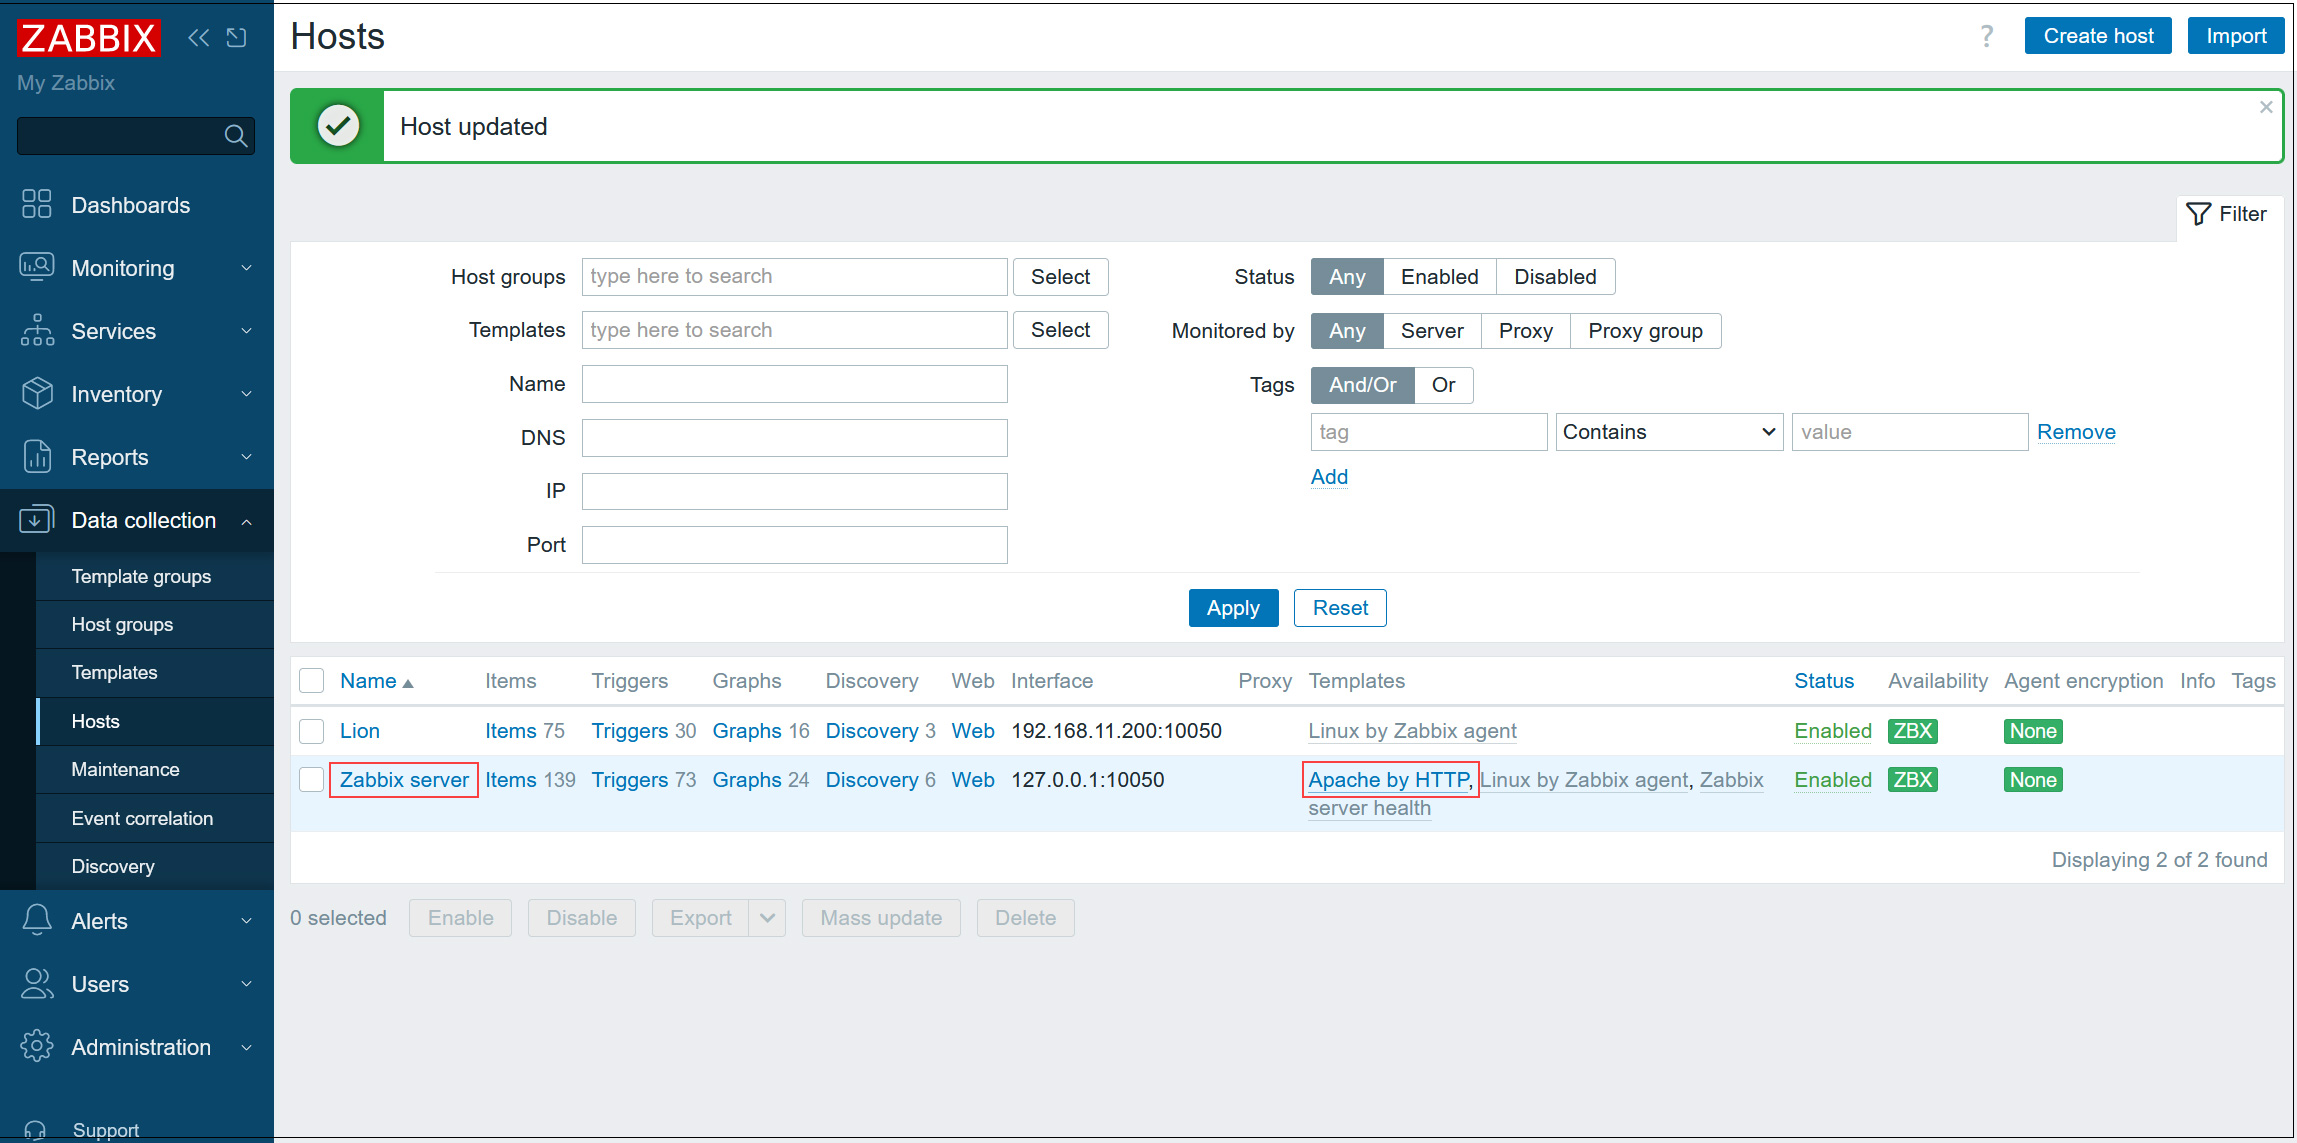
8. Click the [Apache by HTTP] link.
9. Open the [Macros] tab, enter [127.0.0.1] in {$APACHE.STATUS.HOST} and [Update]
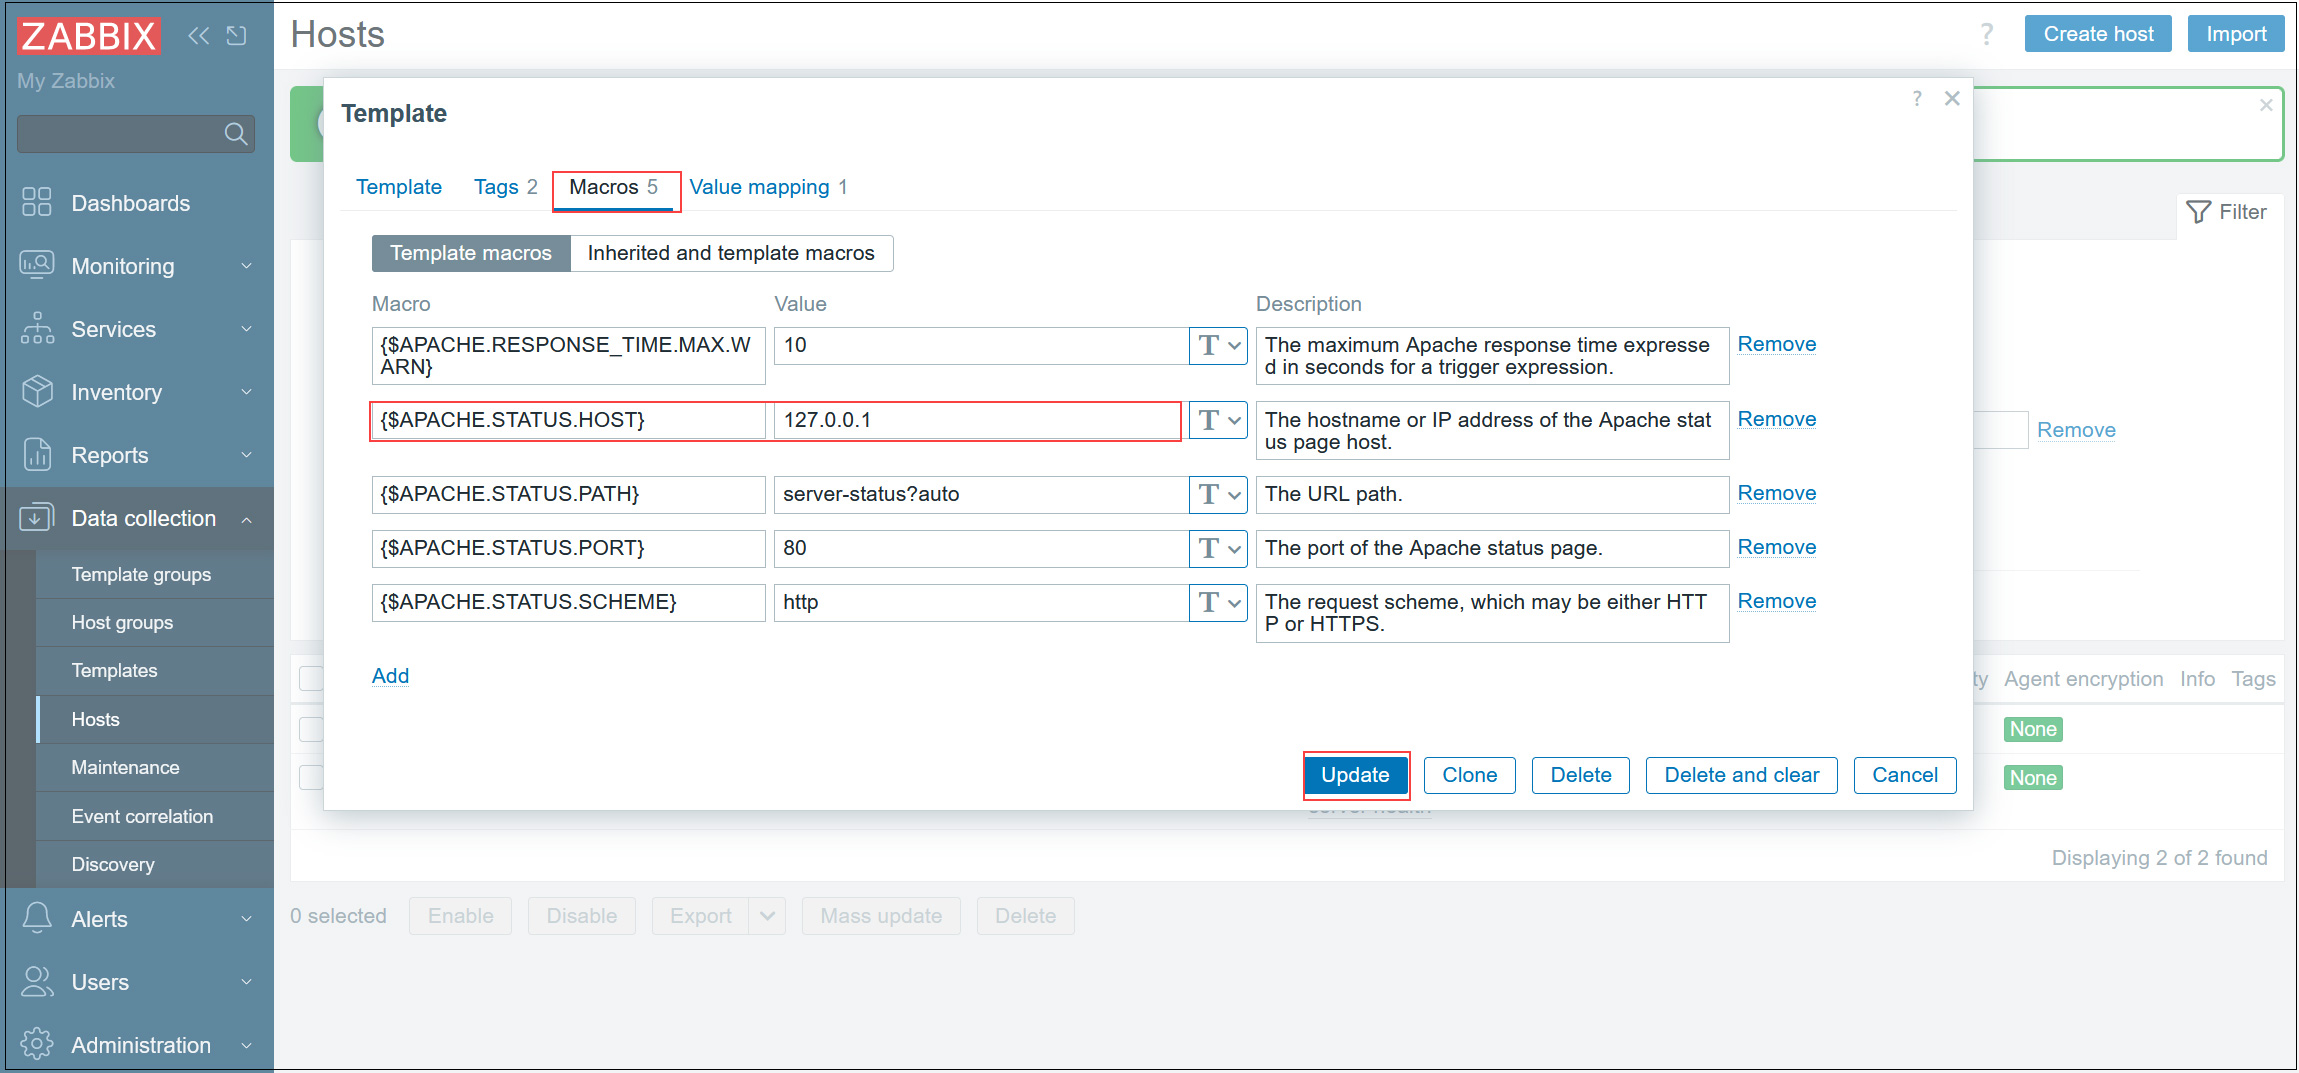
After a while, data will be displayed as shown in the figure below.