Contents
- Open Source Integrated Monitoring Software "MIRACLE ZBX"
- 1. Register dnf repository for MIRACLE ZBX 7.0
- 2. Configure firewall for MIRACLE ZBX
- 3. Installation of MIRACLE ZBX Server and Web Front End
- 4. Monitor the MIRACLE ZBX server itself
- 5. Run the MIRACLE ZBX Web Installer
- 6. Various settings for MIRACLE ZBX
- 7.Confirmation of MIRACLE ZBX startup
- 8. Add monitored hosts
- 9.Add items to be monitored
Open Source Integrated Monitoring Software "MIRACLE ZBX"
MIRACLE ZBX, enterprise-oriented integrated system monitoring software based on the open source Zabbix, with enhancements and modifications provided by Cybertrust. It implements security enhancements that comply with some requirements of the National Institute of Standards and Technology (NIST) security guidelines "NIST SP800-171" and "NIST SP800-53", which are becoming an international standard for security standards.
SELinux must be set to permissive (enable if SELinux is disabled)
|
1 2 3 4 5 6 |
# setenforce 0 && sed -i 's/^SELINUX=.*/SELINUX=permissive/g' /etc/selinux/config # cat /etc/selinux/config | grep SELINUX= # SELINUX= can take one of these three values: # NOTE: In earlier Fedora kernel builds, SELINUX=disabled would also SELINUX=permissive |
1. Register dnf repository for MIRACLE ZBX 7.0
Install Repository
|
1 |
# dnf install https://ftp.miraclelinux.com/zbx/7.0/miracle-zbx-release-7.0-1.noarch.rpm |
2. Configure firewall for MIRACLE ZBX
The ports used by MIRACLE ZBX components are as follows
MIRACLE ZBX Web Front End : 80/tcp
MIRACLE ZBX Agent/Agent 2 : 10050/tcp
MIRACLE ZBX Server/Proxy : 10051/tcp
MIRACLE ZBX Java Gateway : 10052/tcp
This time, only "MIRACLE ZBX Web Front End", "MIRACLE ZBX Agent2" and "MIRACLE ZBX Server" will be installed, so allow the following ports.
|
1 2 |
# firewall-cmd --add-port={80,10050,10051,10052,10053}/tcp --permanent # firewall-cmd --reload |
3. Installation of MIRACLE ZBX Server and Web Front End
The installation environment is as follows
Apache/2.4.57
Mysql Ver 8.0.36
PHP 8.0.30 (cli)
PHP 8.0.30 (fpm-fcgi)
①Install MIRACLE ZBX package for MariaDB/MySQL
|
1 |
# dnf install miracle-zbx-server-mysql miracle-zbx-sql-scripts |
②Create database and users for MIRACLE ZBX server
Create database schema for Zabbix server.
Login to the MySQL server as root account and create a MySQL database (e.g. zabbix), user (e.g. zabbix) and password (e.g. ?Wabcd123).
|
1 2 3 4 5 6 7 |
# mysql -u root -p Password: > create database zabbix character set utf8mb4 collate utf8mb4_bin; > create user zabbix@localhost identified by '?Wabcd123'; > grant all privileges on zabbix.* to zabbix@localhost; > set global log_bin_trust_function_creators = ON; > exit; |
③Import initial data from MIRACLE ZBX
Import the initial database schema and data from MIRACLE ZBX into the newly created database.
|
1 2 |
# zcat /usr/share/miracle-zbx-sql-scripts/mysql/create.sql.gz | mysql zabbix -uzabbix -p Entter password ←Password for user zabbix |
④Edit MIRACLE ZBX server configuration file
Edit the MIRACLE ZBX server configuration file and update the database settings in order for the MIRACLE ZBX server to connect to the database
|
1 2 3 |
# vi /etc/zabbix/zabbix_server.conf Line 141 : Uncomment and fill in password DBPassword=[password of user zabbix when creating database] |
⑤Start service zabbix-server
|
1 2 |
# systemctl enable --now zabbix-server # systemctl start zabbix-server |
⑥Install packages for web front-end and Apache (if using MySQL/MariaDB)
|
1 |
# dnf install miracle-zbx-web miracle-zbx-web-mysql miracle-zbx-web-japanese miracle-zbx-apache-conf miracle-zbx-web-deps |
⑦Start httpd and php-fpm
|
1 2 |
# systemctl enable --now httpd php-fpm # systemctl restart --now httpd php-fpm |
4. Monitor the MIRACLE ZBX server itself
①Install MIRACLE ZBX Agent 2 package on this server to monitor the server itself
|
1 |
# dnf install miracle-zbx-agent2 |
➁Start zabbix-agent2
|
1 2 3 |
# systemctl enable --now zabbix-agent2 Created symlink /etc/systemd/system/multi-user.target.wants/zabbix-agent2.service → /usr/lib/systemd/system/zabbix-agent2.service. # systemctl start zabbix-agent2 |
5. Run the MIRACLE ZBX Web Installer
MIRACLE ZBX Web Installer can be accessed via "server IP/zabbix" or "domain/zabbix".
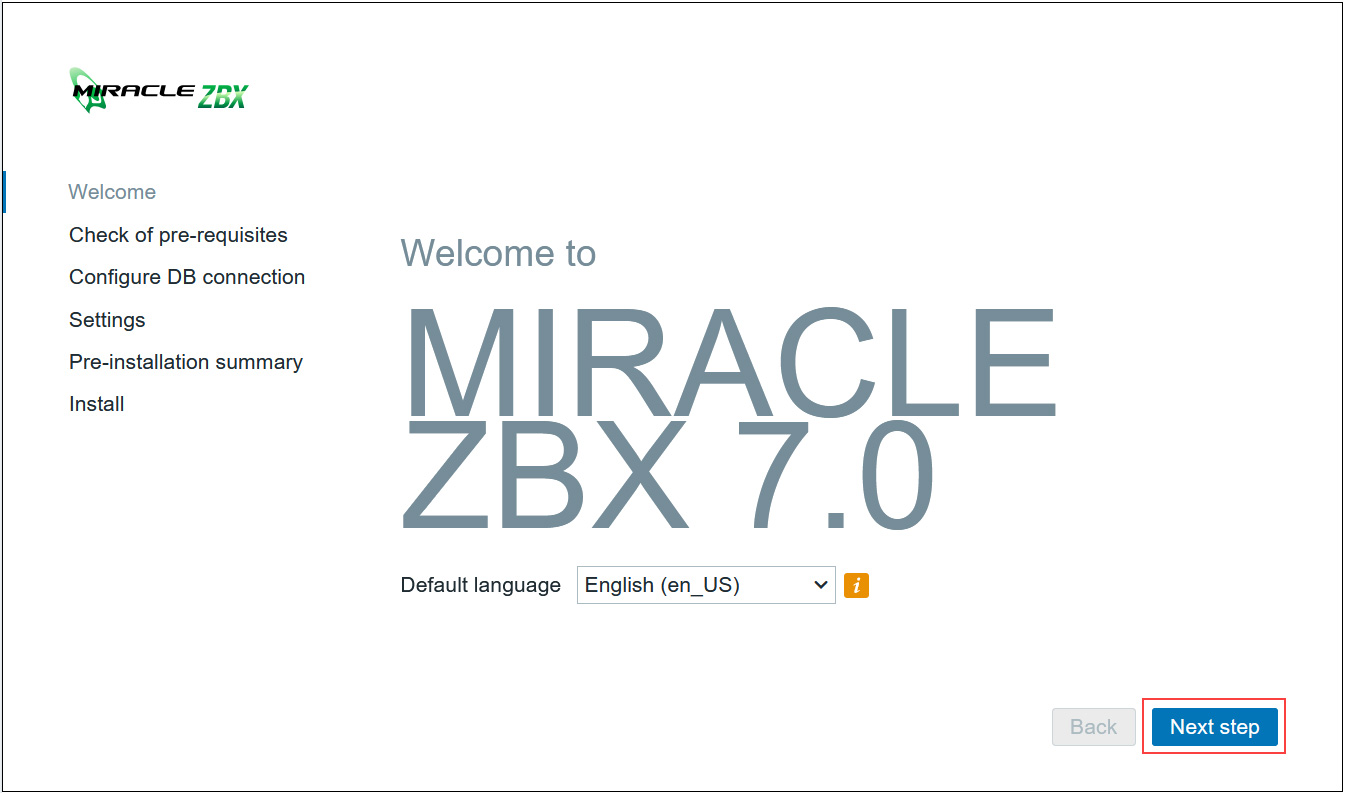
Open a web browser and enter "http: //[your-server-IP_Address]/zabbix".
The following screen will appear. Click [Next step].
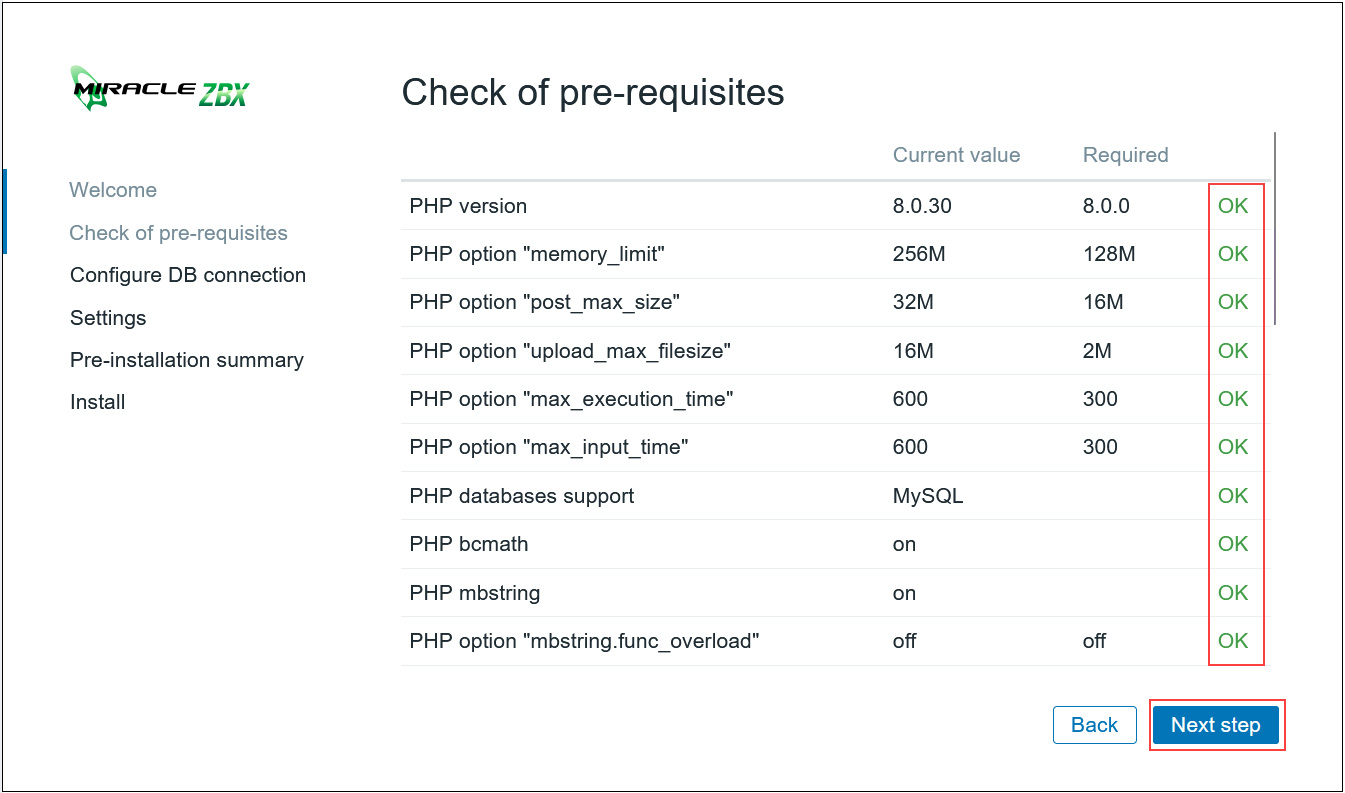
After confirming that all requirements are OK, click [ Next step]
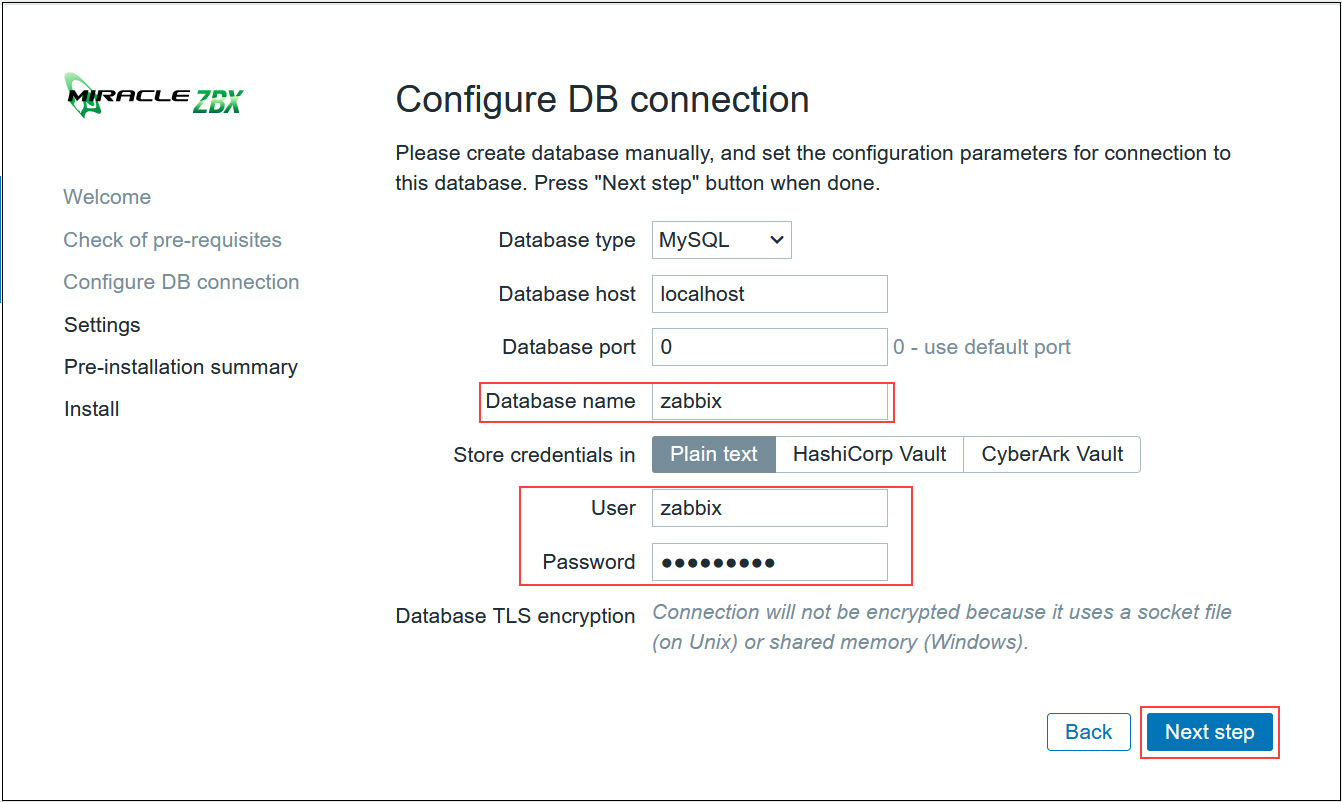
Enter the information you have set in the "Database name", "User", and "Password" fields, and click [ Next step ].
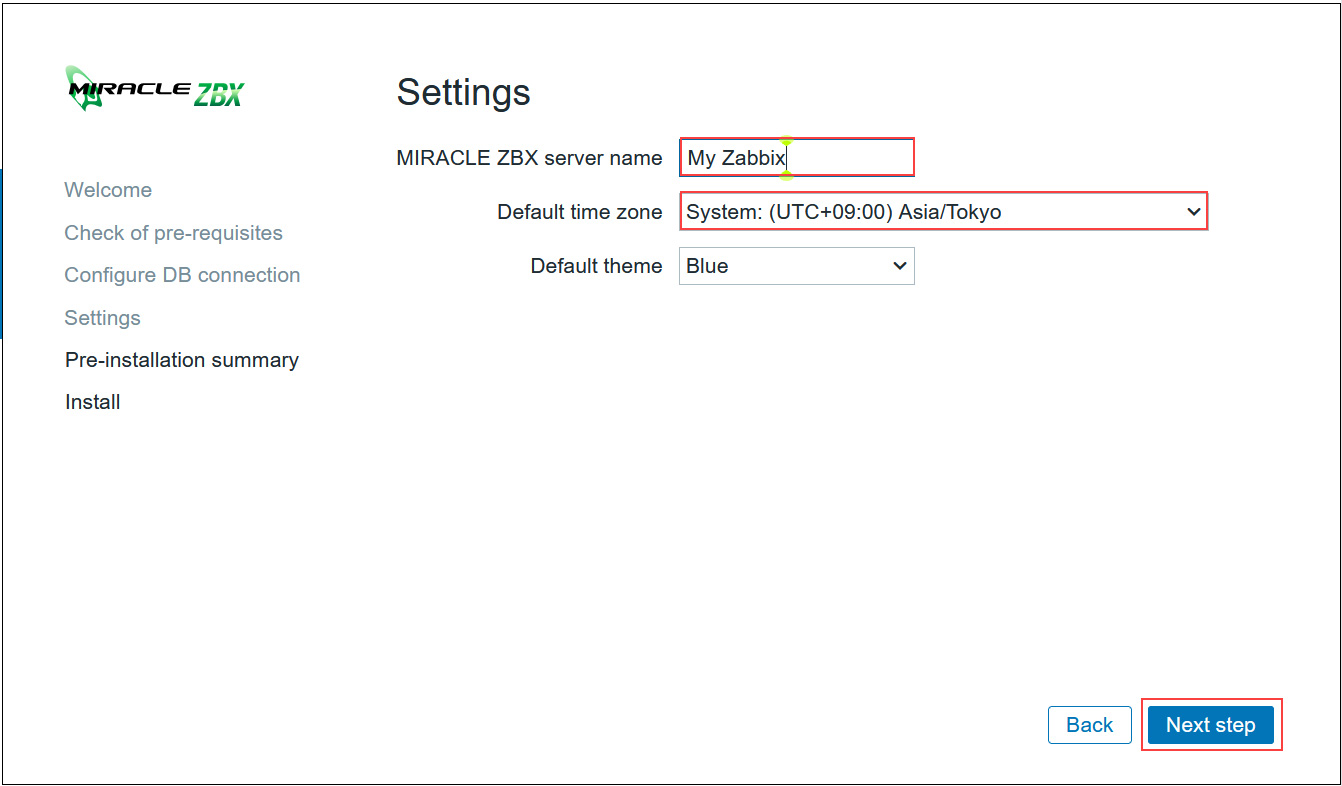
Enter any name for "Zabbix server names" and select Asia/Tokyo for time zone.
After confirming that you are in your own time zone, click [ Next step ].
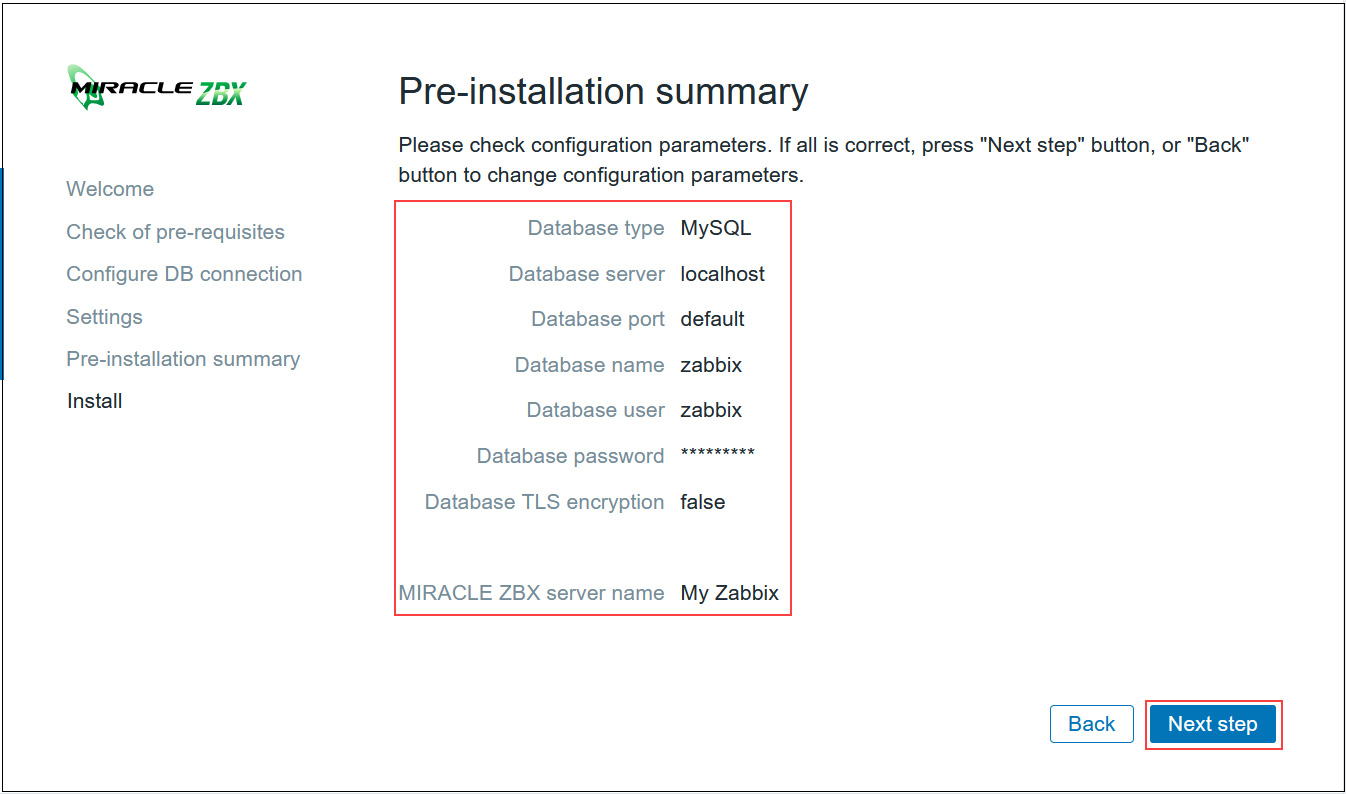
Reconfirm settings If information is correct, click [Next step]
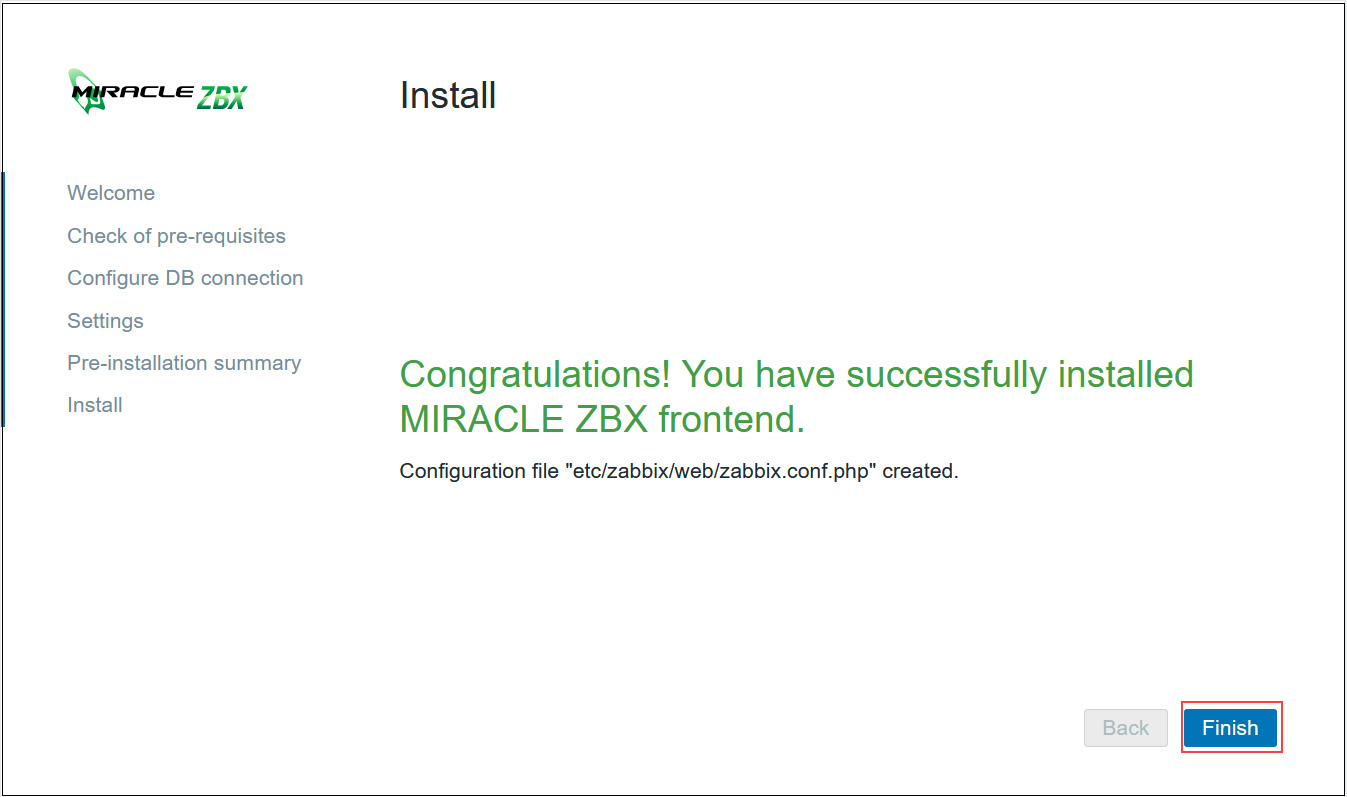
When the installation is successfully completed, the following page will appear. Click [Finish]
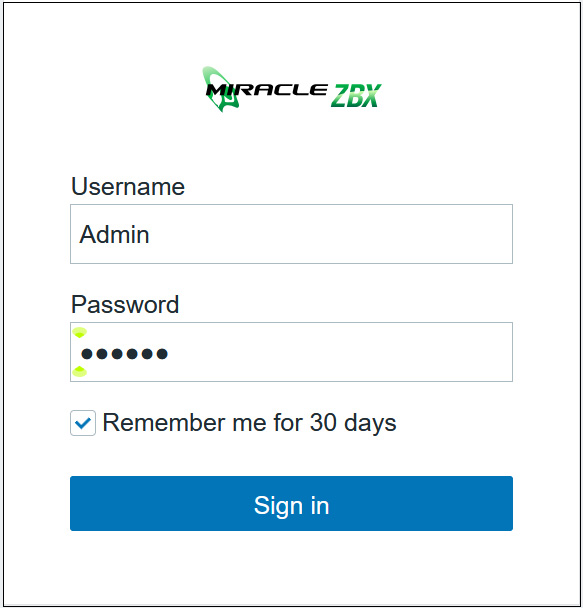
You will be redirected to Zabbix login page
"Sign in" using the following credentials。
Username: Admin
Password: zabbix
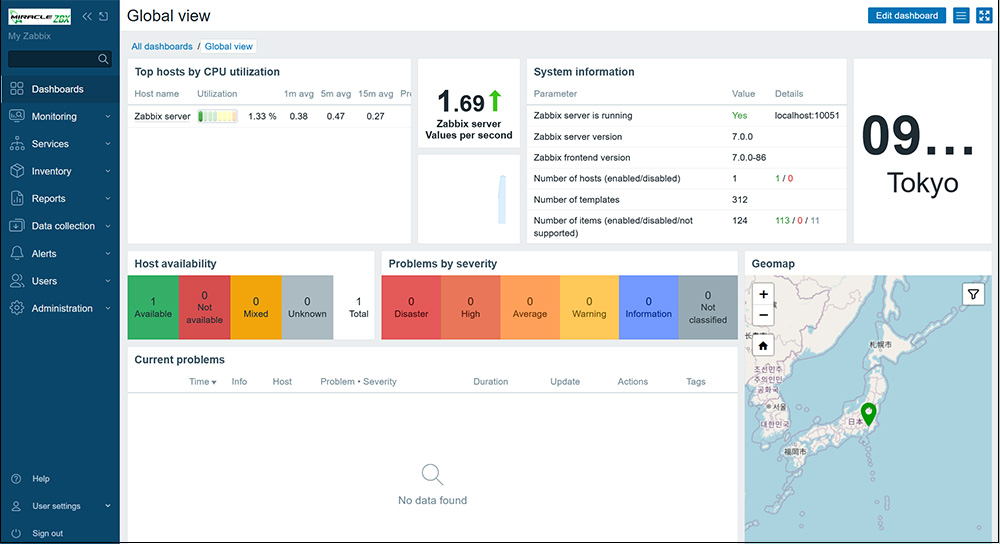
After successful login you will see the following screen (Zabbix Dashboard).
6. Various settings for MIRACLE ZBX
6.1 Change Admin Password
Change the default administrator password for security purposes.
Also, set the administrator's email address.
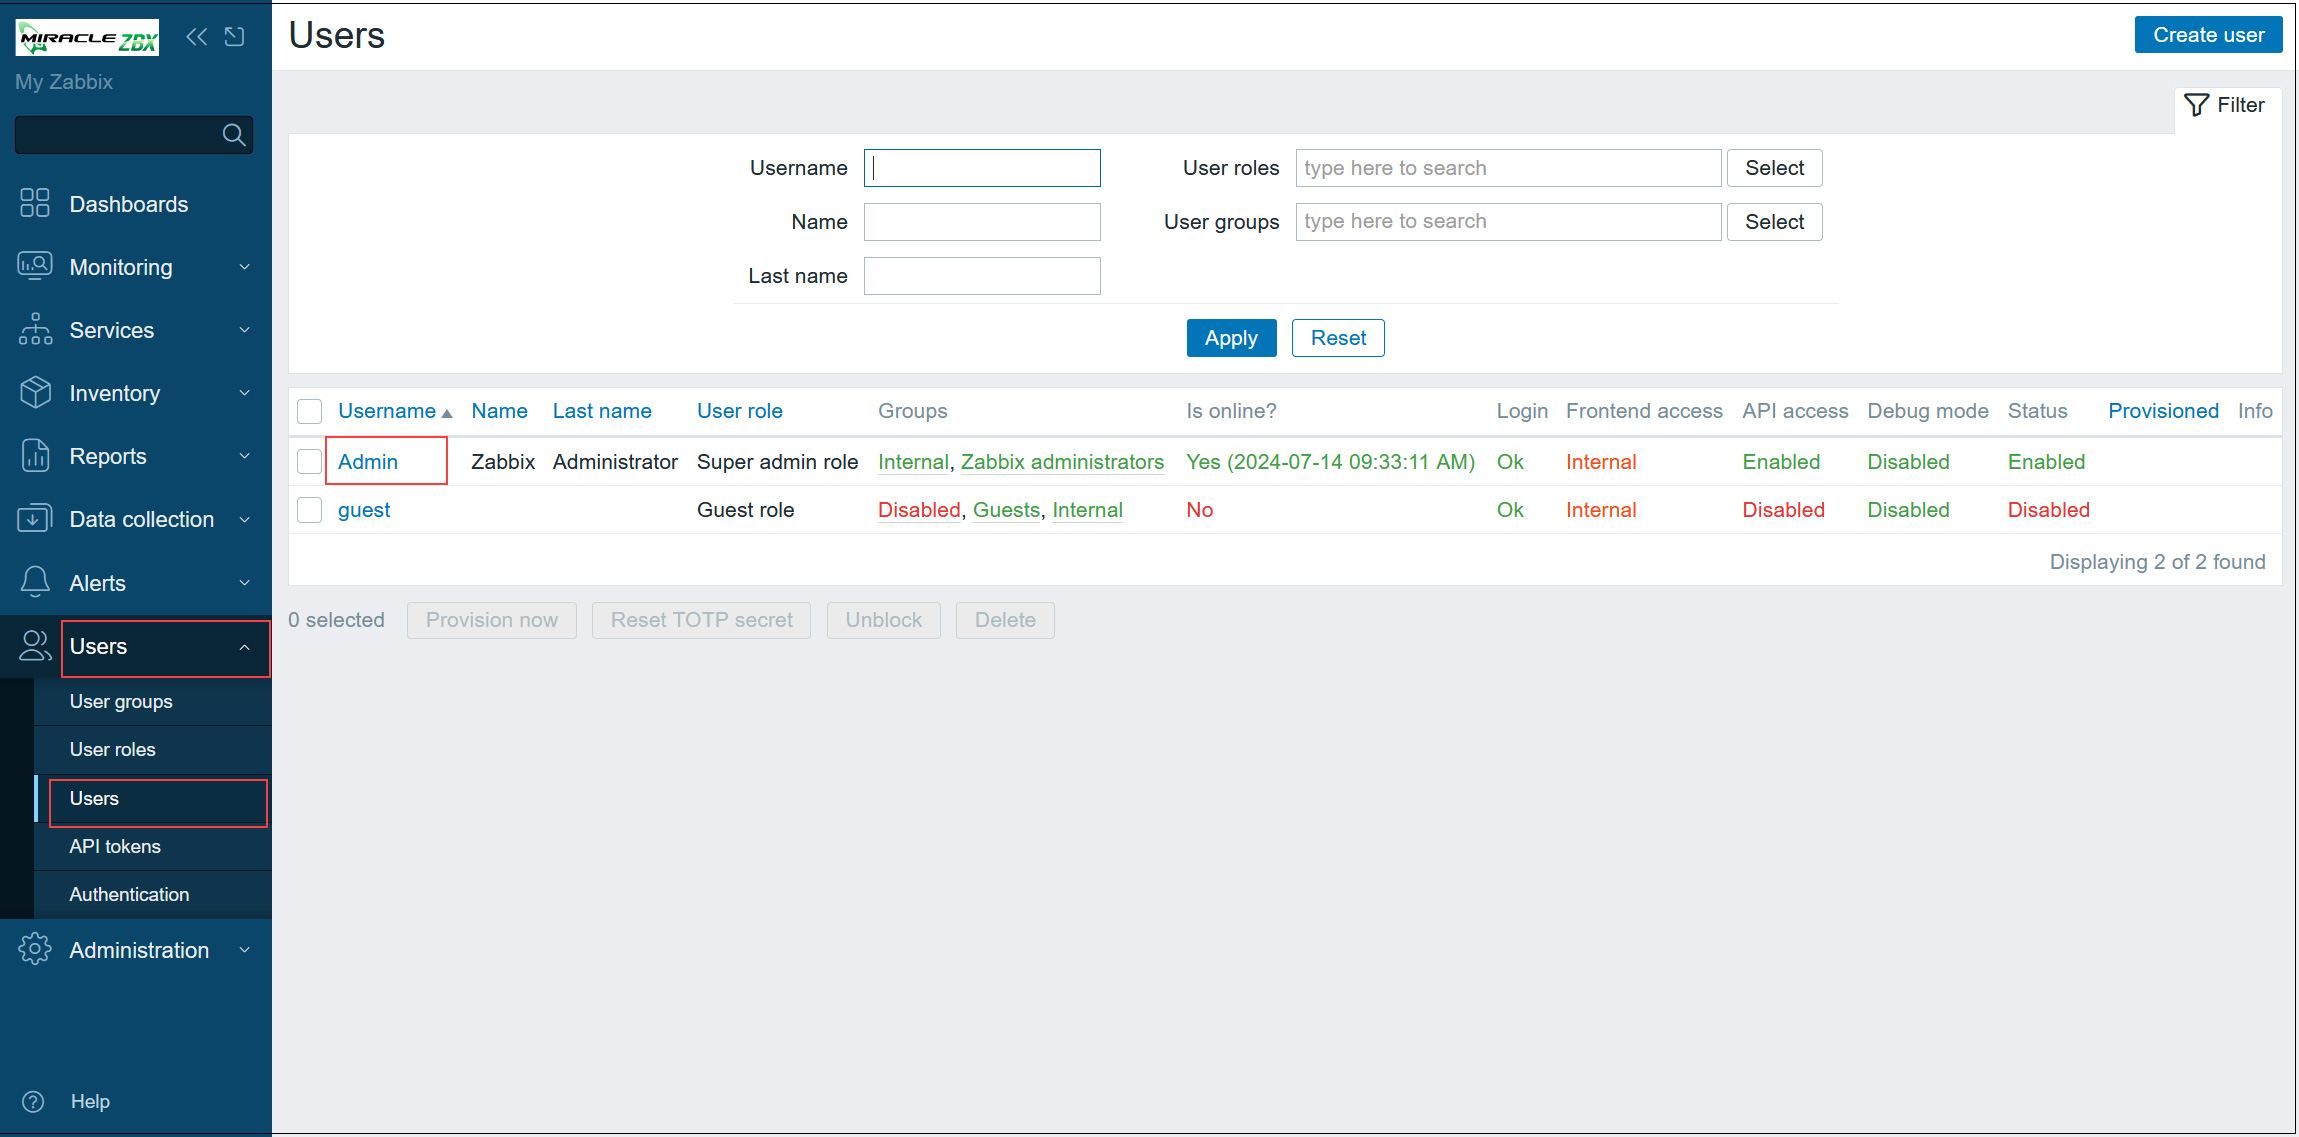
Once the above dashboard is displayed
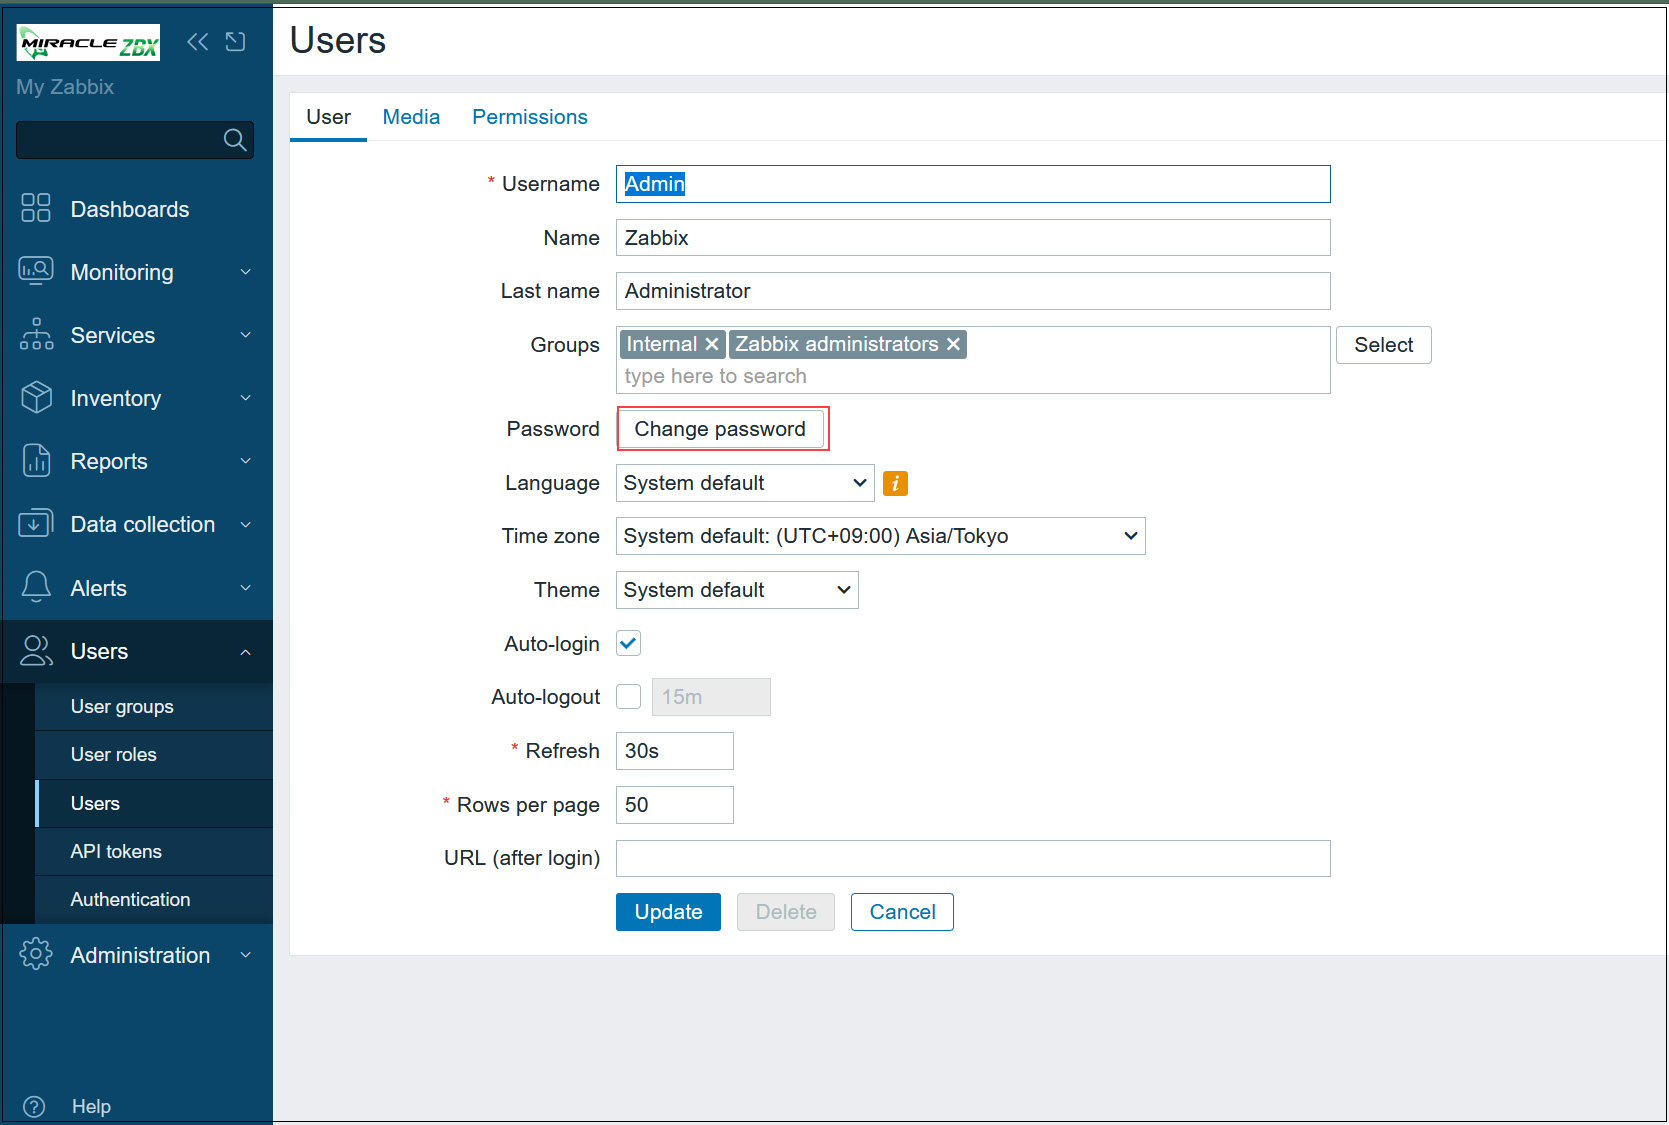
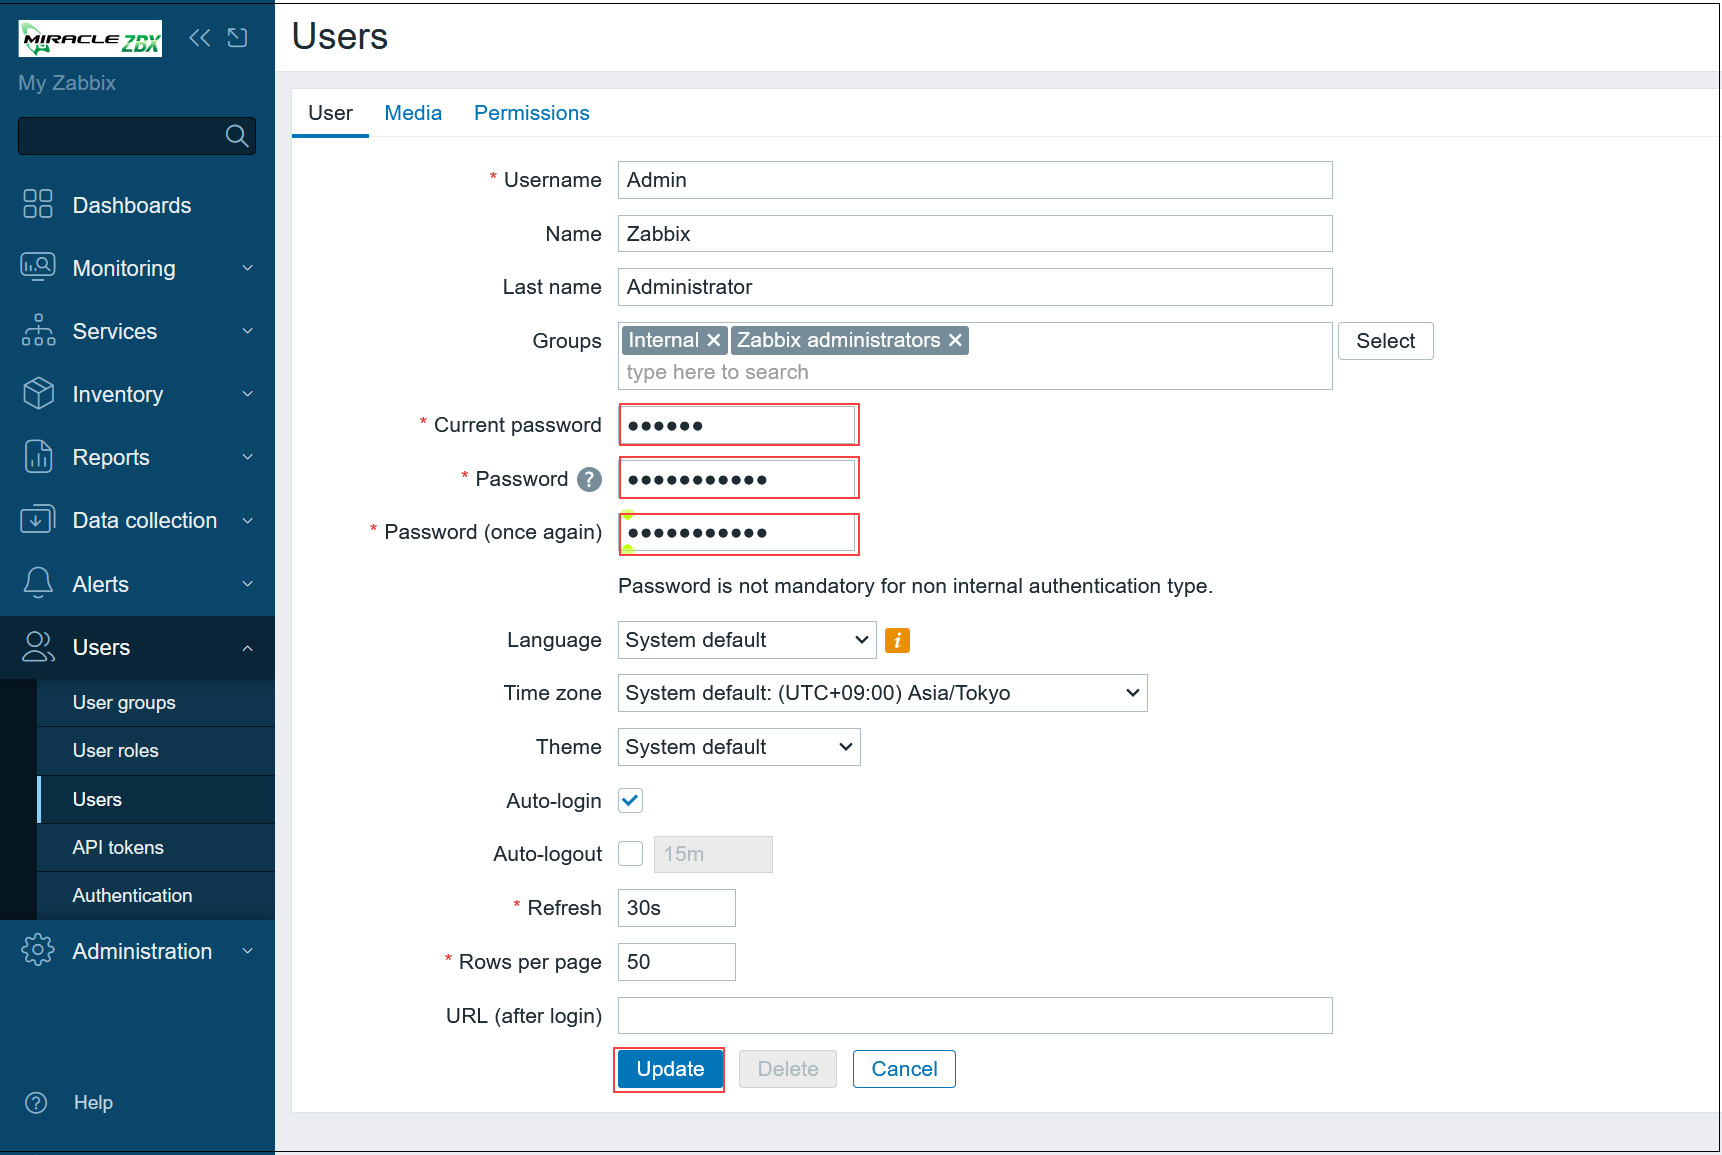
①Select [Users] - [Users] in the left pane and click [Admin] in the right pane
②Click [Change paddword]
③Enter "zabbix" in Current password field, enter the password you want to change twice and click [Update]
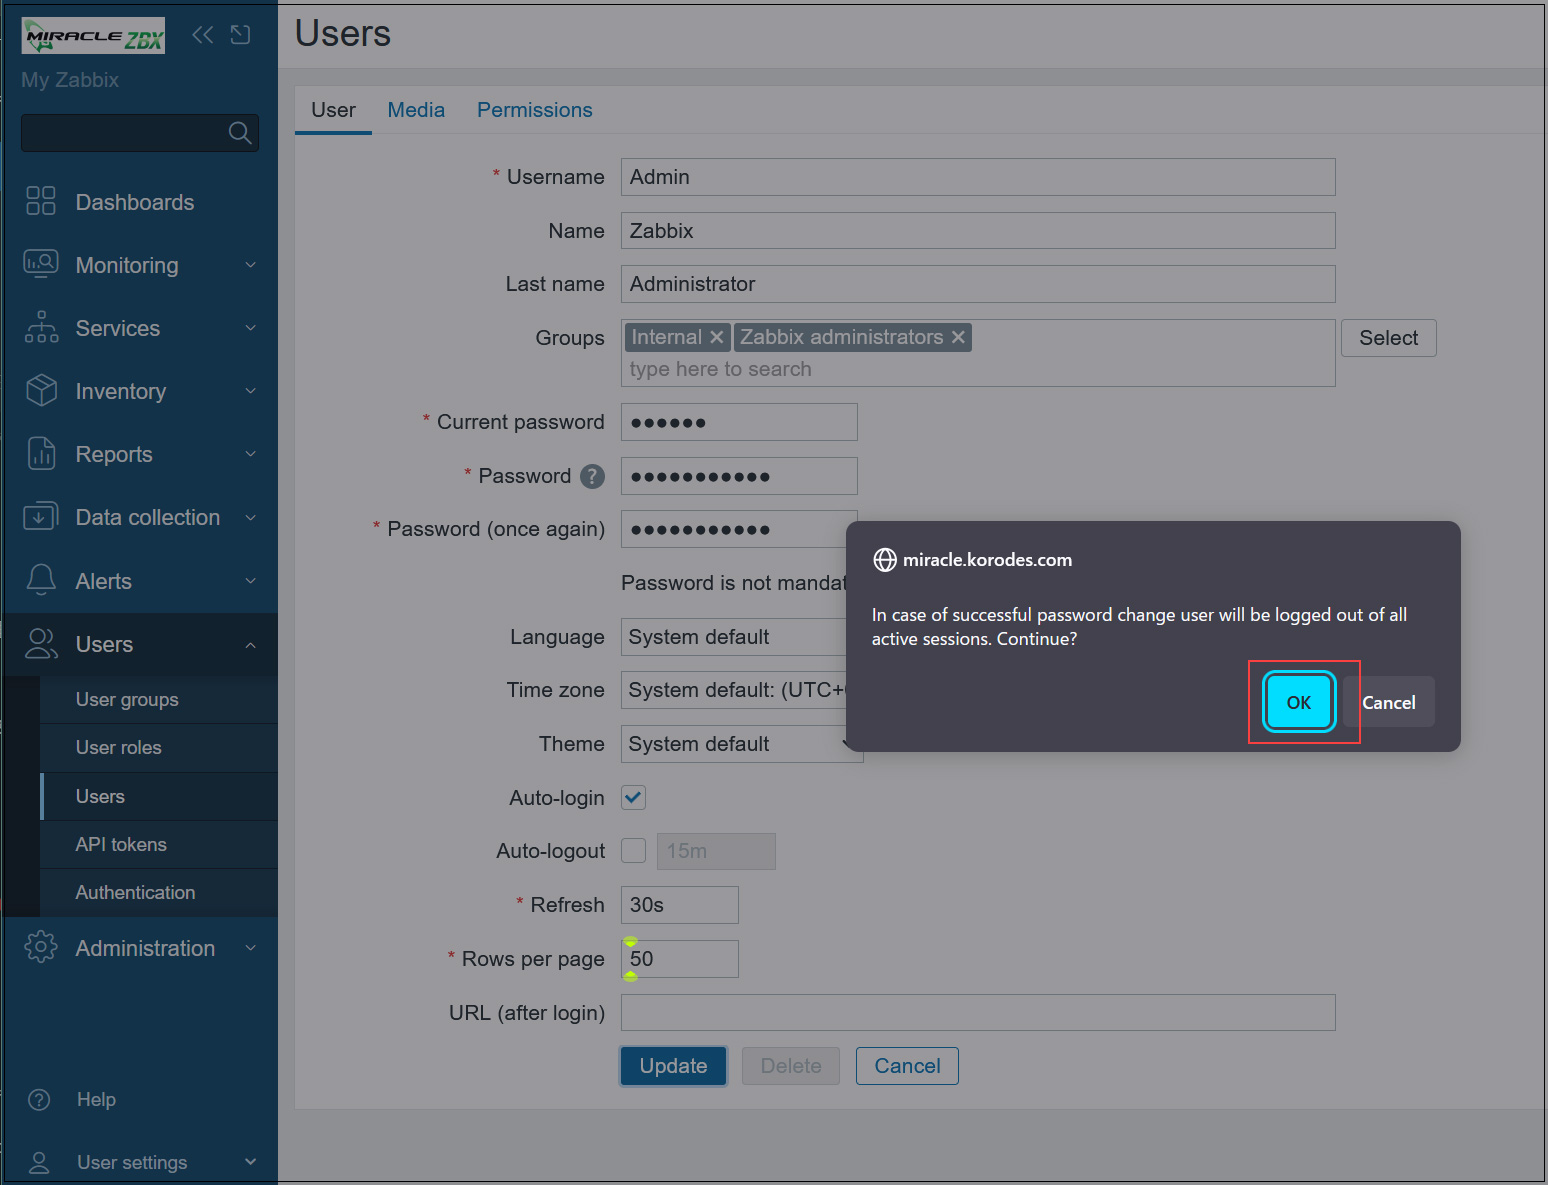
Click "OK" when the following screen appears
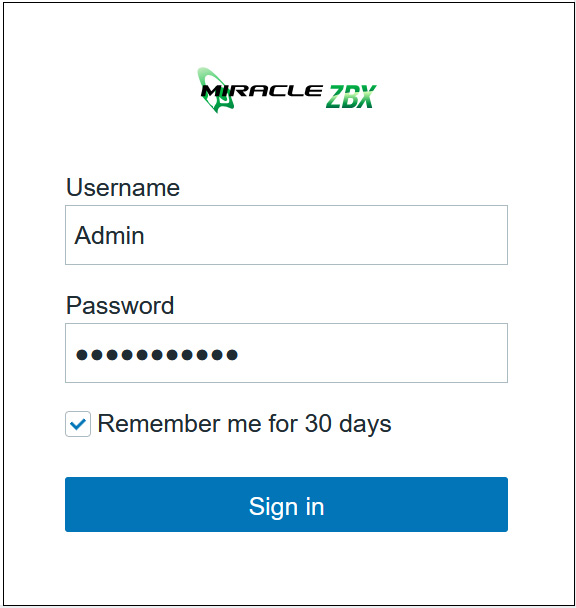
④Redirected to the login screen again.
User name: Admin
Password: Changed password
Enter
6.2Email notification settings
Set up notifications so that you can receive various information, etc. by e-mail.
It is assumed that an SMTP server such as postfix is installed on the server.
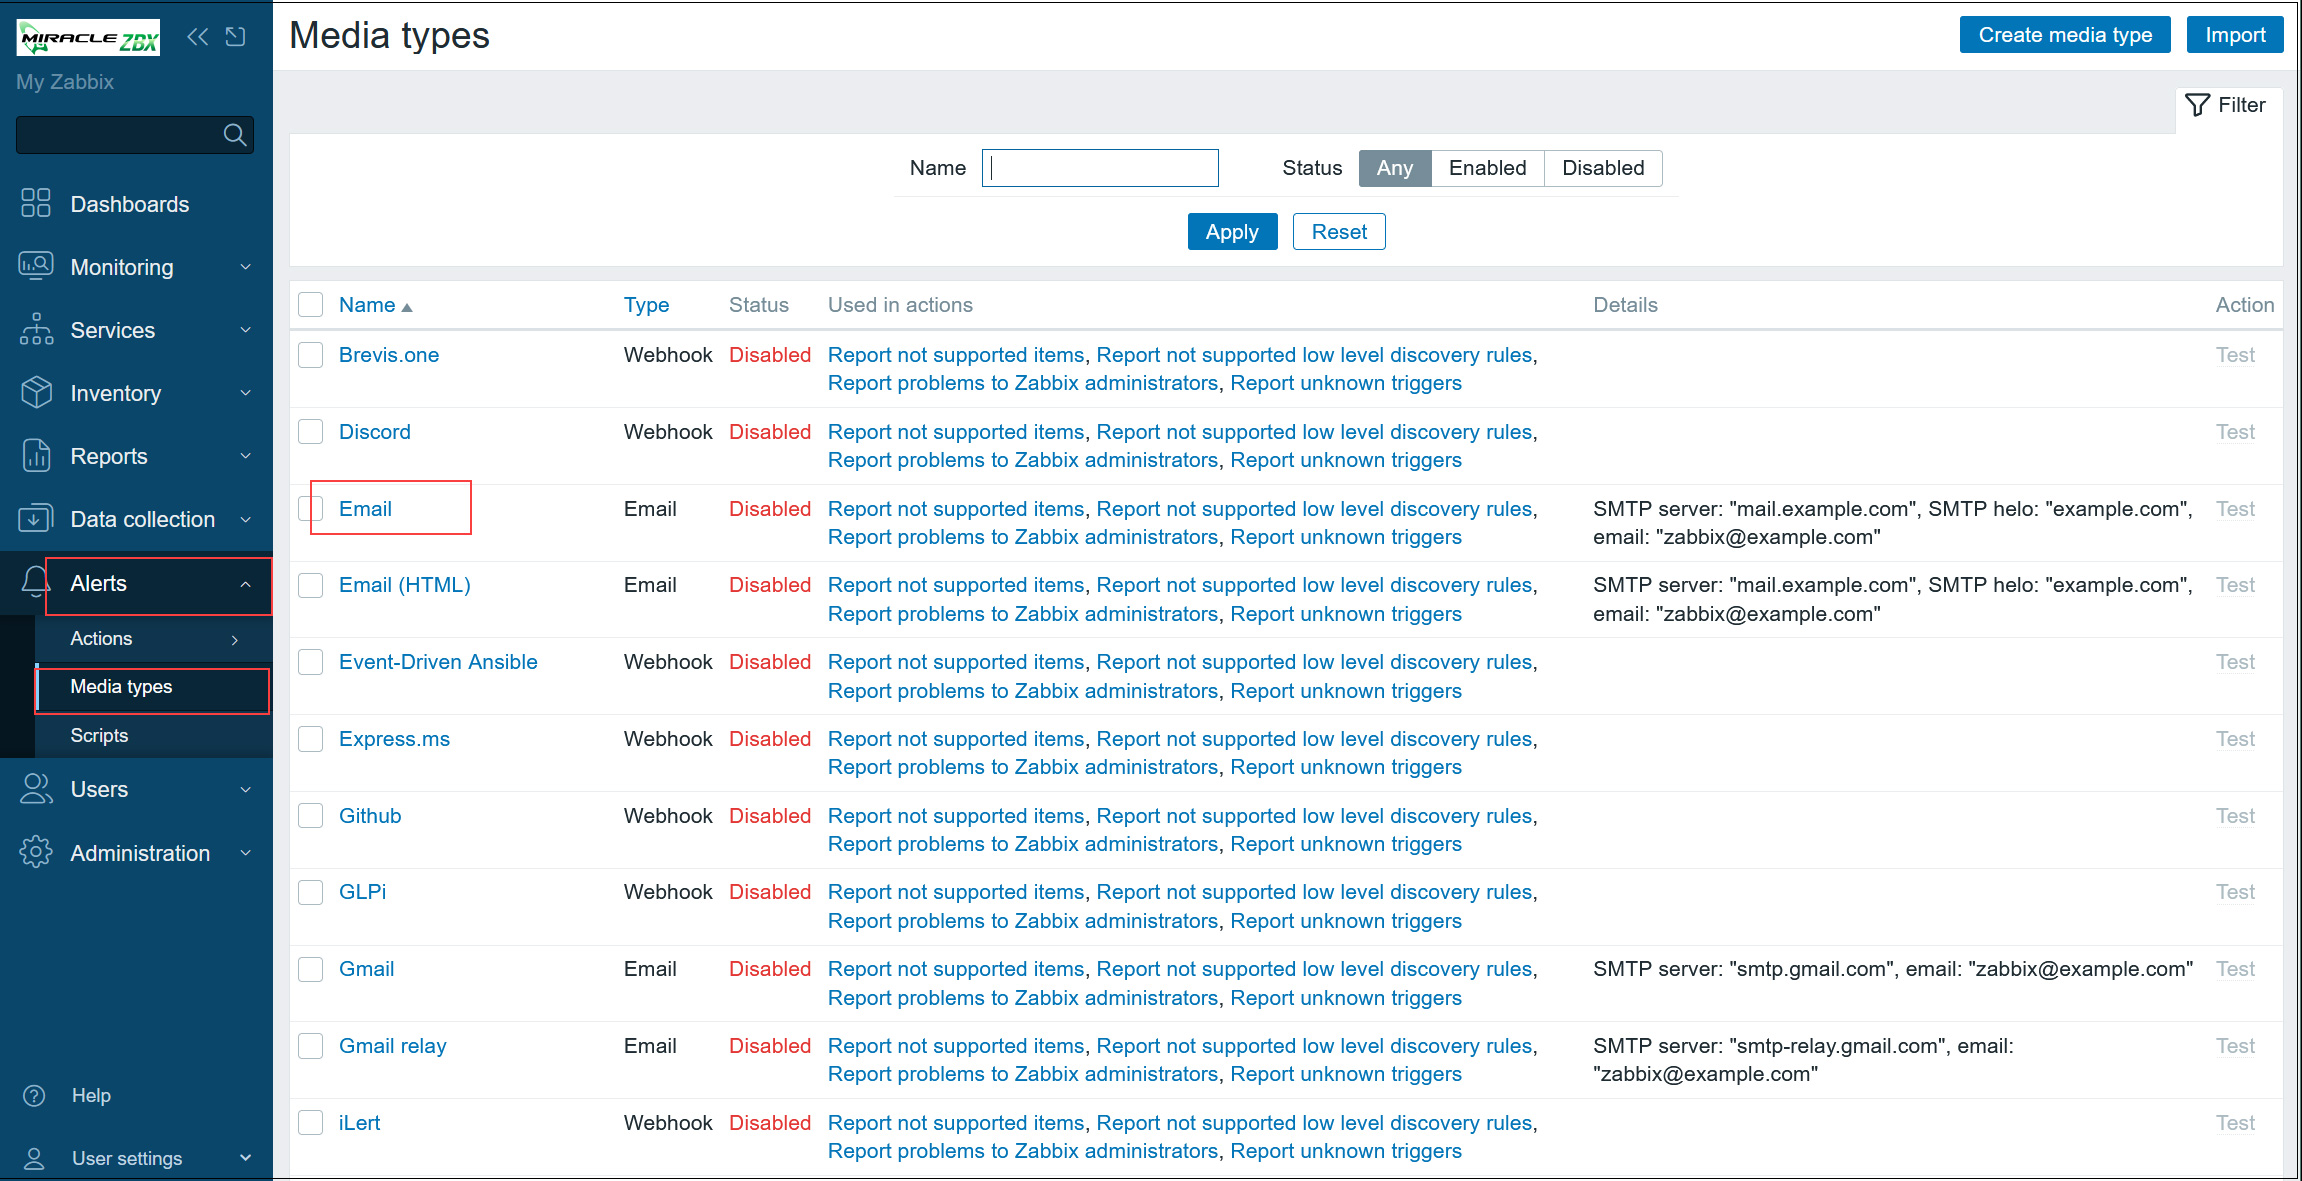
①When the dashboard appears, select "Alerts" - "Media Types" in the left pane and click "Email" in the right pane.
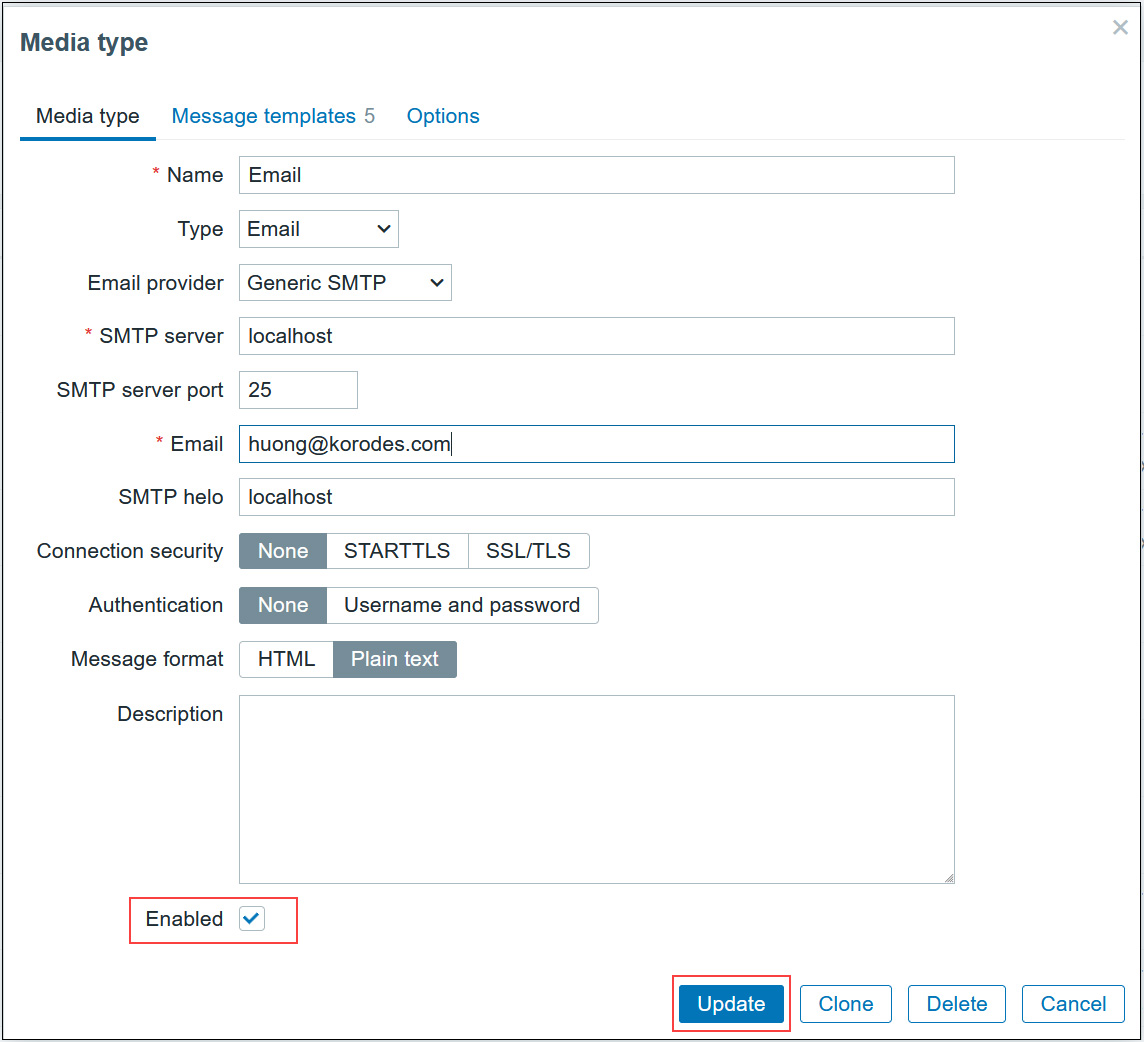
➁Configure the mail server settings as shown below, check the [Enabled] checkbox, and click the [Update] button.
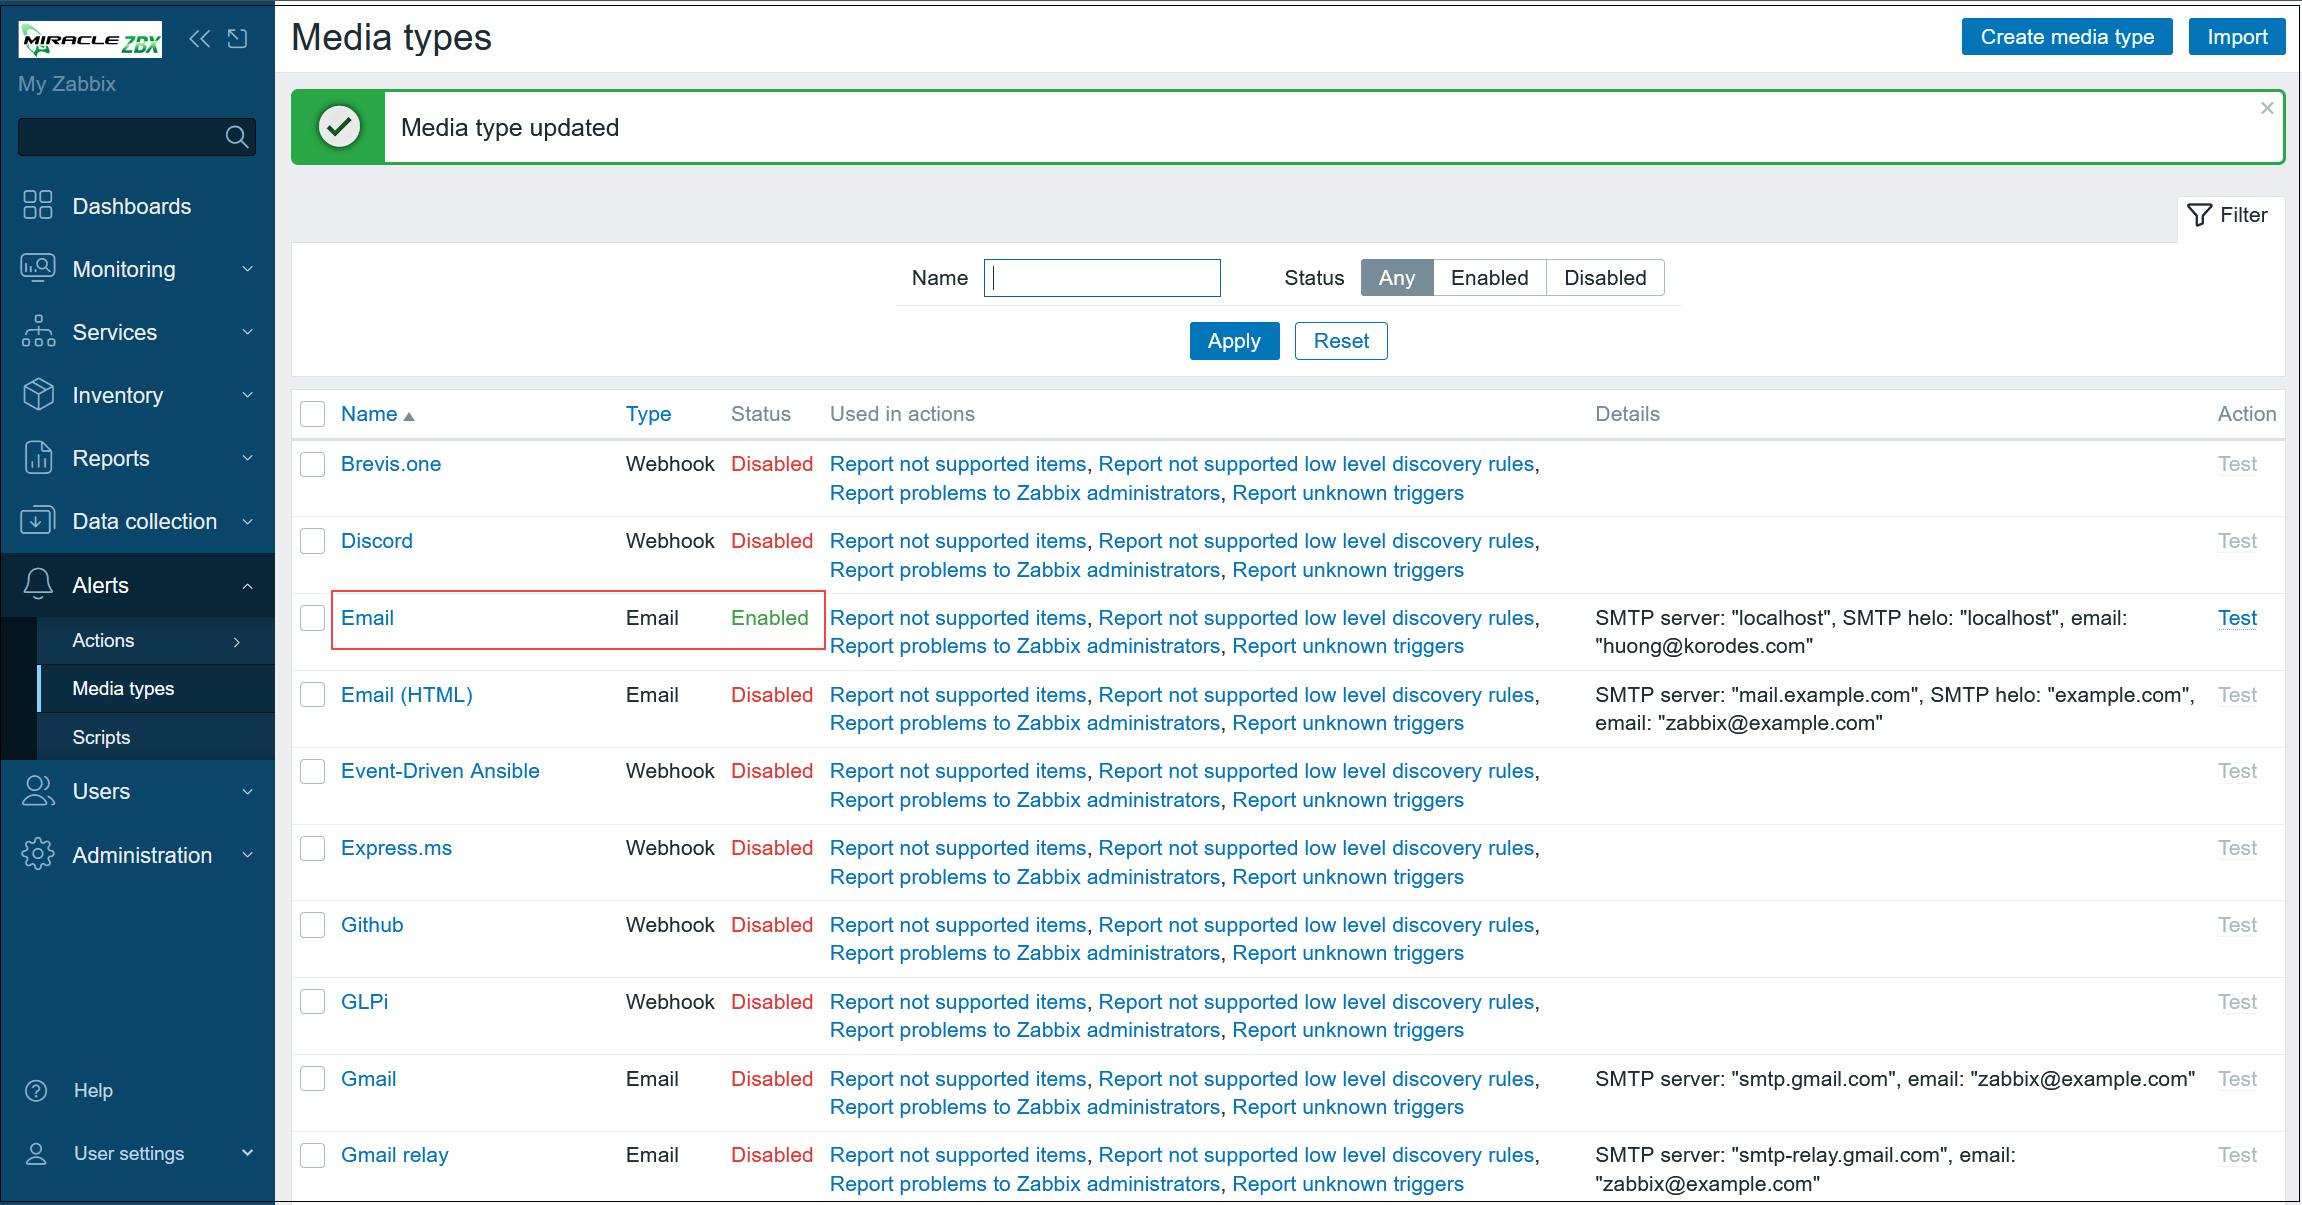
➂[Email] becomes [Enabled]
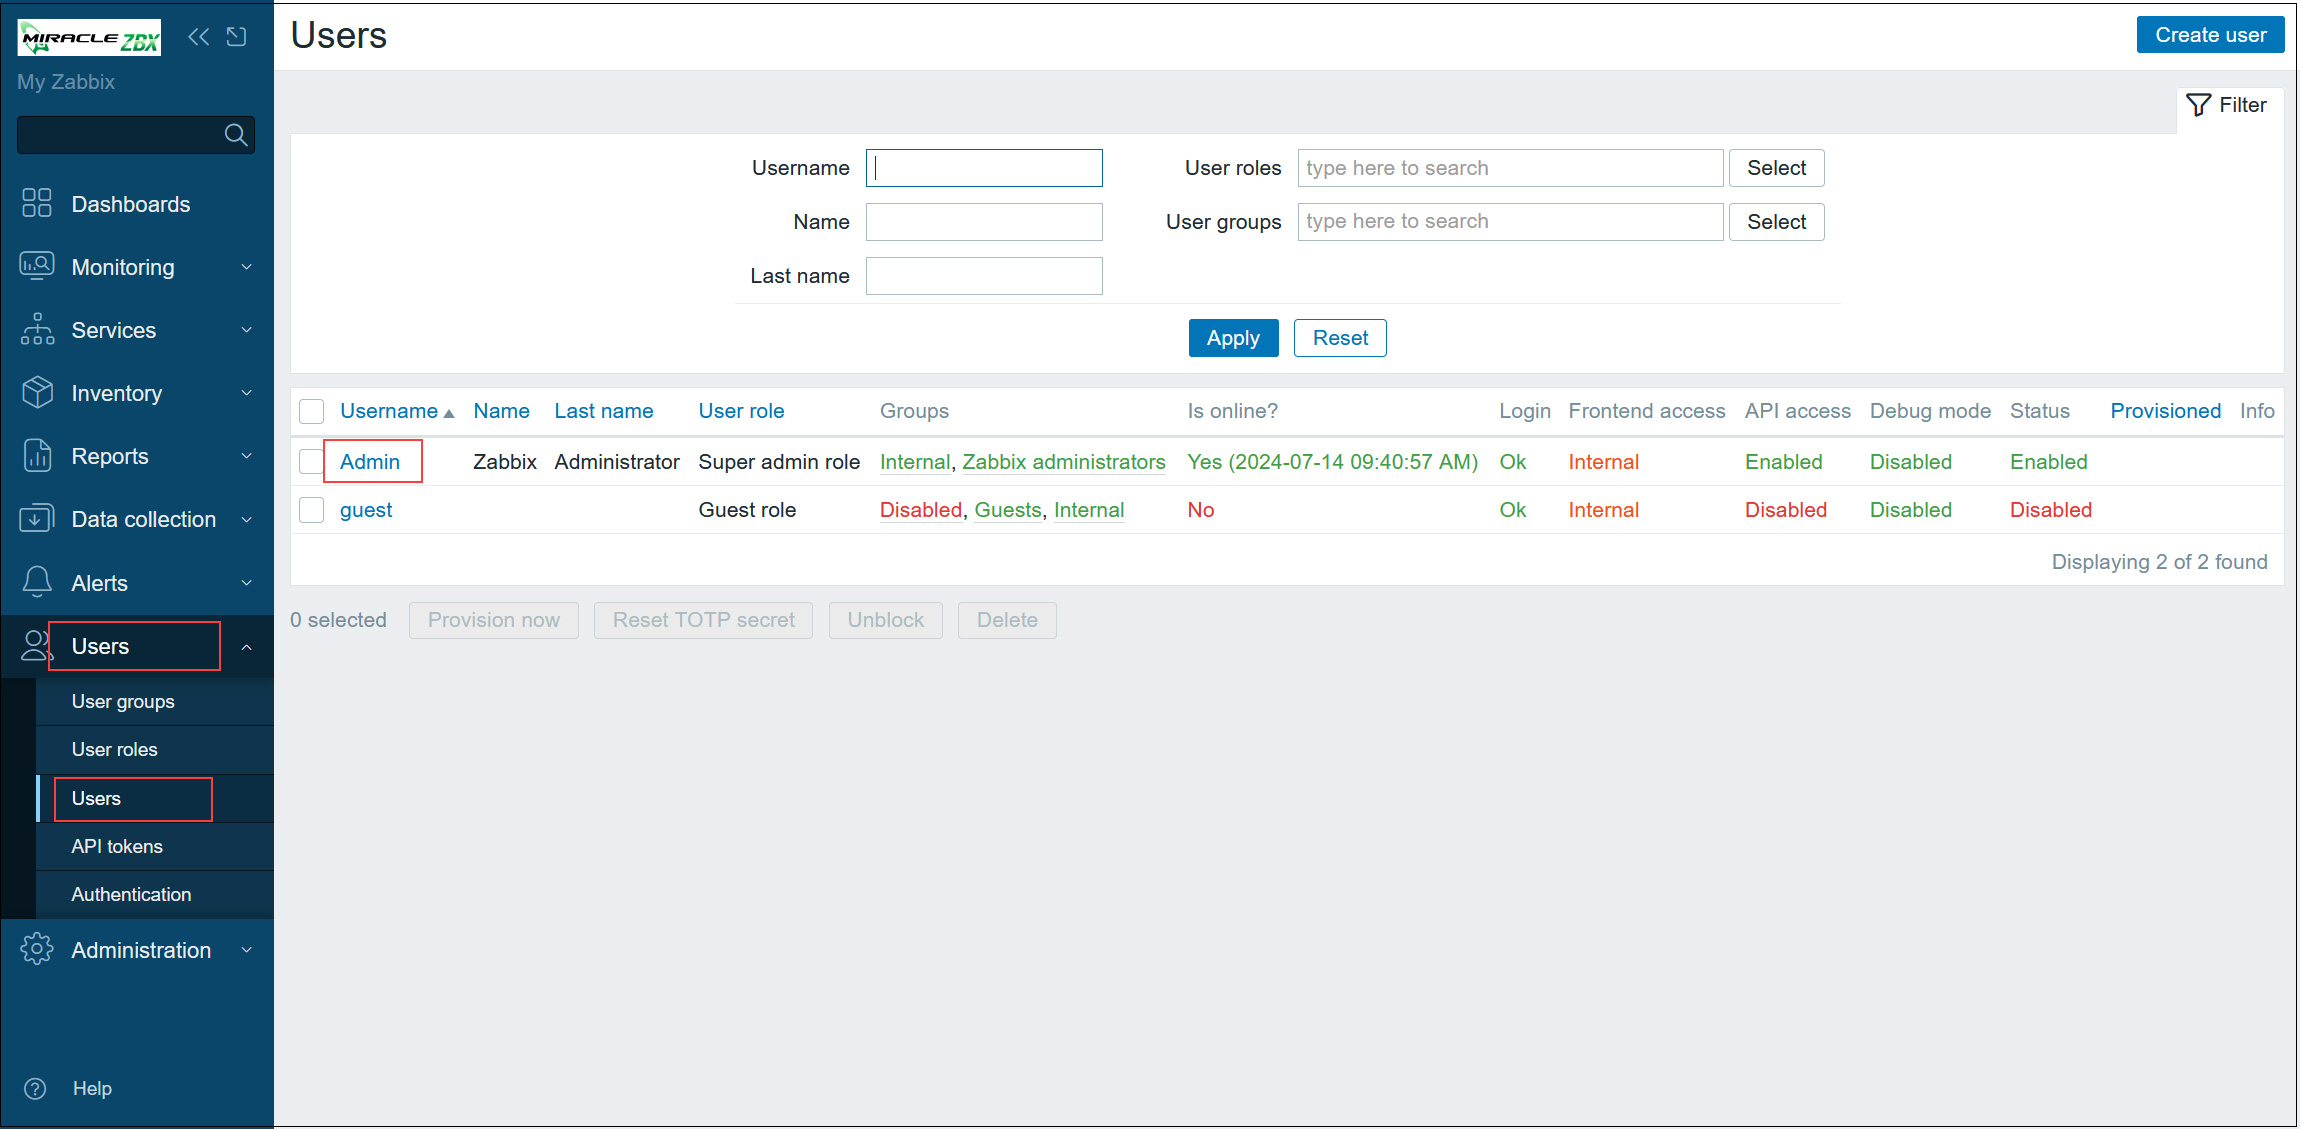
④Select [Users] - [Users] in the left pane and click [Admin] in the right pane
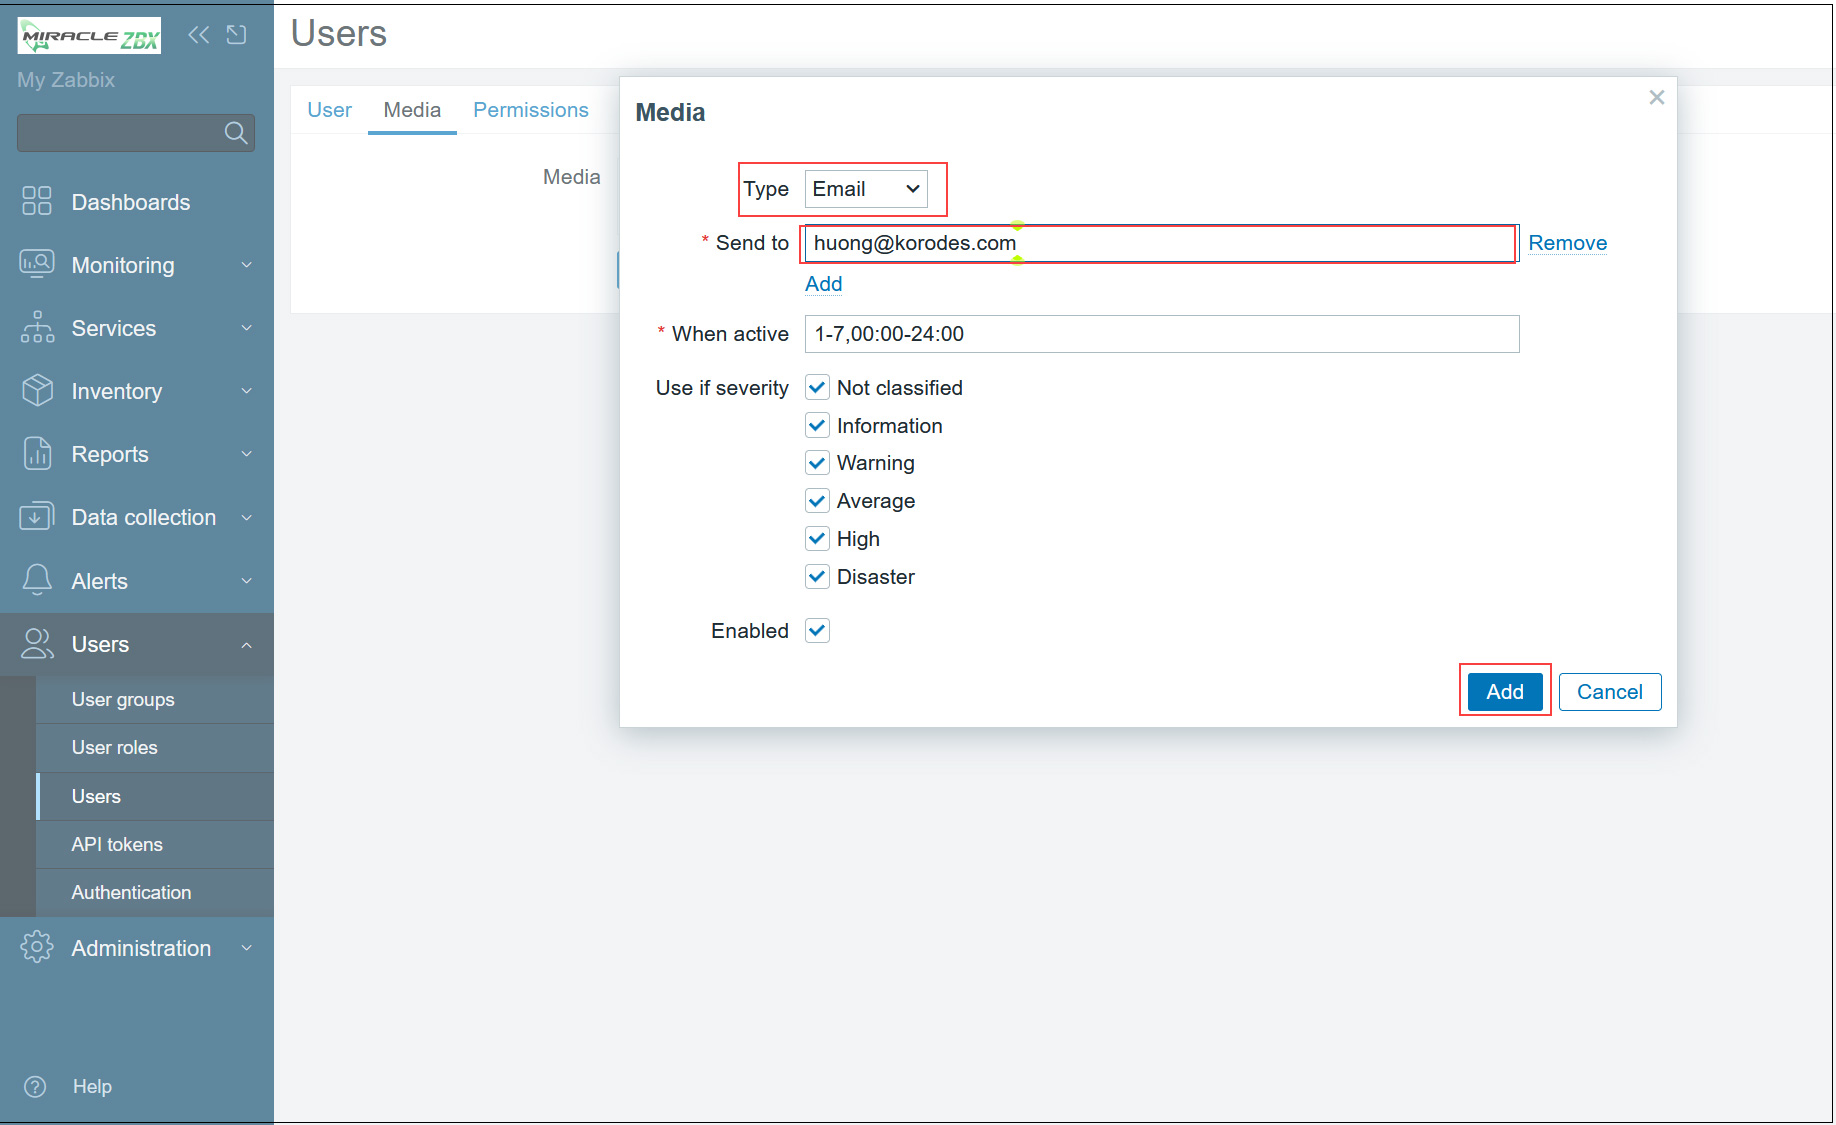
⑤Go to the "Media" tab and click [Add]
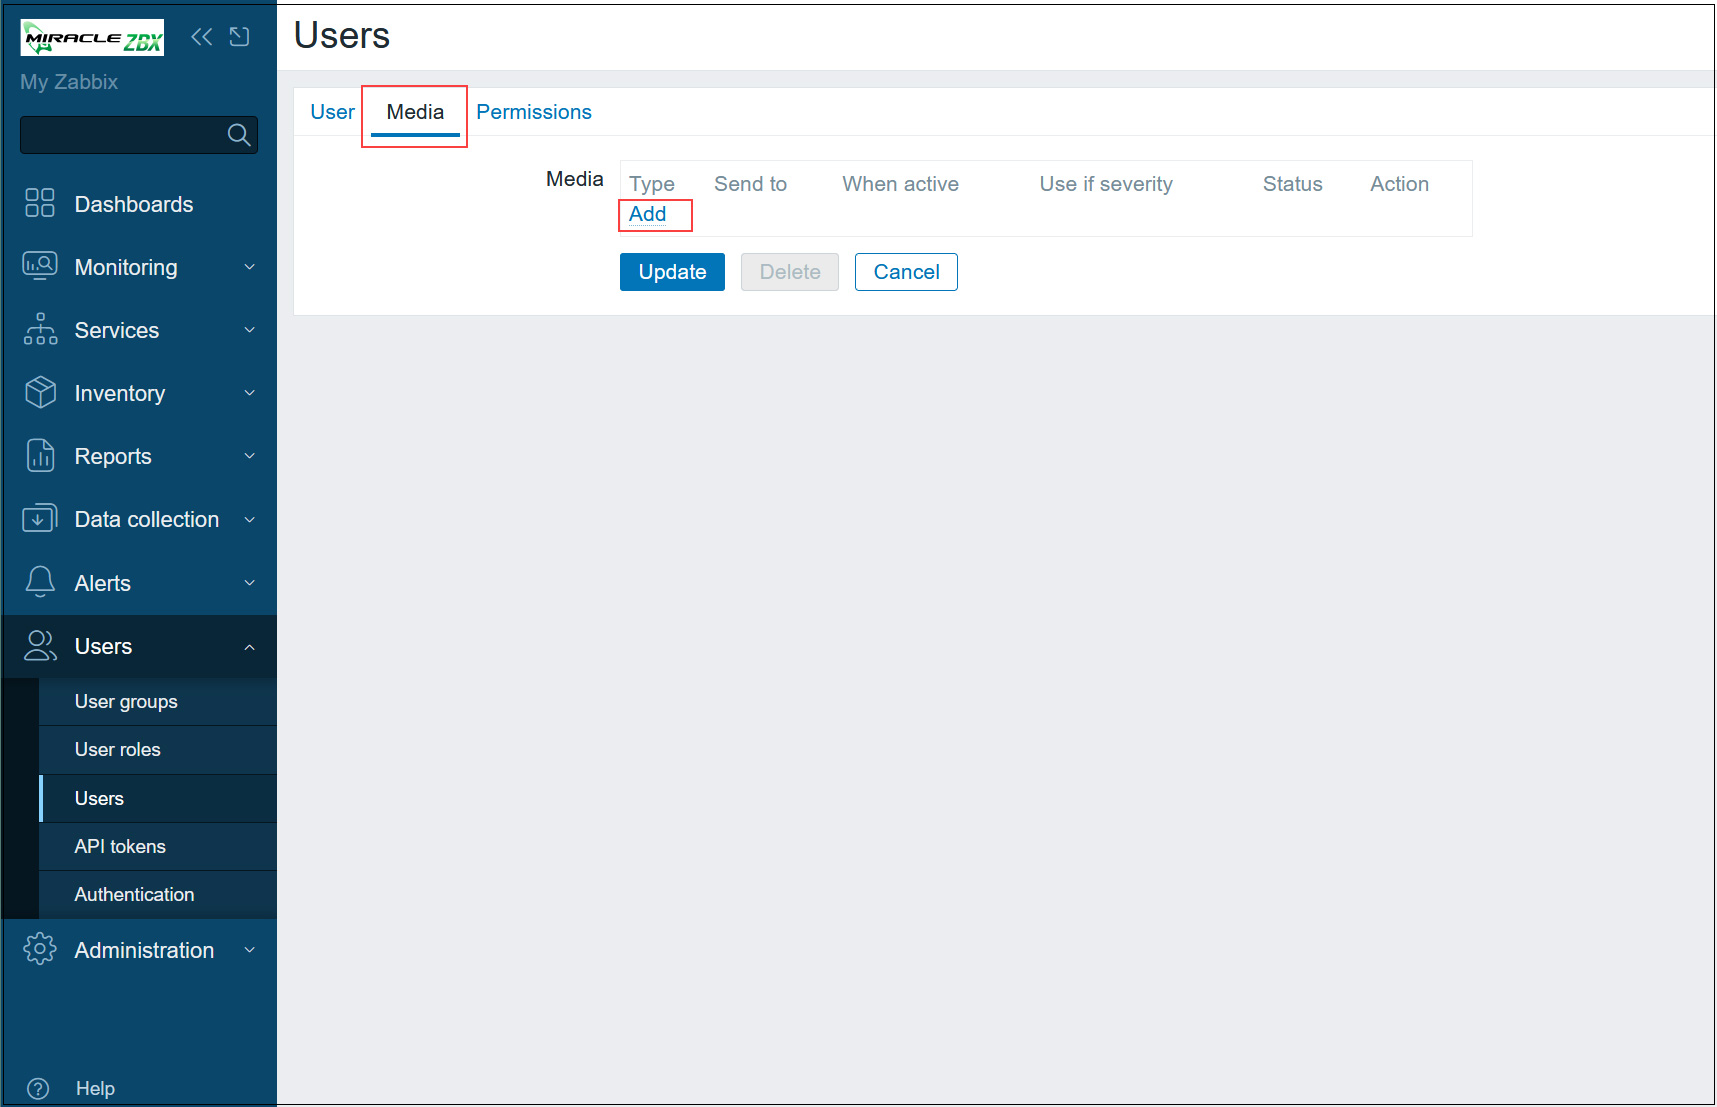
⑥Select "Email" for "Type," enter the administrator's email address in the "Send to" field, and click [Add]
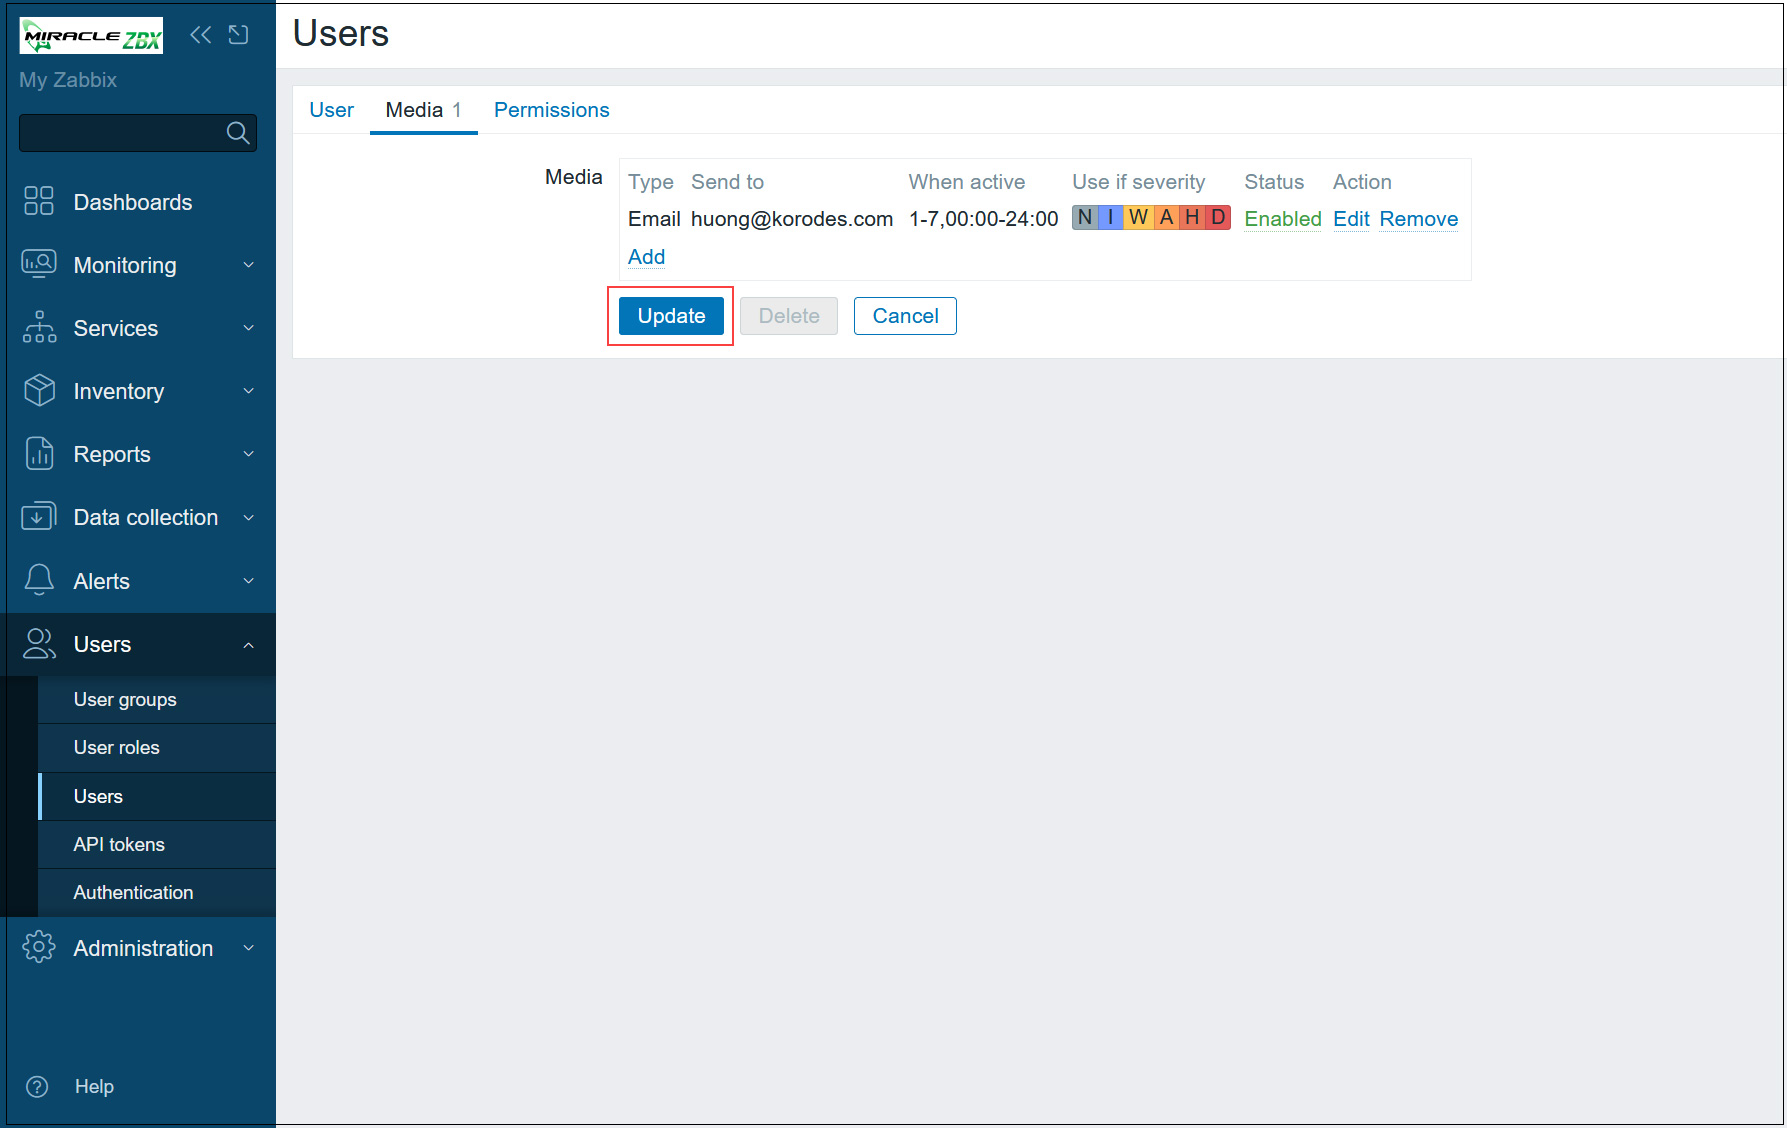
⑦Click the "Update" button.
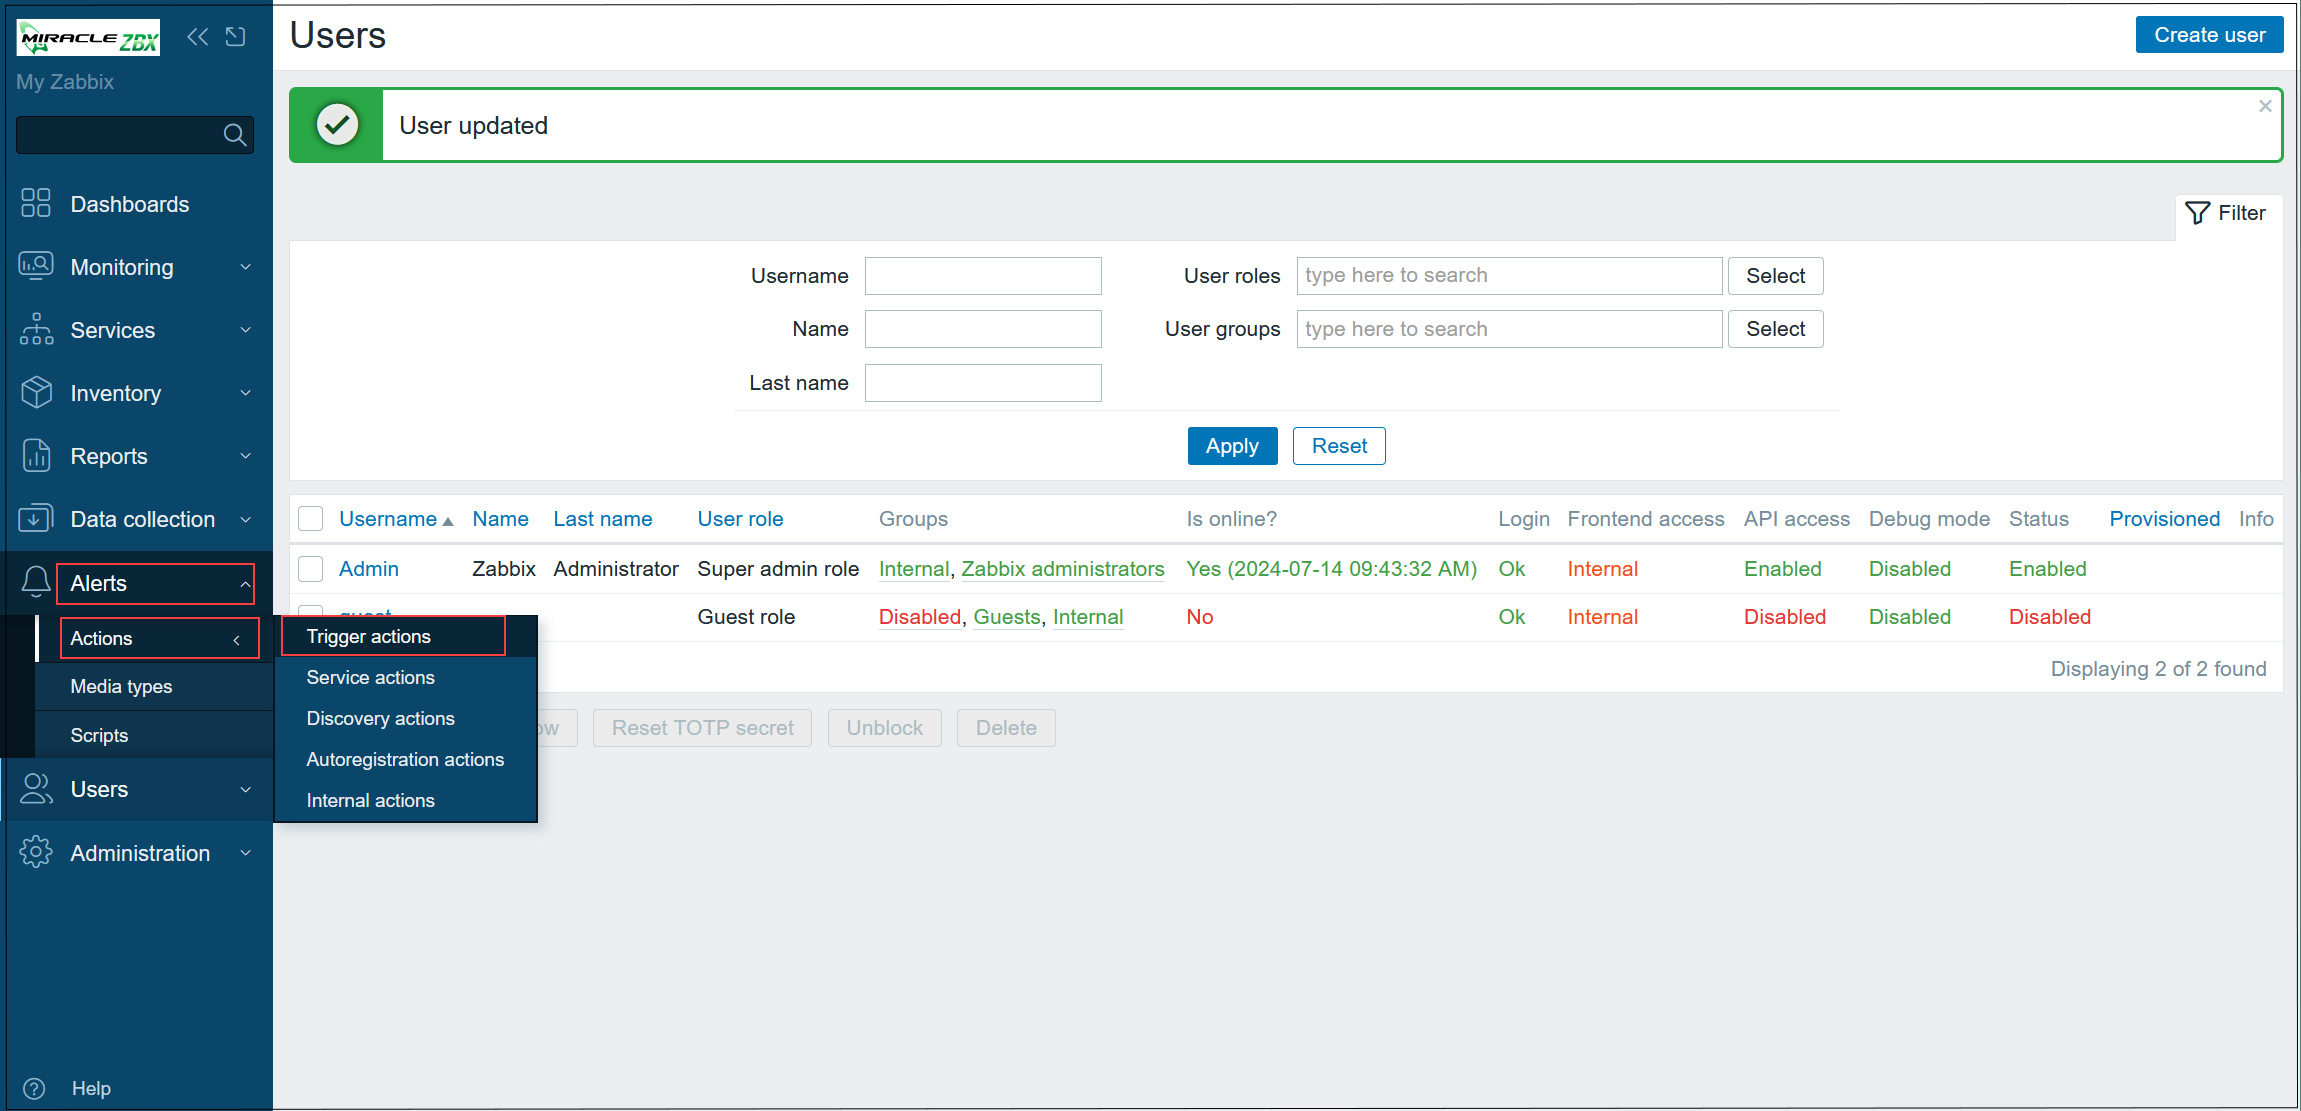
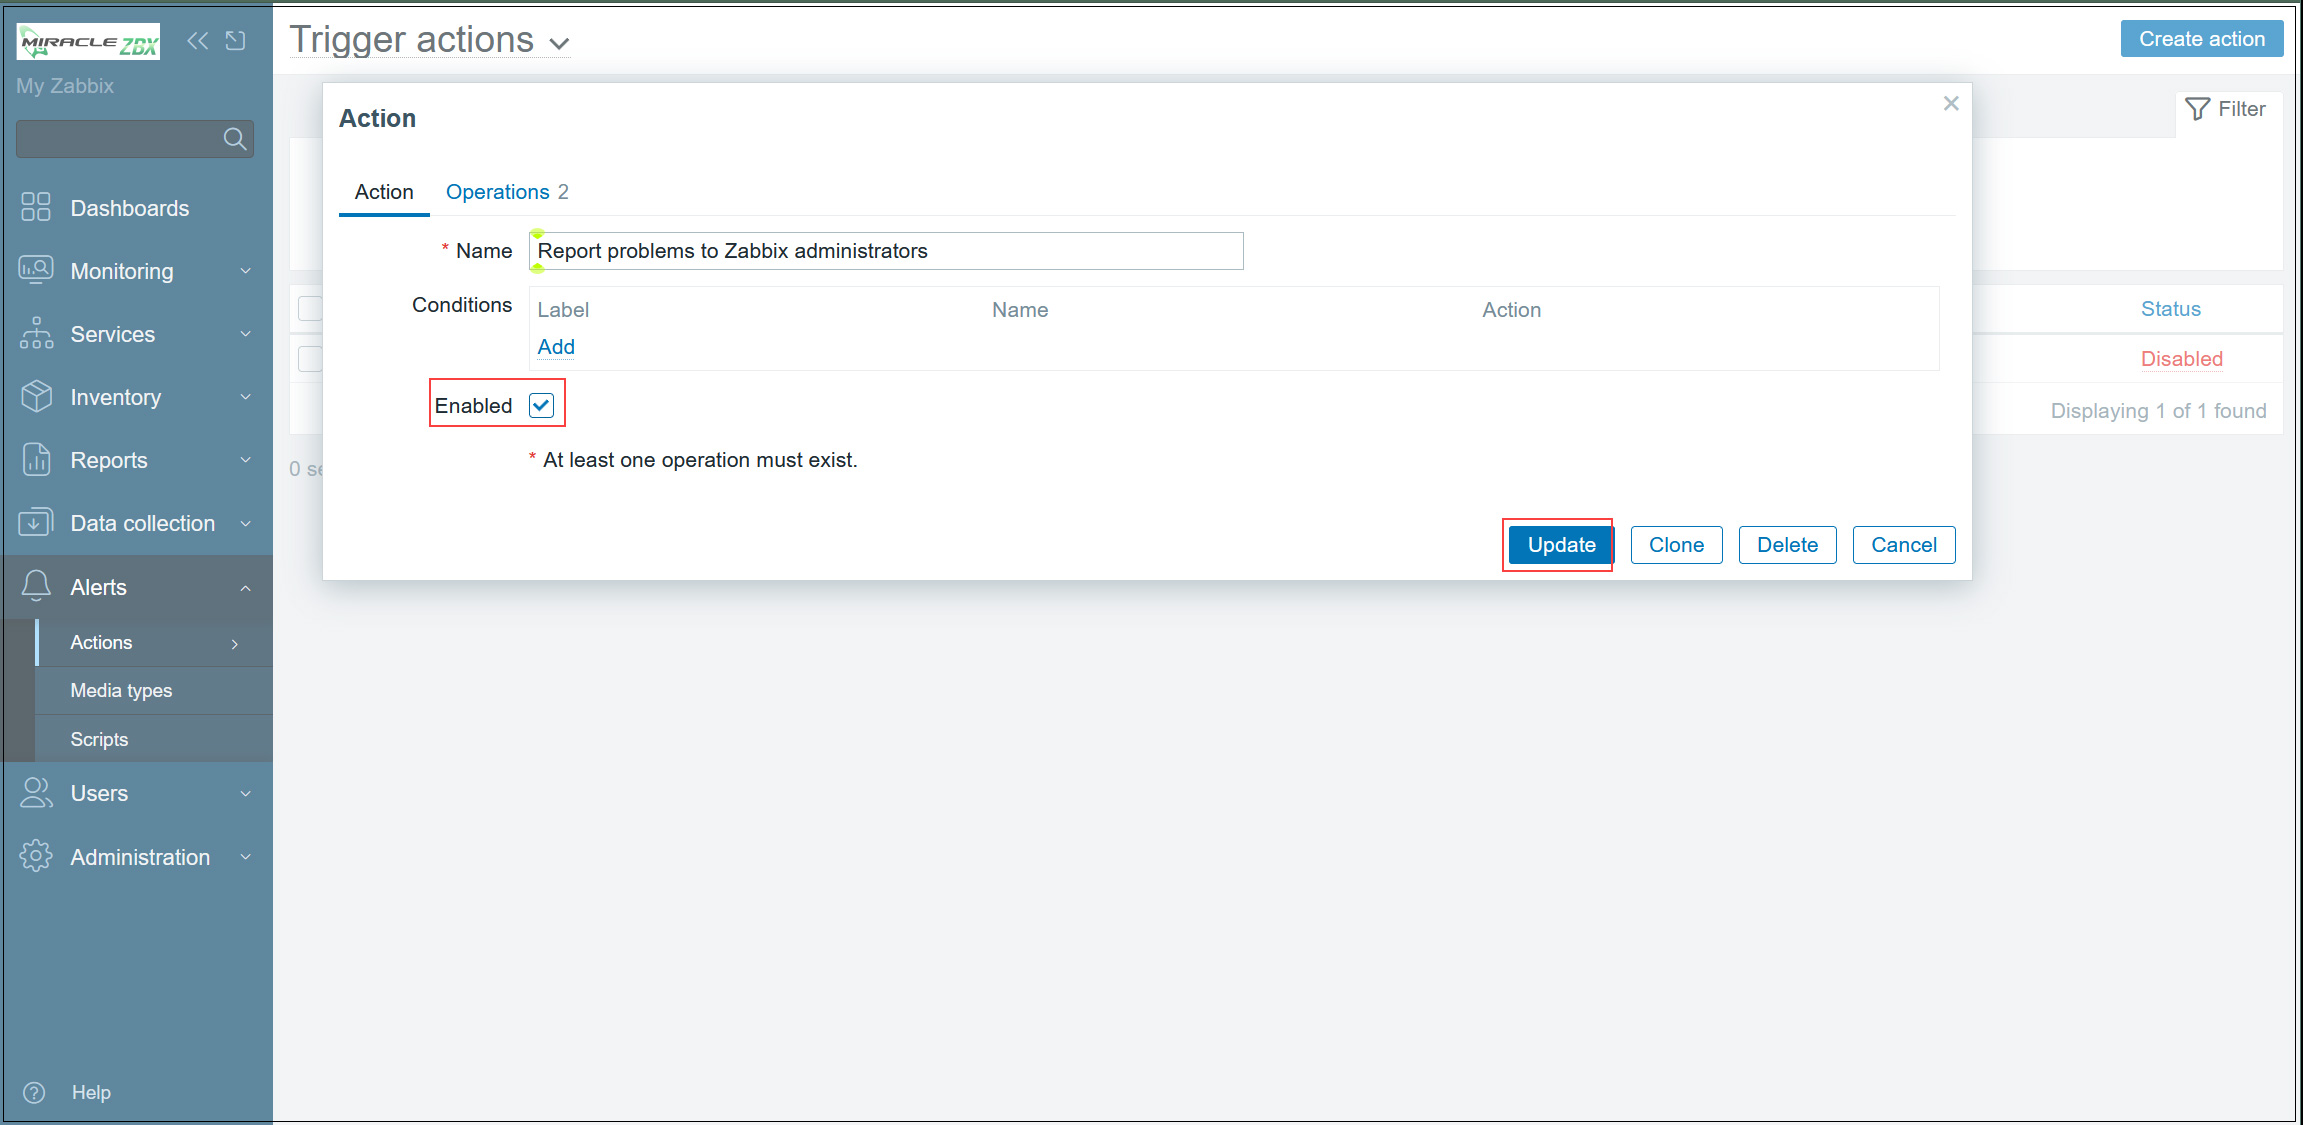
⑧In the left pane, click [Alerts] - [Actions] - [Trigger actions]
⑨In the right pane, click on [Report problems to Zabbix administrators]
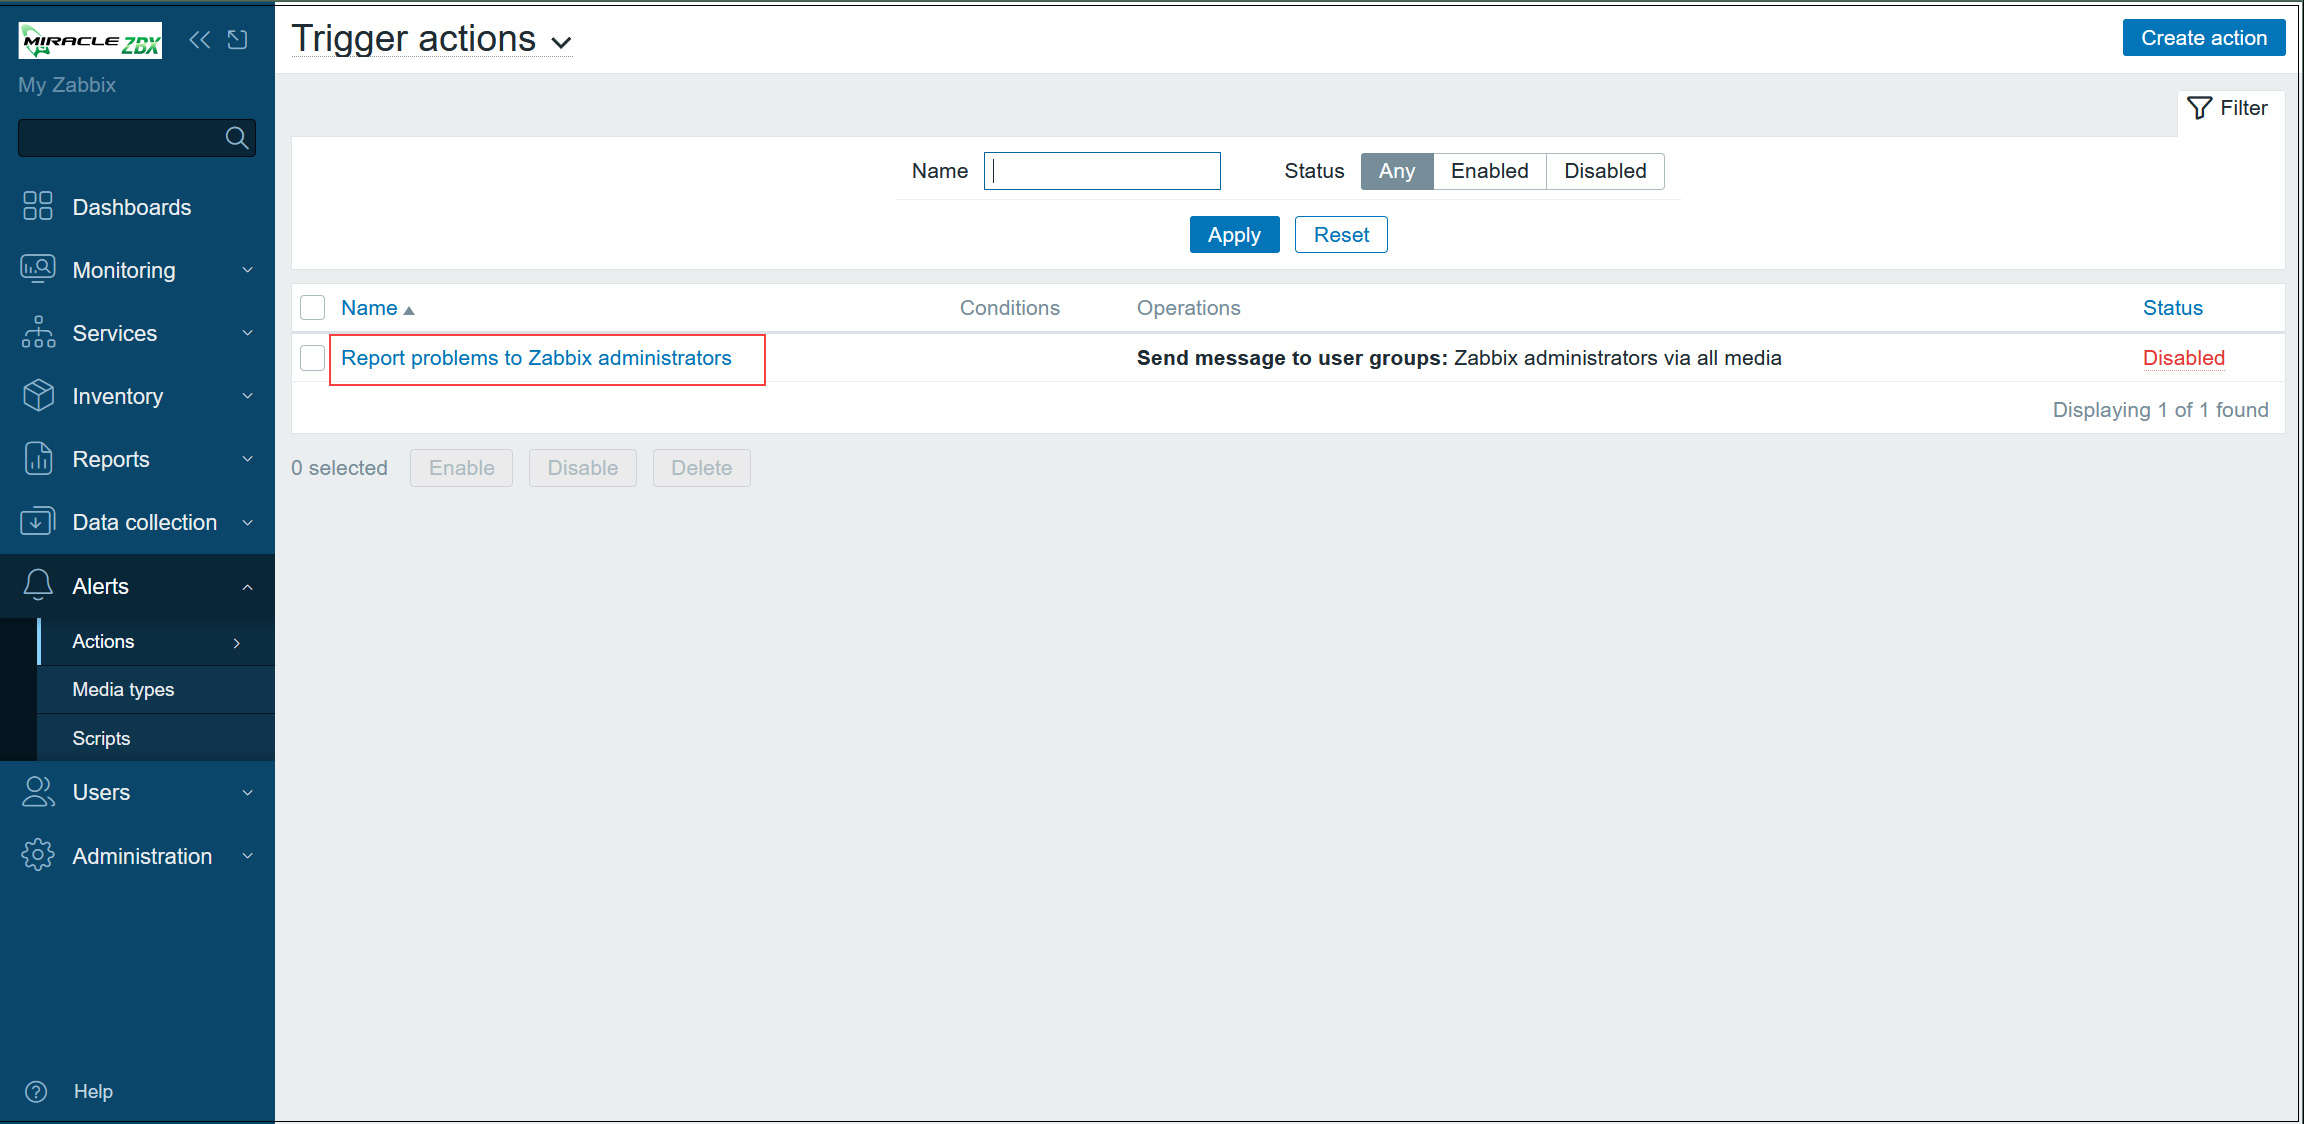
⑩Check [Enabled] and click [Update] button.
Various failure notifications are then sent to the email address you set.
7.Confirmation of MIRACLE ZBX startup
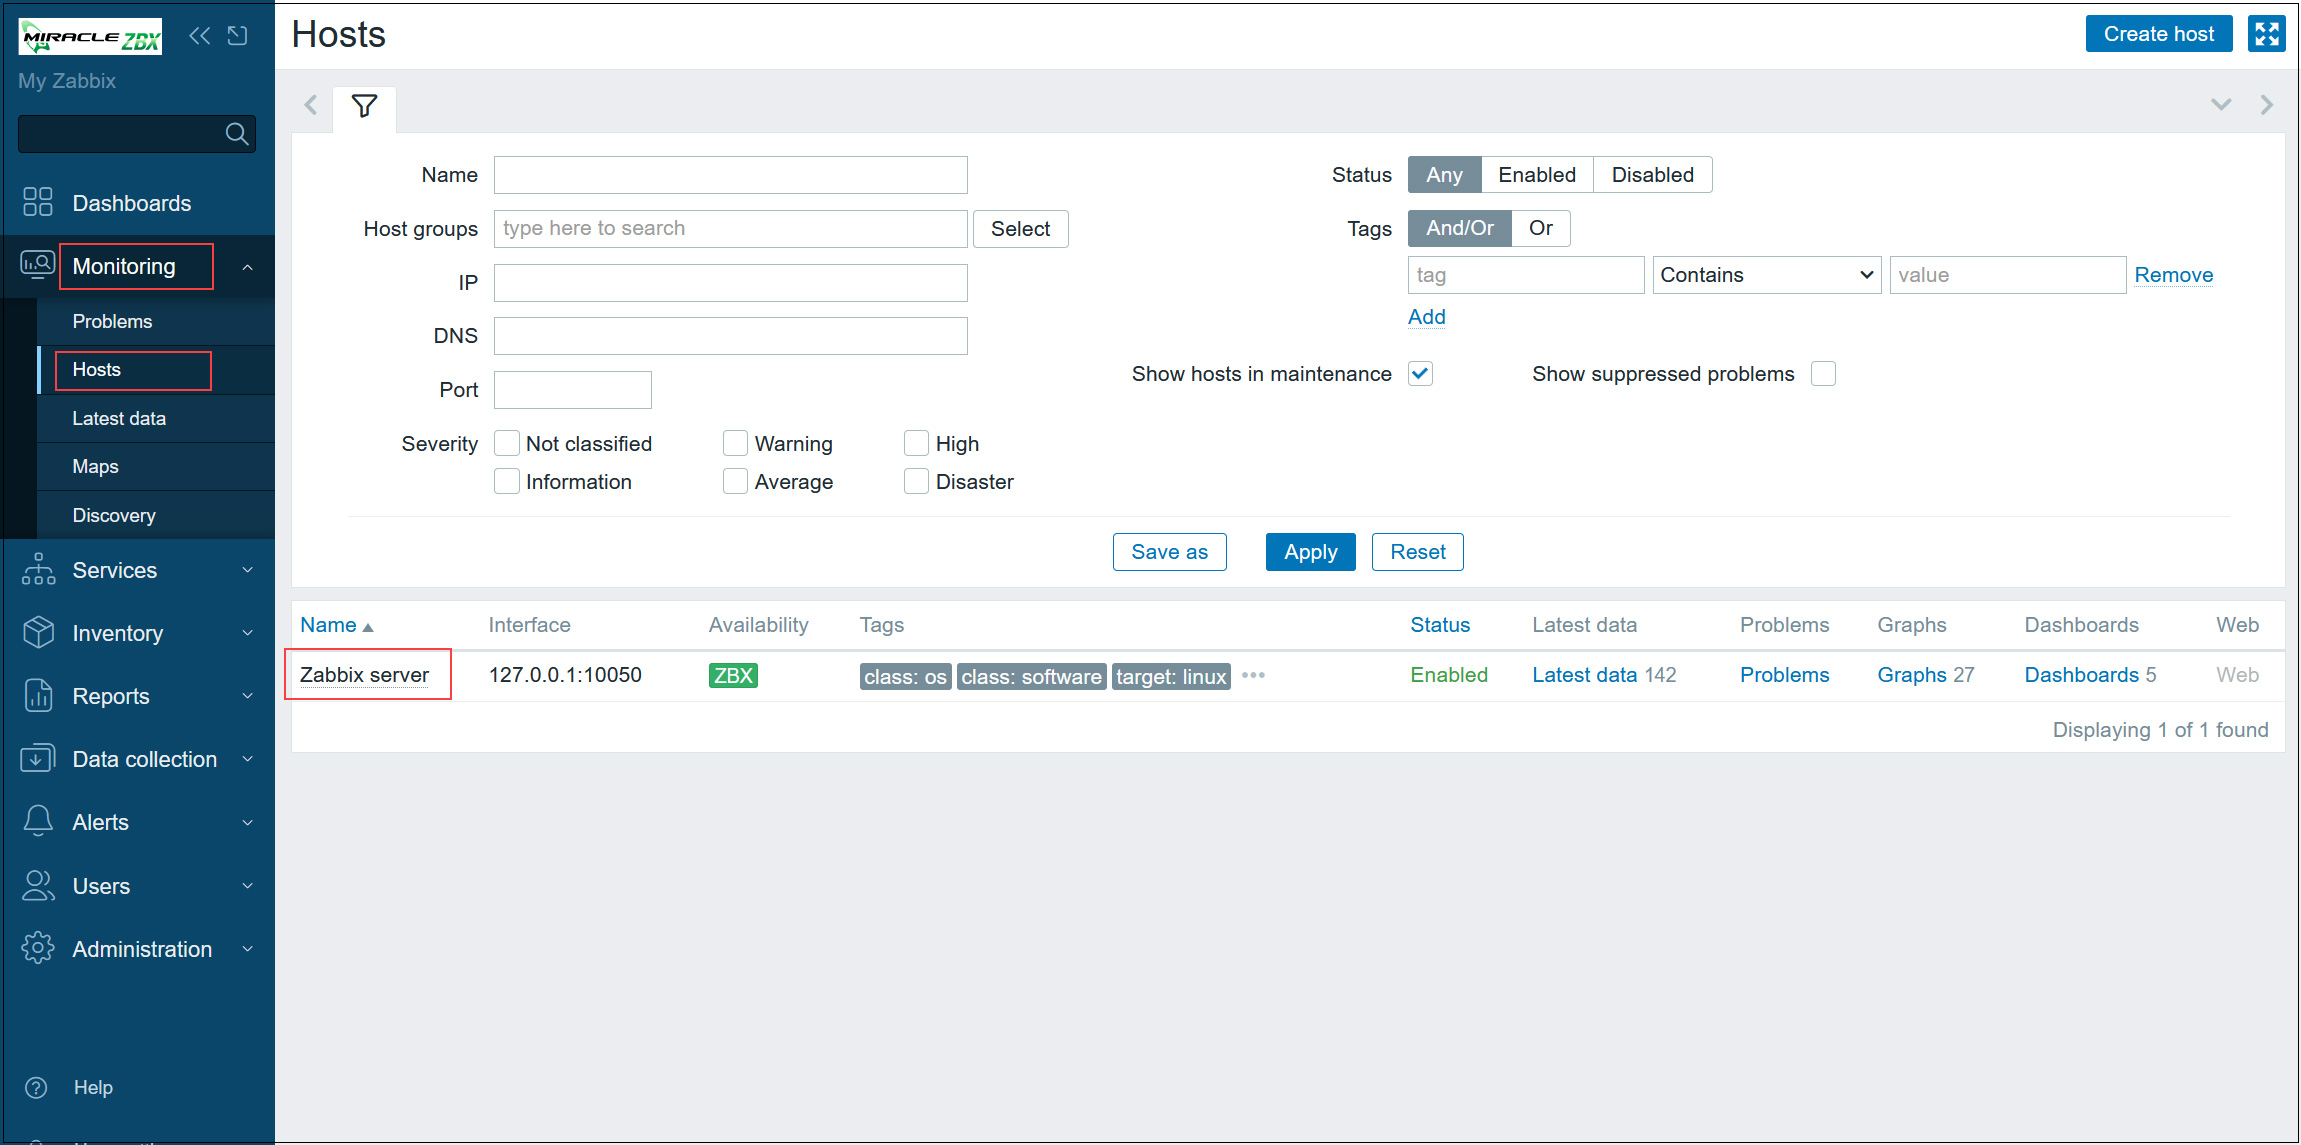
①Clicking on [Monitoring] [Hosts] in the left pane currently shows only [Zabbix server]
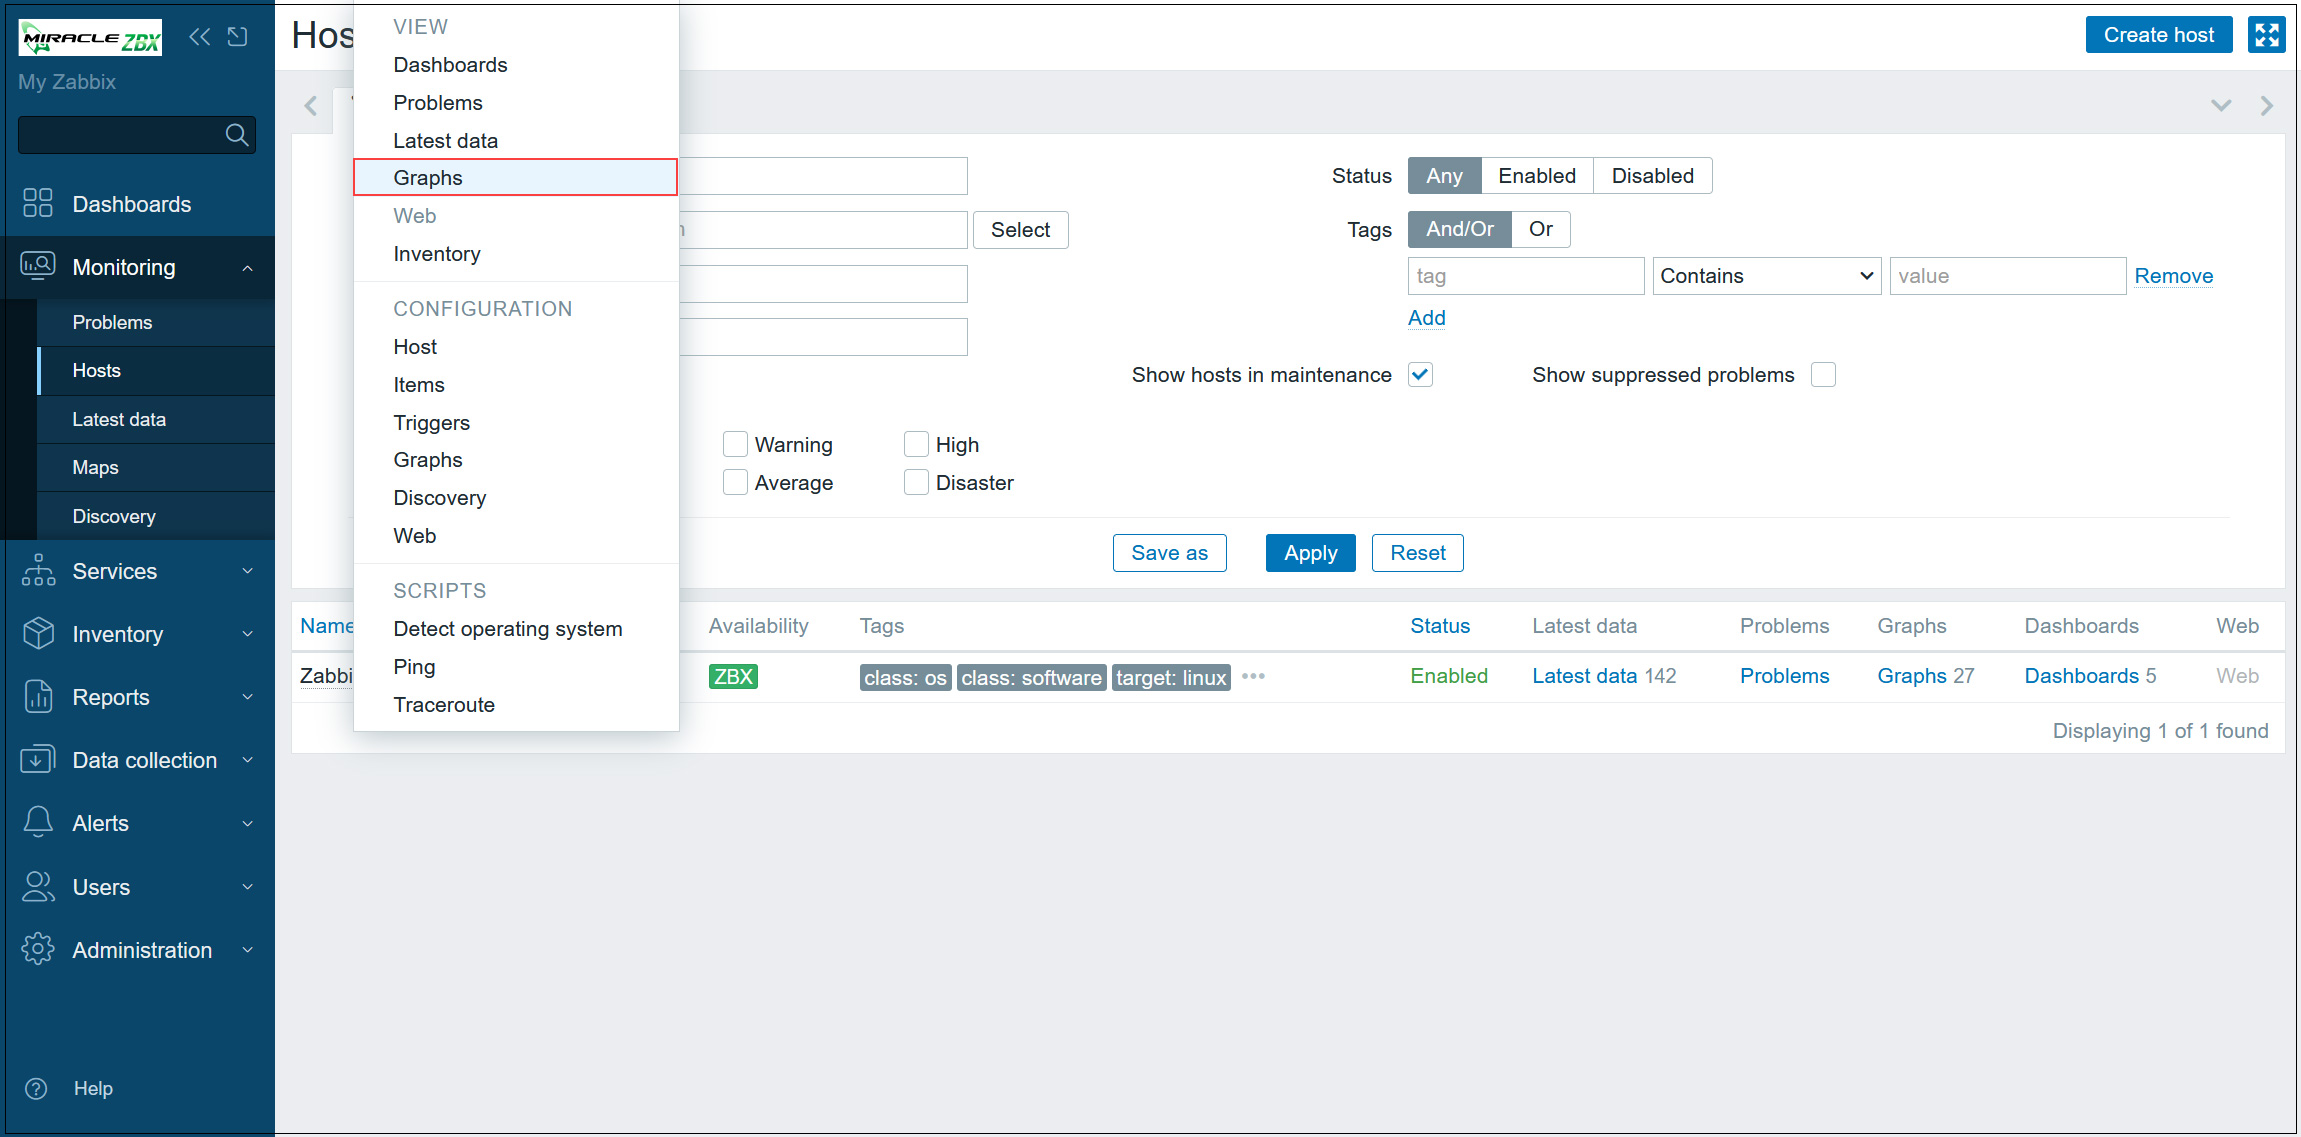
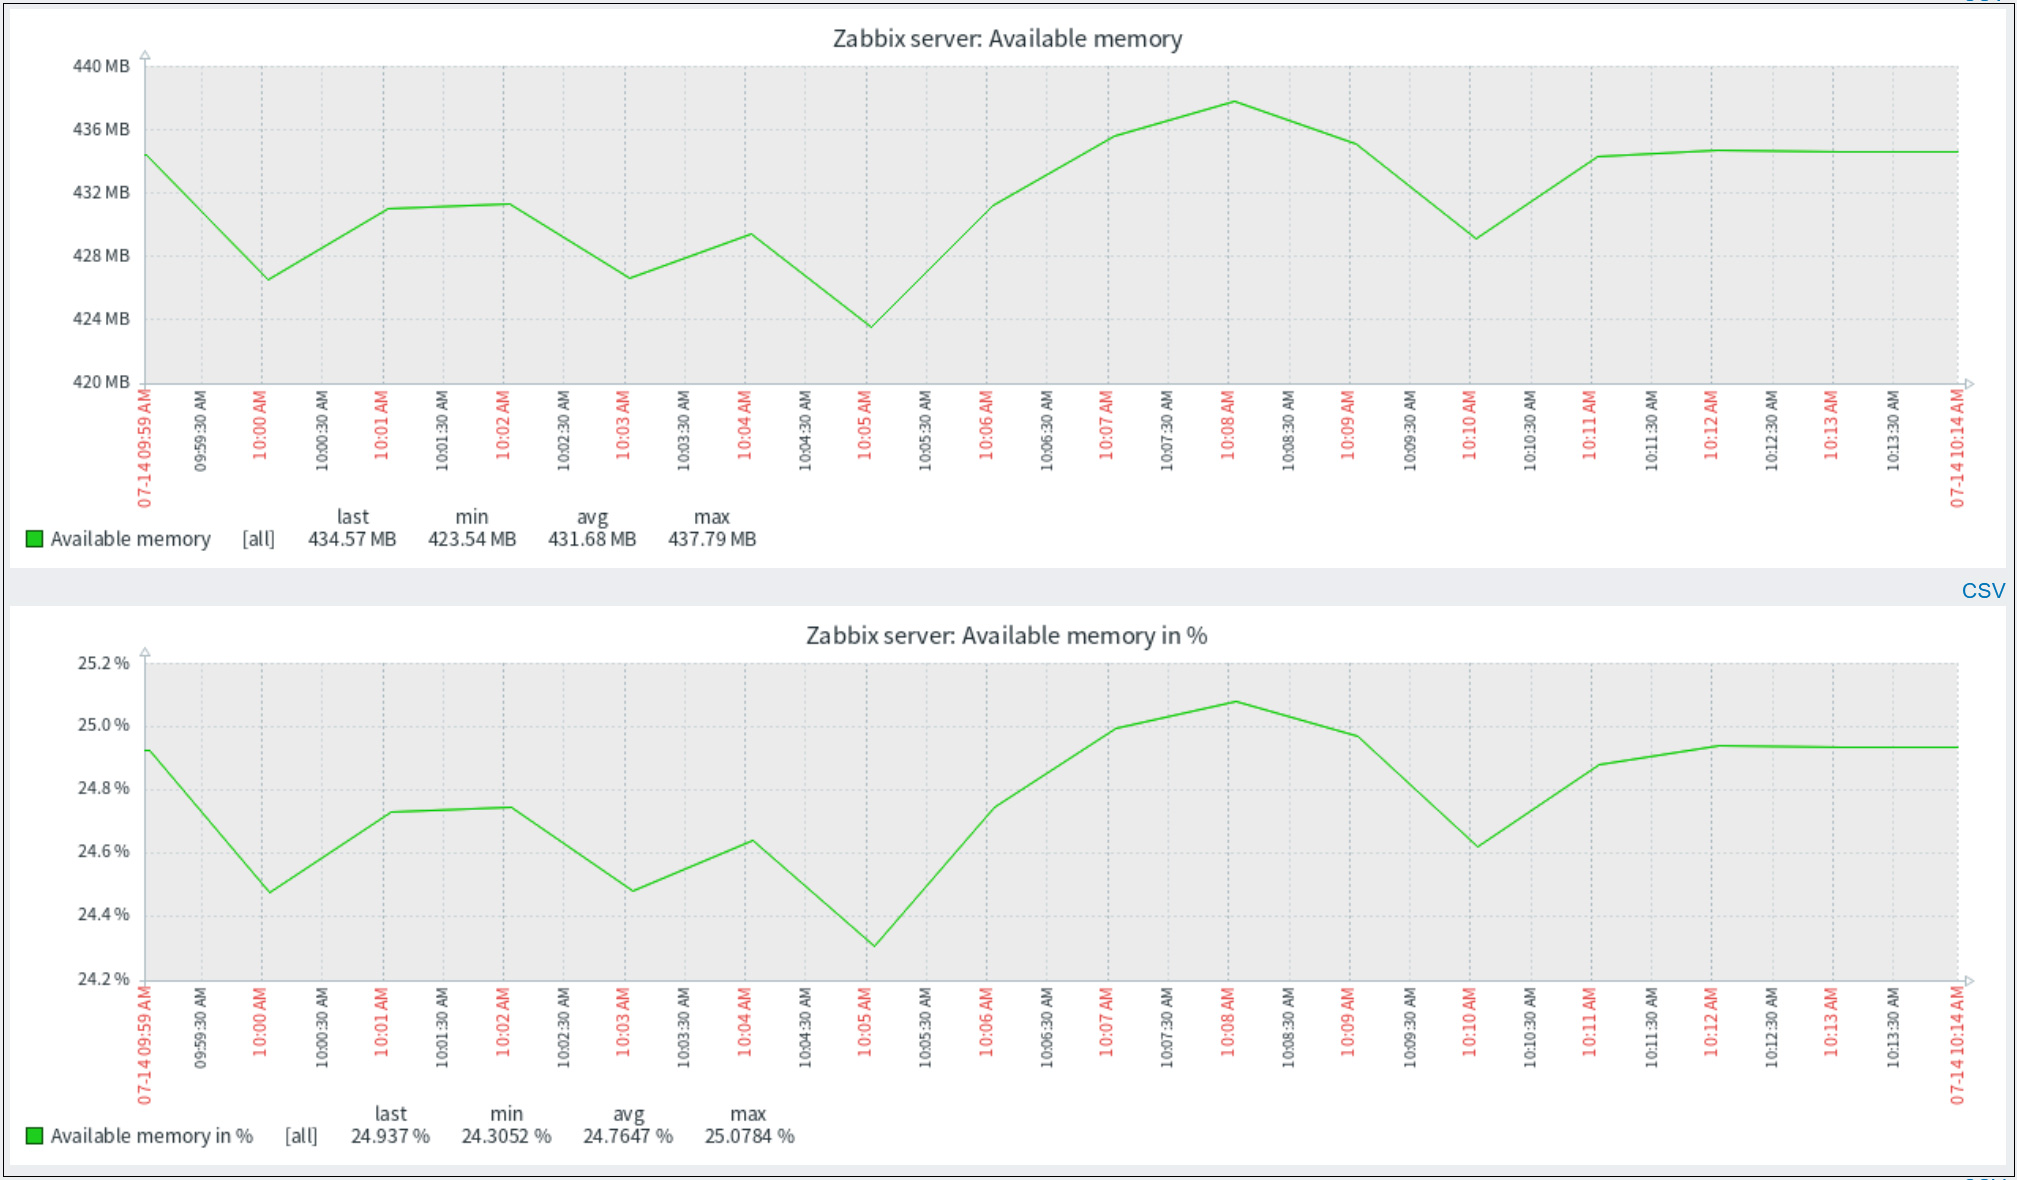
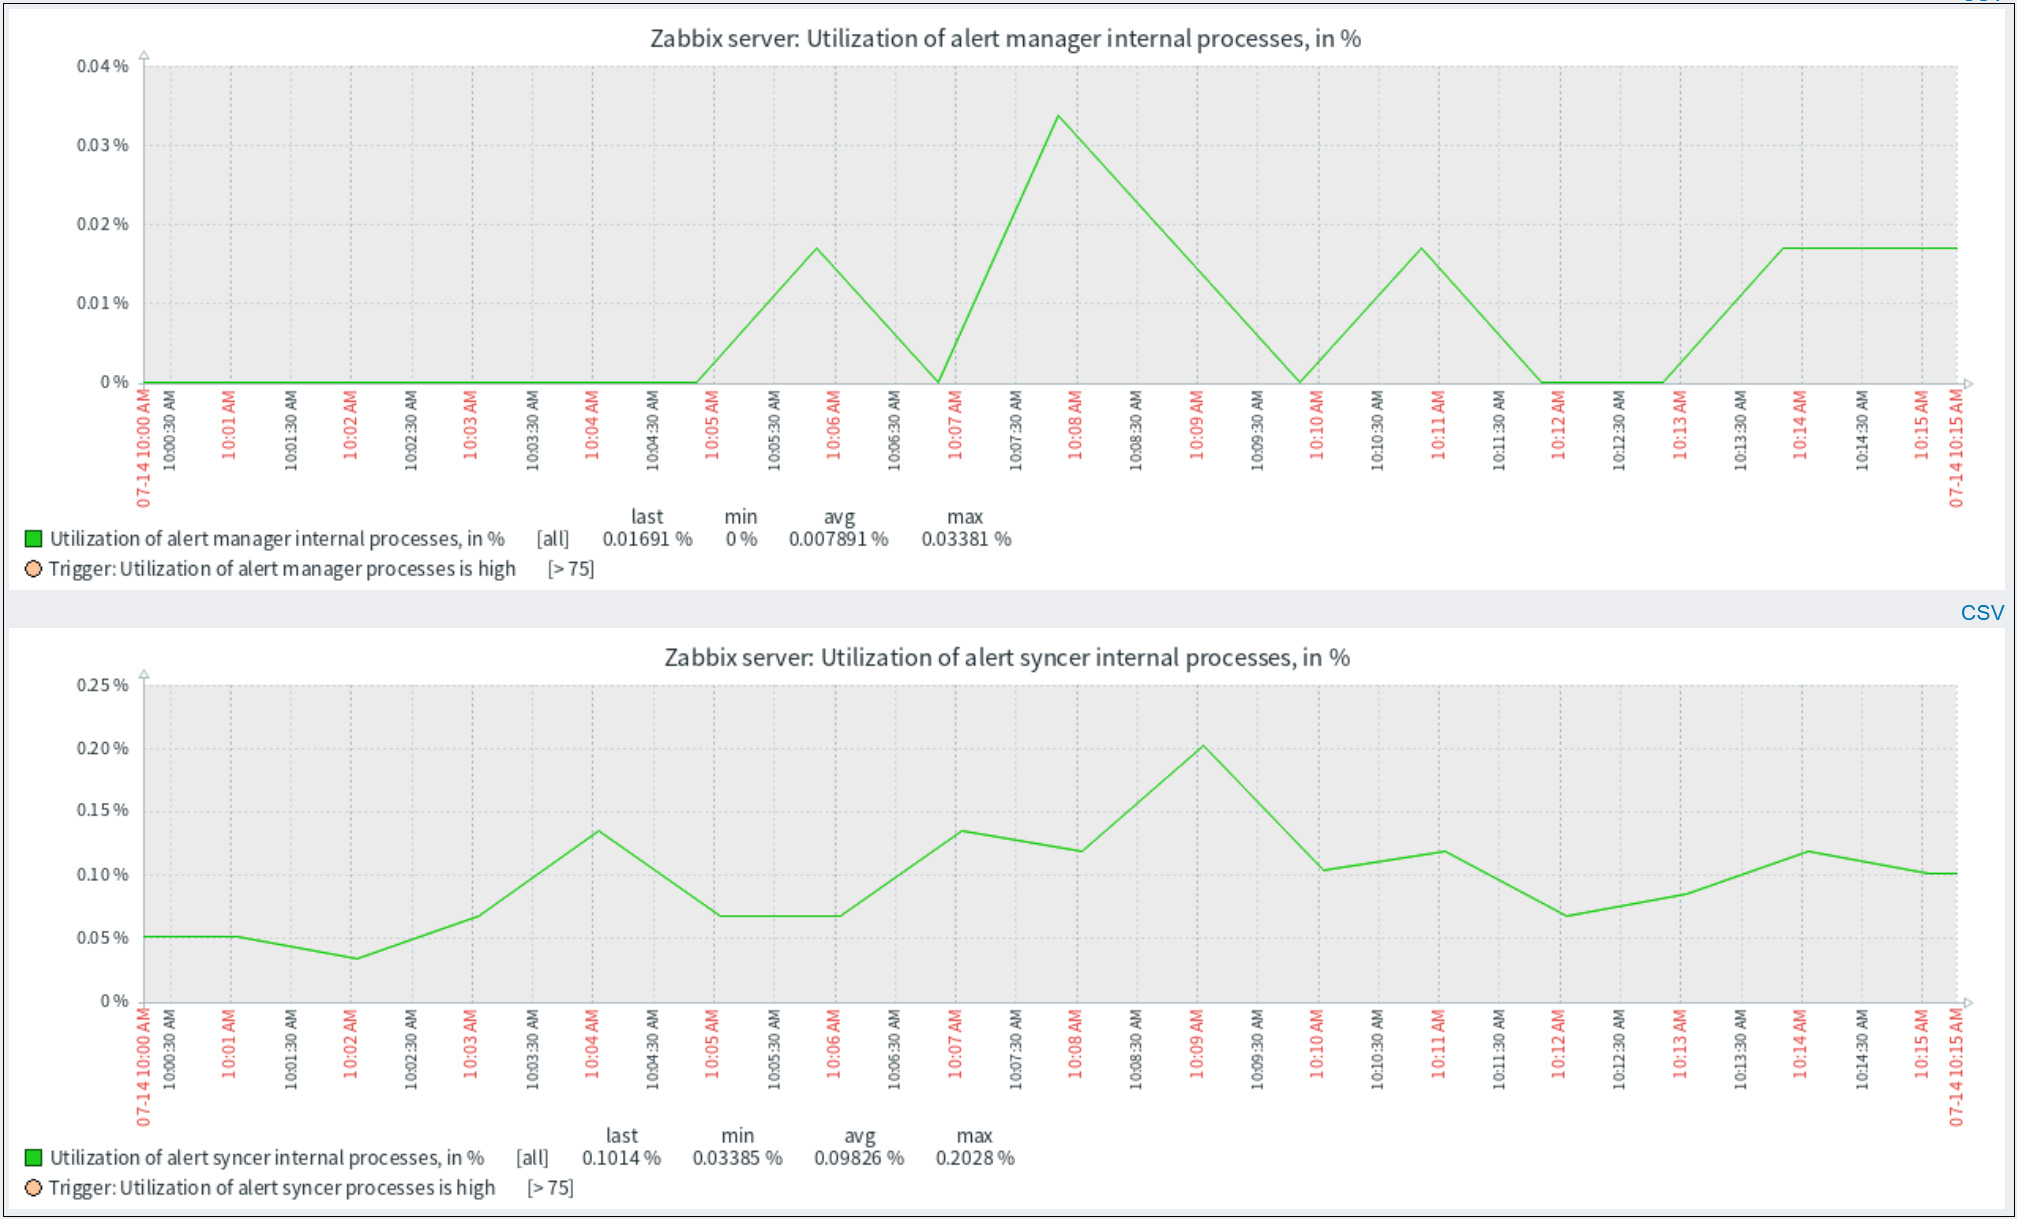
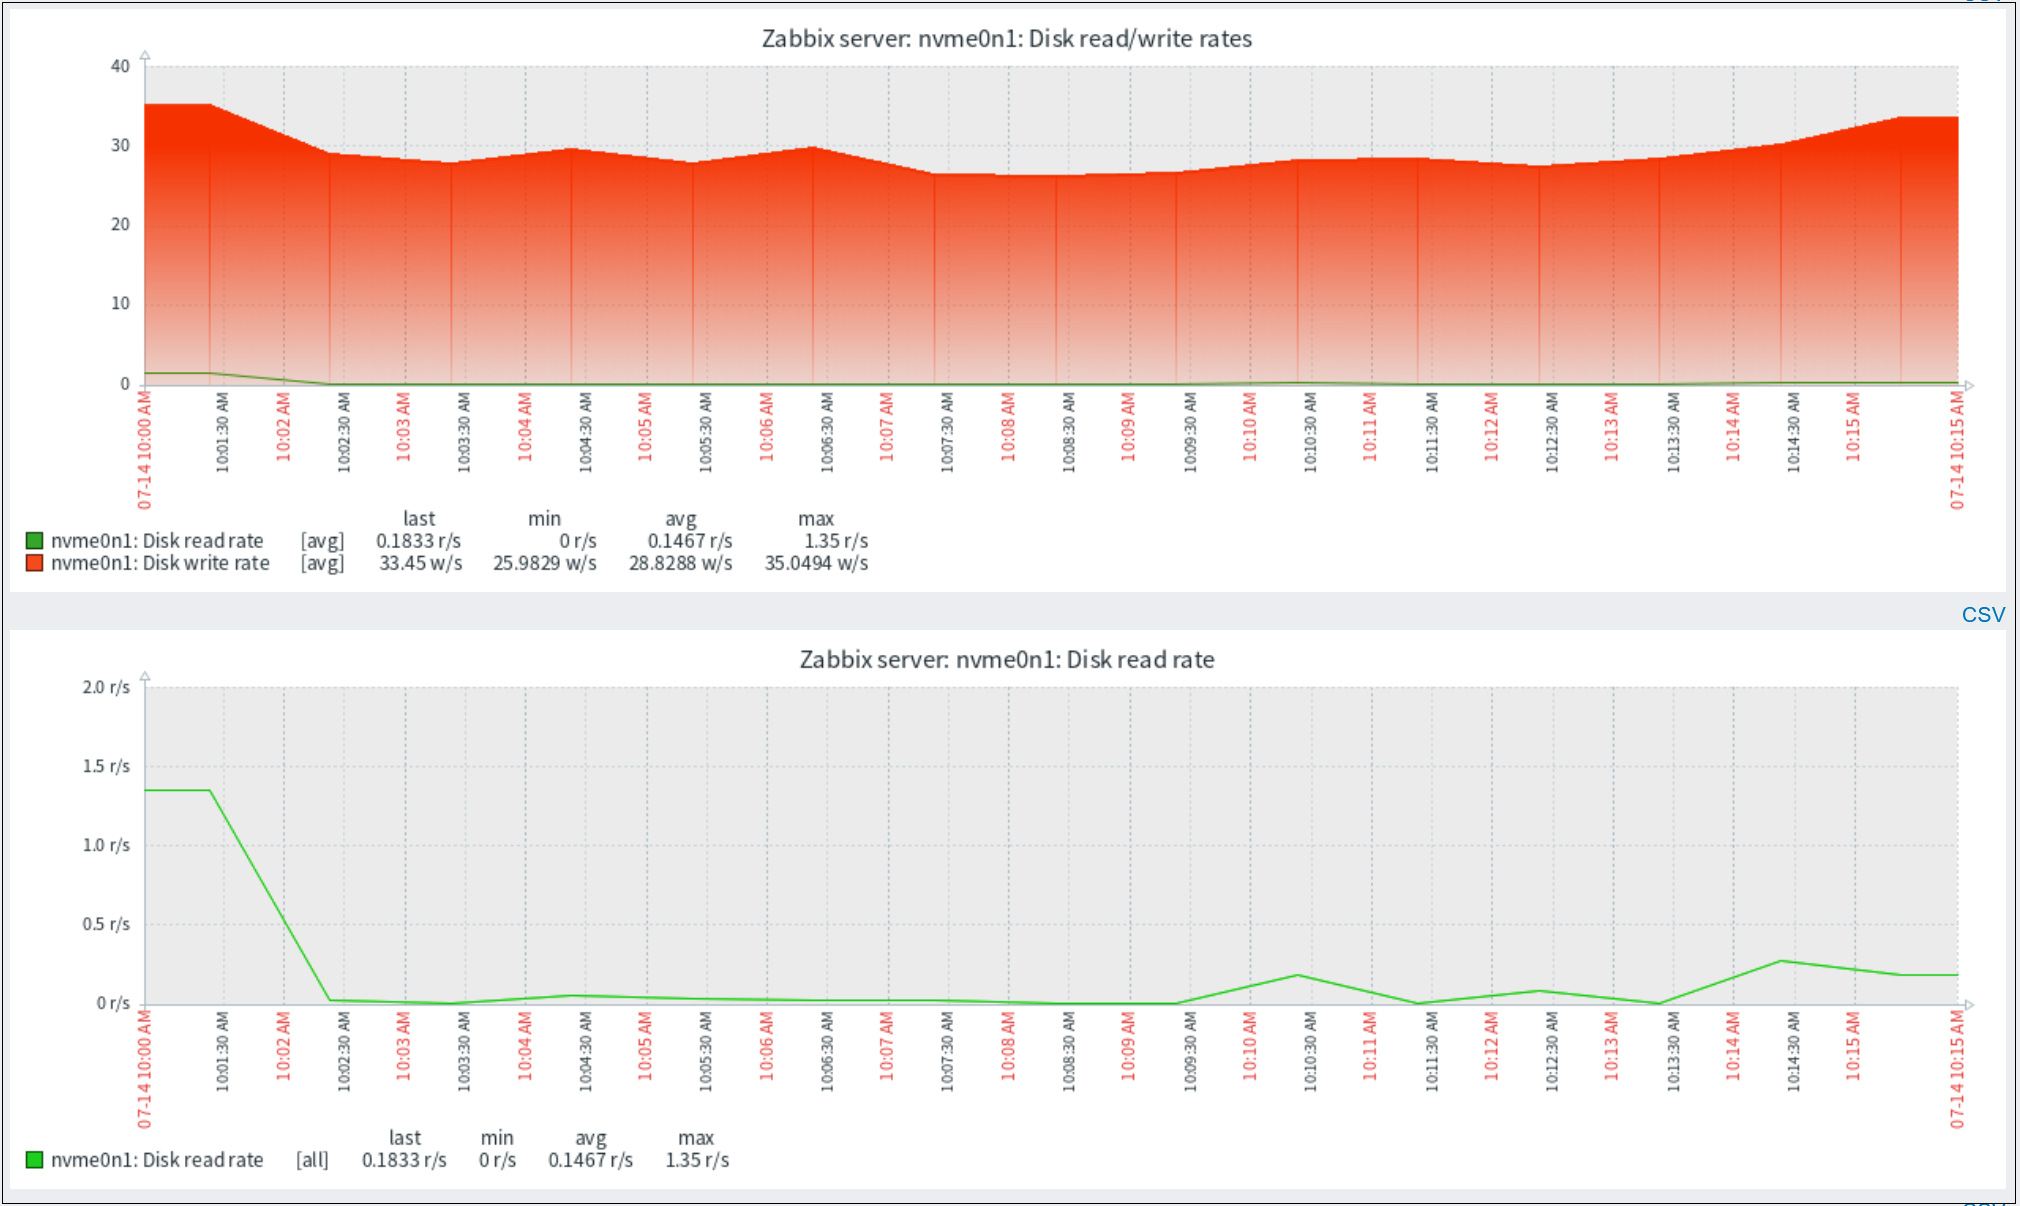
➁Click on "Zabbix server" and then on "Graphs" to see the basic monitoring status of Zabbix server itself, as shown in the figure below
8. Add monitored hosts
8.1.Configuration on the server you want to monitor
Added the following servers as targets
OS : Ubuntu22.04
IP Address : 192.168.11.200
Host name : Lion
①Registering an apt repository
Register apt repository for MIRACLE ZBX 7.0
|
1 |
# curl -fsSL https://ftp.miraclelinux.com/pub/zbx/RPM-GPG-KEY-MIRACLE-4096 | gpg --dearmor -o /etc/apt/keyrings/miracle-zbx.gpg |
Add MIRACLE ZBX repository file to /etc/apt/sources.list.d
Create /etc/apt/sources.list.d/miracle-zbx.list with the following contents
|
1 2 3 |
# vi /etc/apt/sources.list.d/miracle-zbx.list deb [arch=amd64 signed-by=/etc/apt/keyrings/miracle-zbx.gpg] https://ftp.miraclelinux.com/pub/zbx/7.0/ubuntu/amd64 jammy main |
Update repository and install MIRACLE ZBX agent package
|
1 |
# apt update |
➁ Install MIRACLE ZBX Agent 2 on the server you want to monitor
|
1 |
# apt install miracle-zbx-agent2 |
➂Edit configuration file /etc/zabbix/zabbix_agent2.conf
|
1 2 3 4 5 6 7 8 |
# vi /etc/zabbix/zabbix_agent2.conf # Line 84 : Specify Zabbix server (in this case 192.168.11.83) Server=192.168.11.83 # Line 137 : Specify Zabbix server (in this case 192.168.11.83) ServerActive=192.168.11.83 # Line 148 : Change to your own host name (Lion in this case) Hostname=Lion |
|
1 2 |
# systemctl enable zabbix-agent2 # systemctl restart zabbix-agent2 |
④Configure firewall on Zabbix-agent side
Zabbix ports 10050 (on Zabbix server side) and 10051 (on zabbix agent side) must be allowed.
|
1 2 |
# ufw allow 10050:10051/tcp # ufw reload |
8.2. Configuration in Zabbix WEB UI
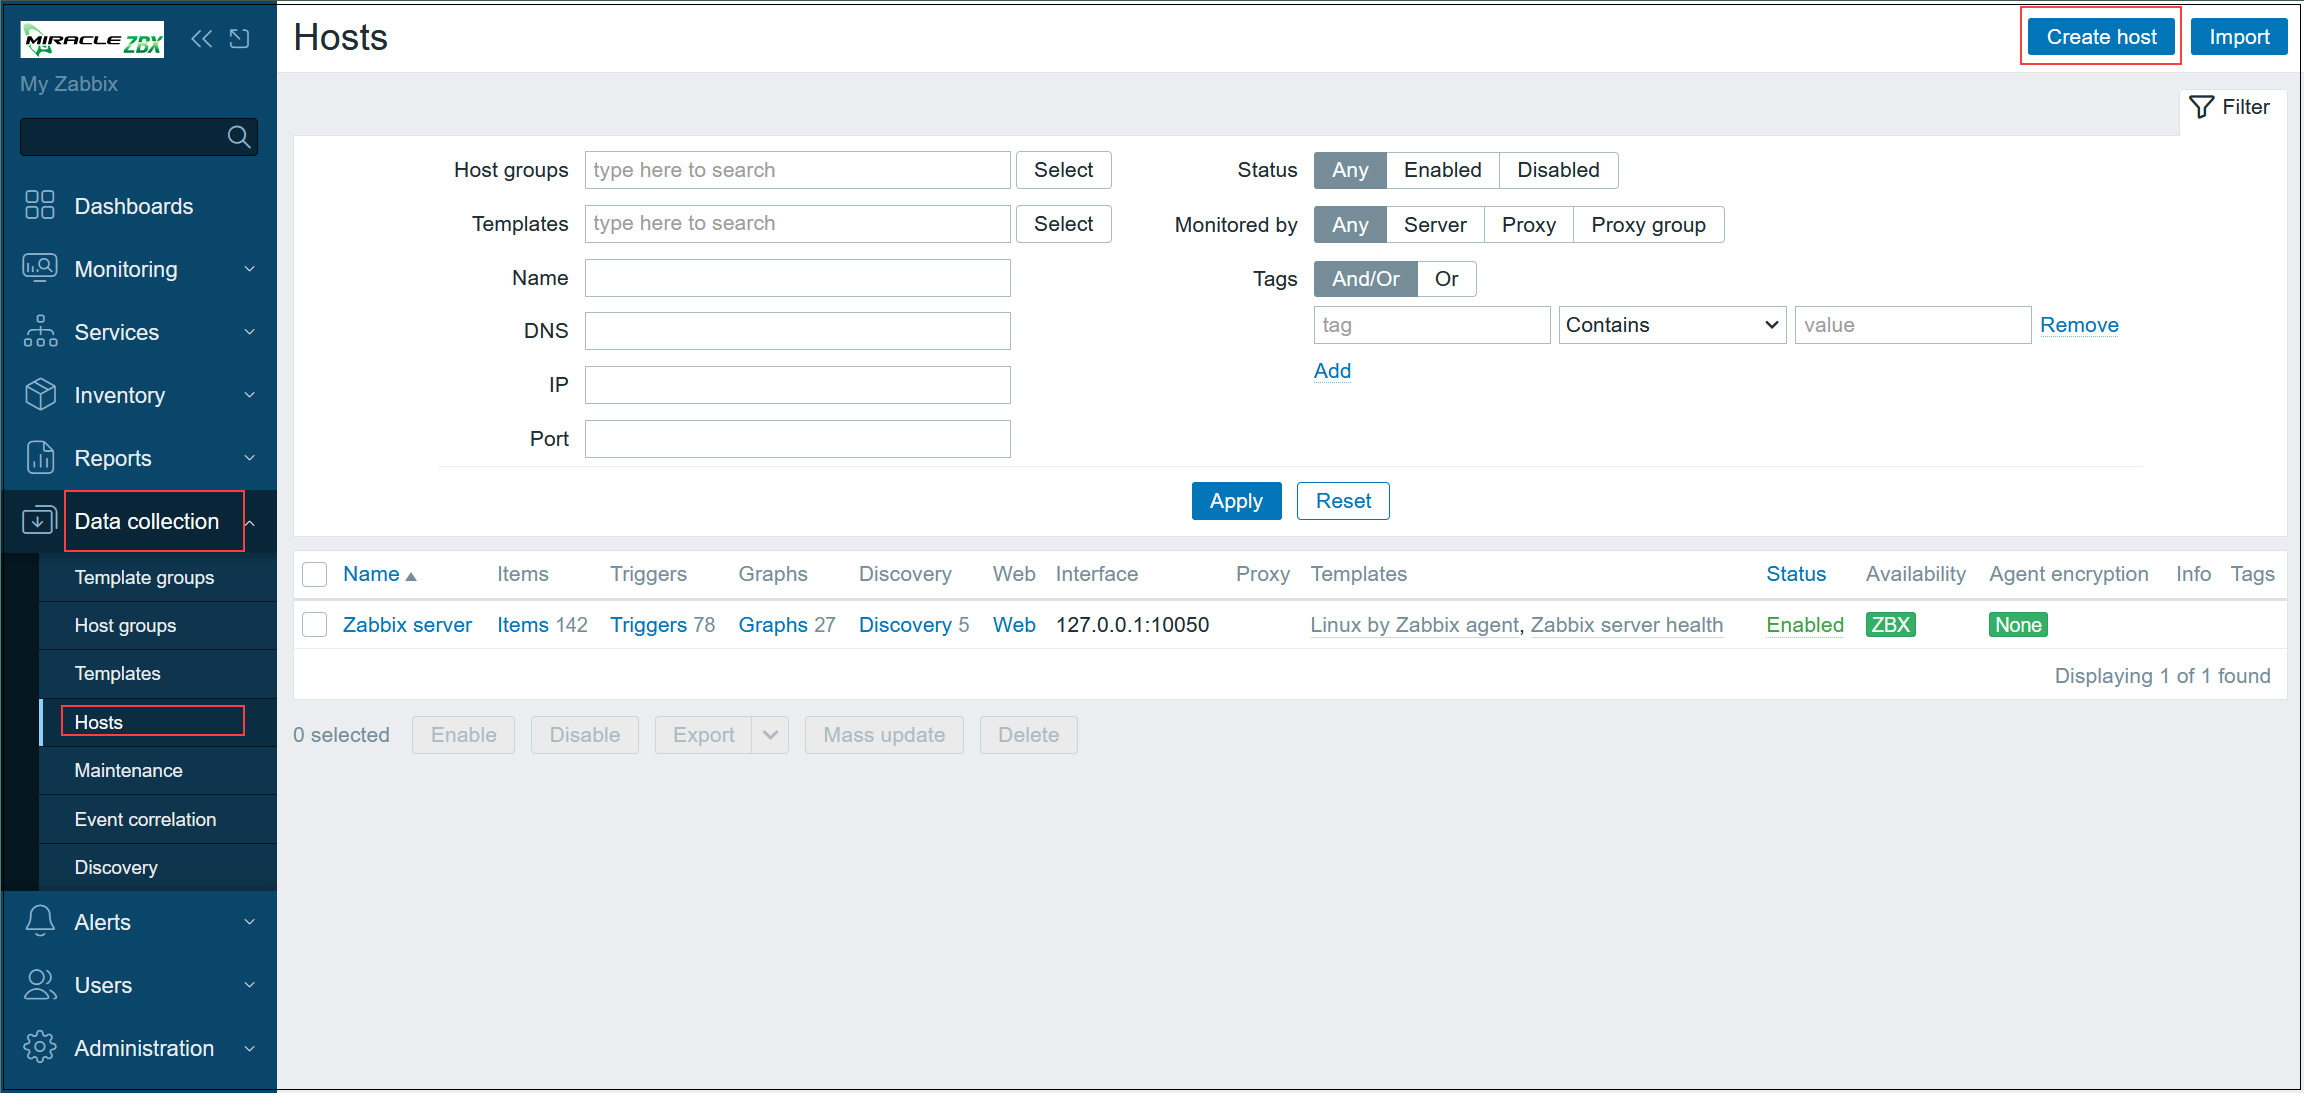
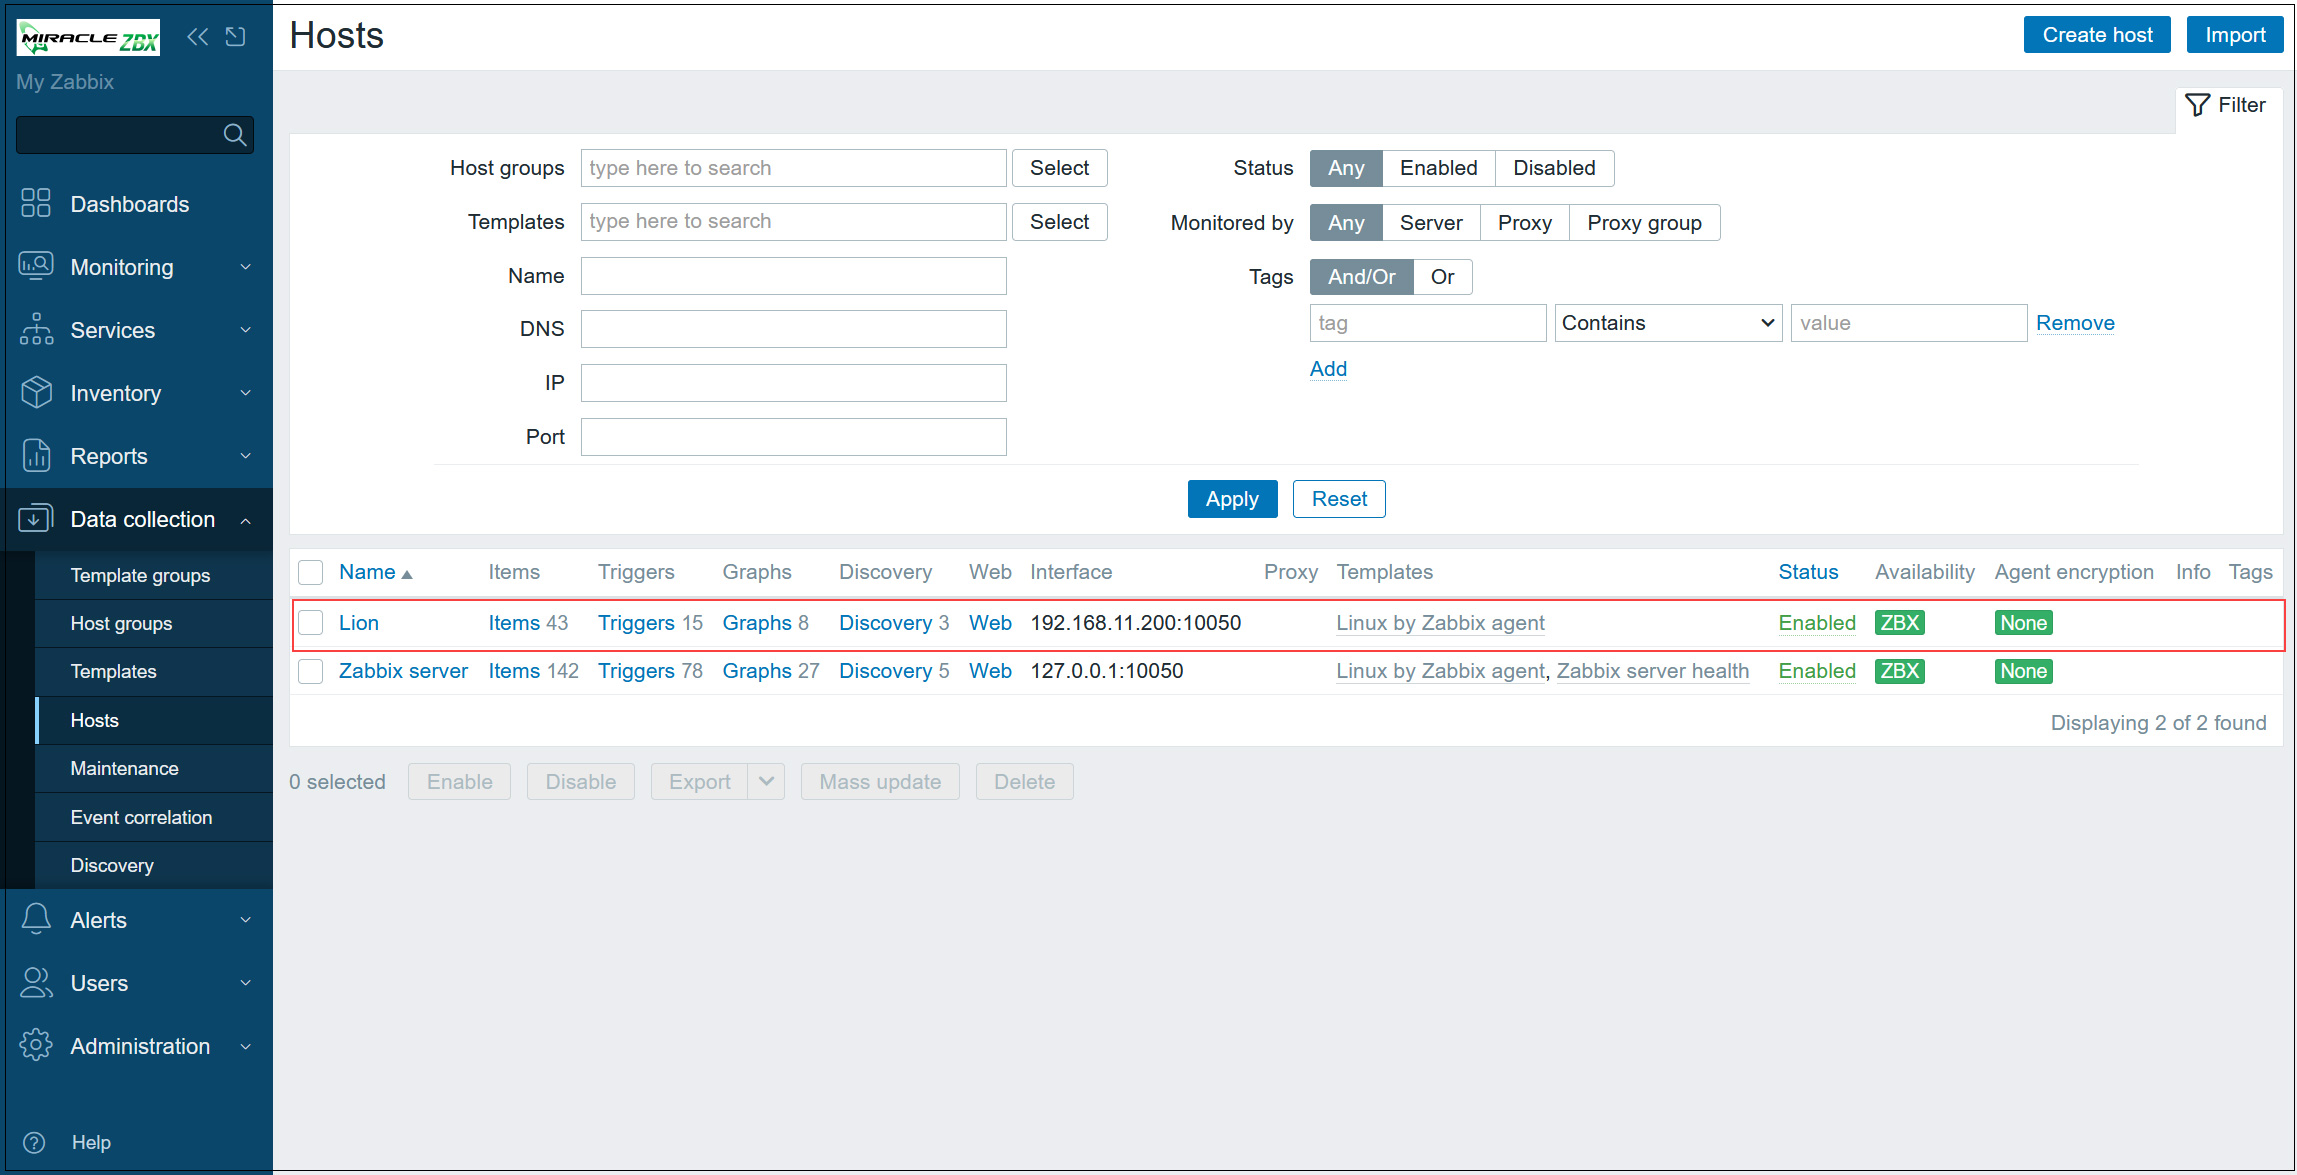
Log in to the Zabbix administration site, select [Datacollection] - [Hosts] in the left pane and click the [Create Host] button at the top of the right pane.
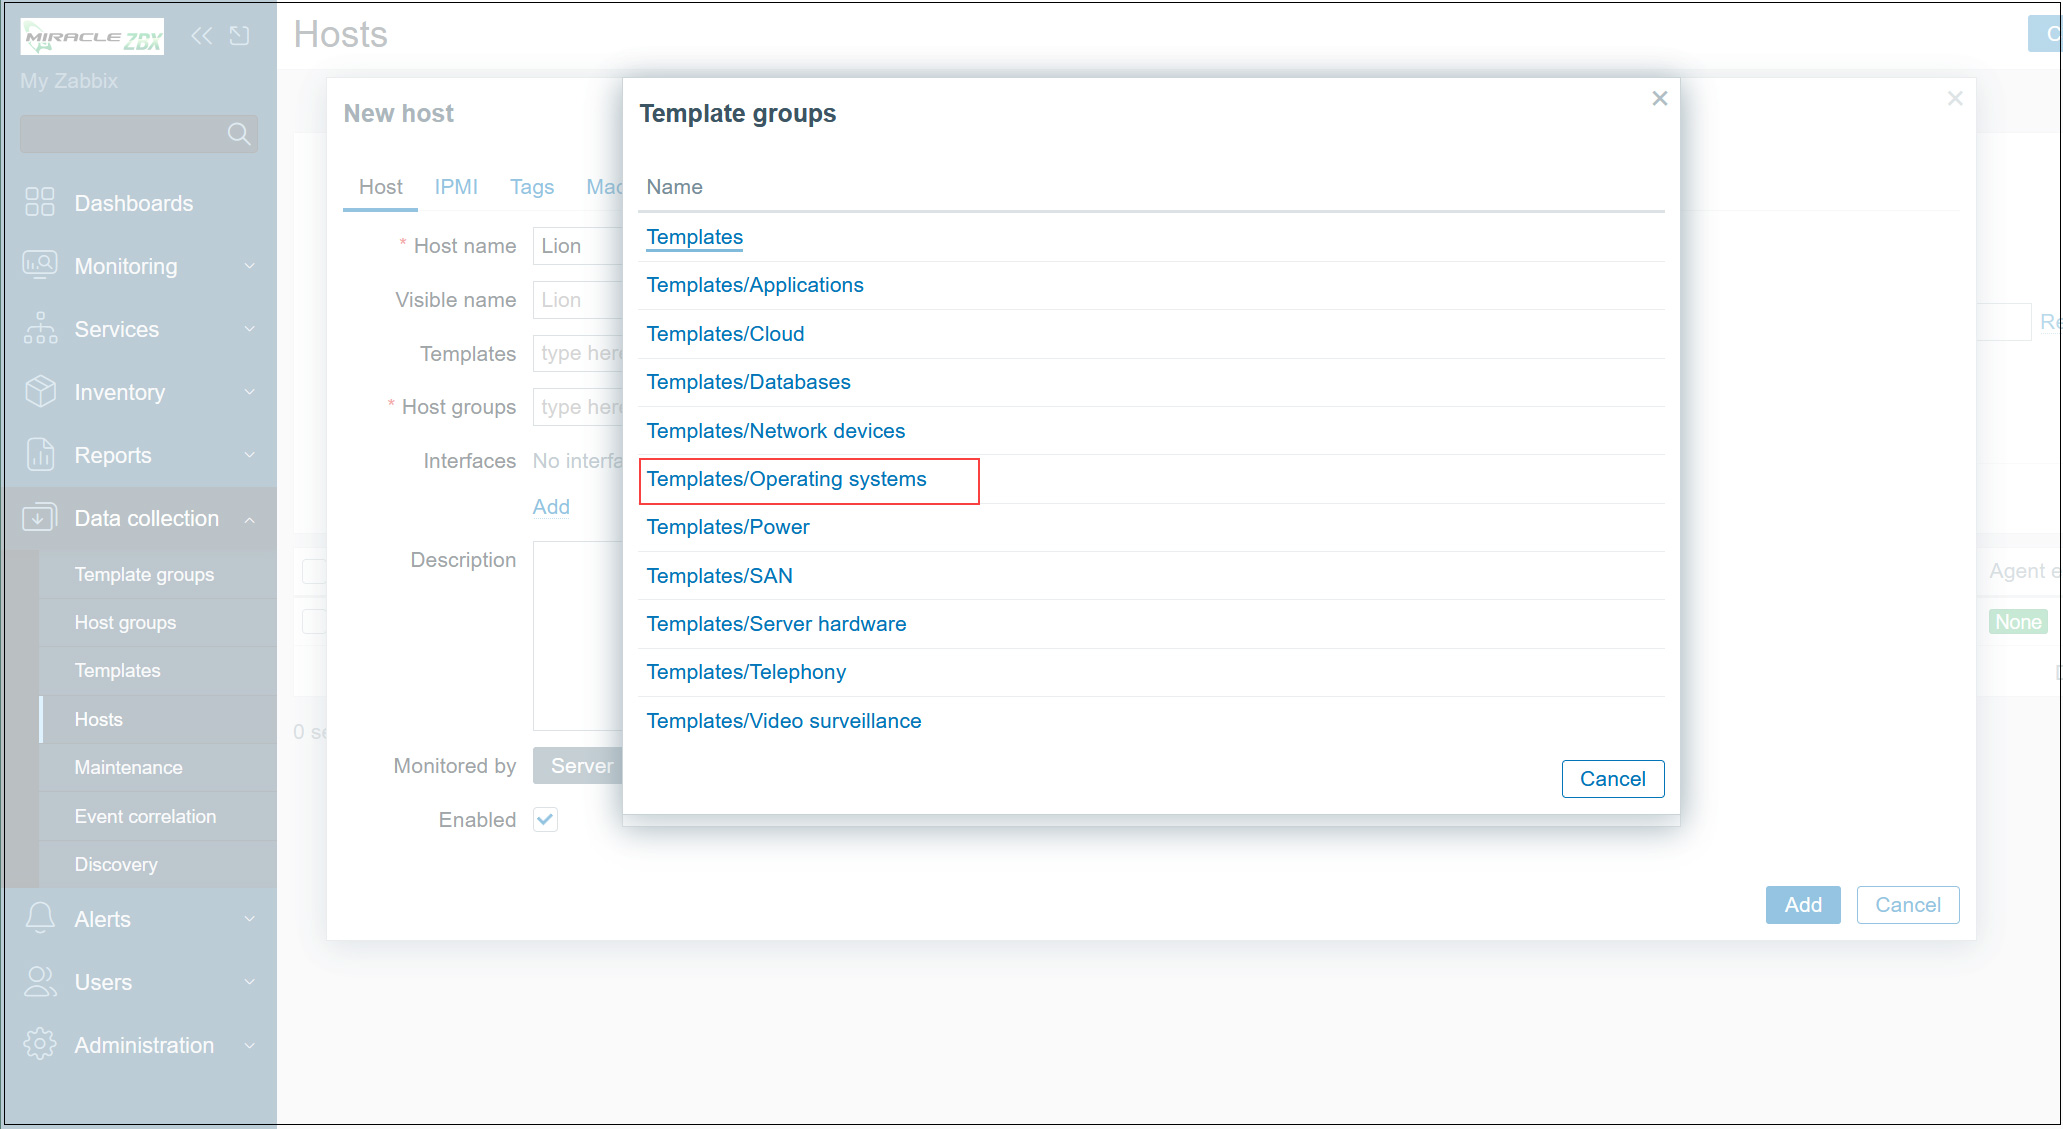
Enter a hostname in the [Hostname] field (in this case, Lion).
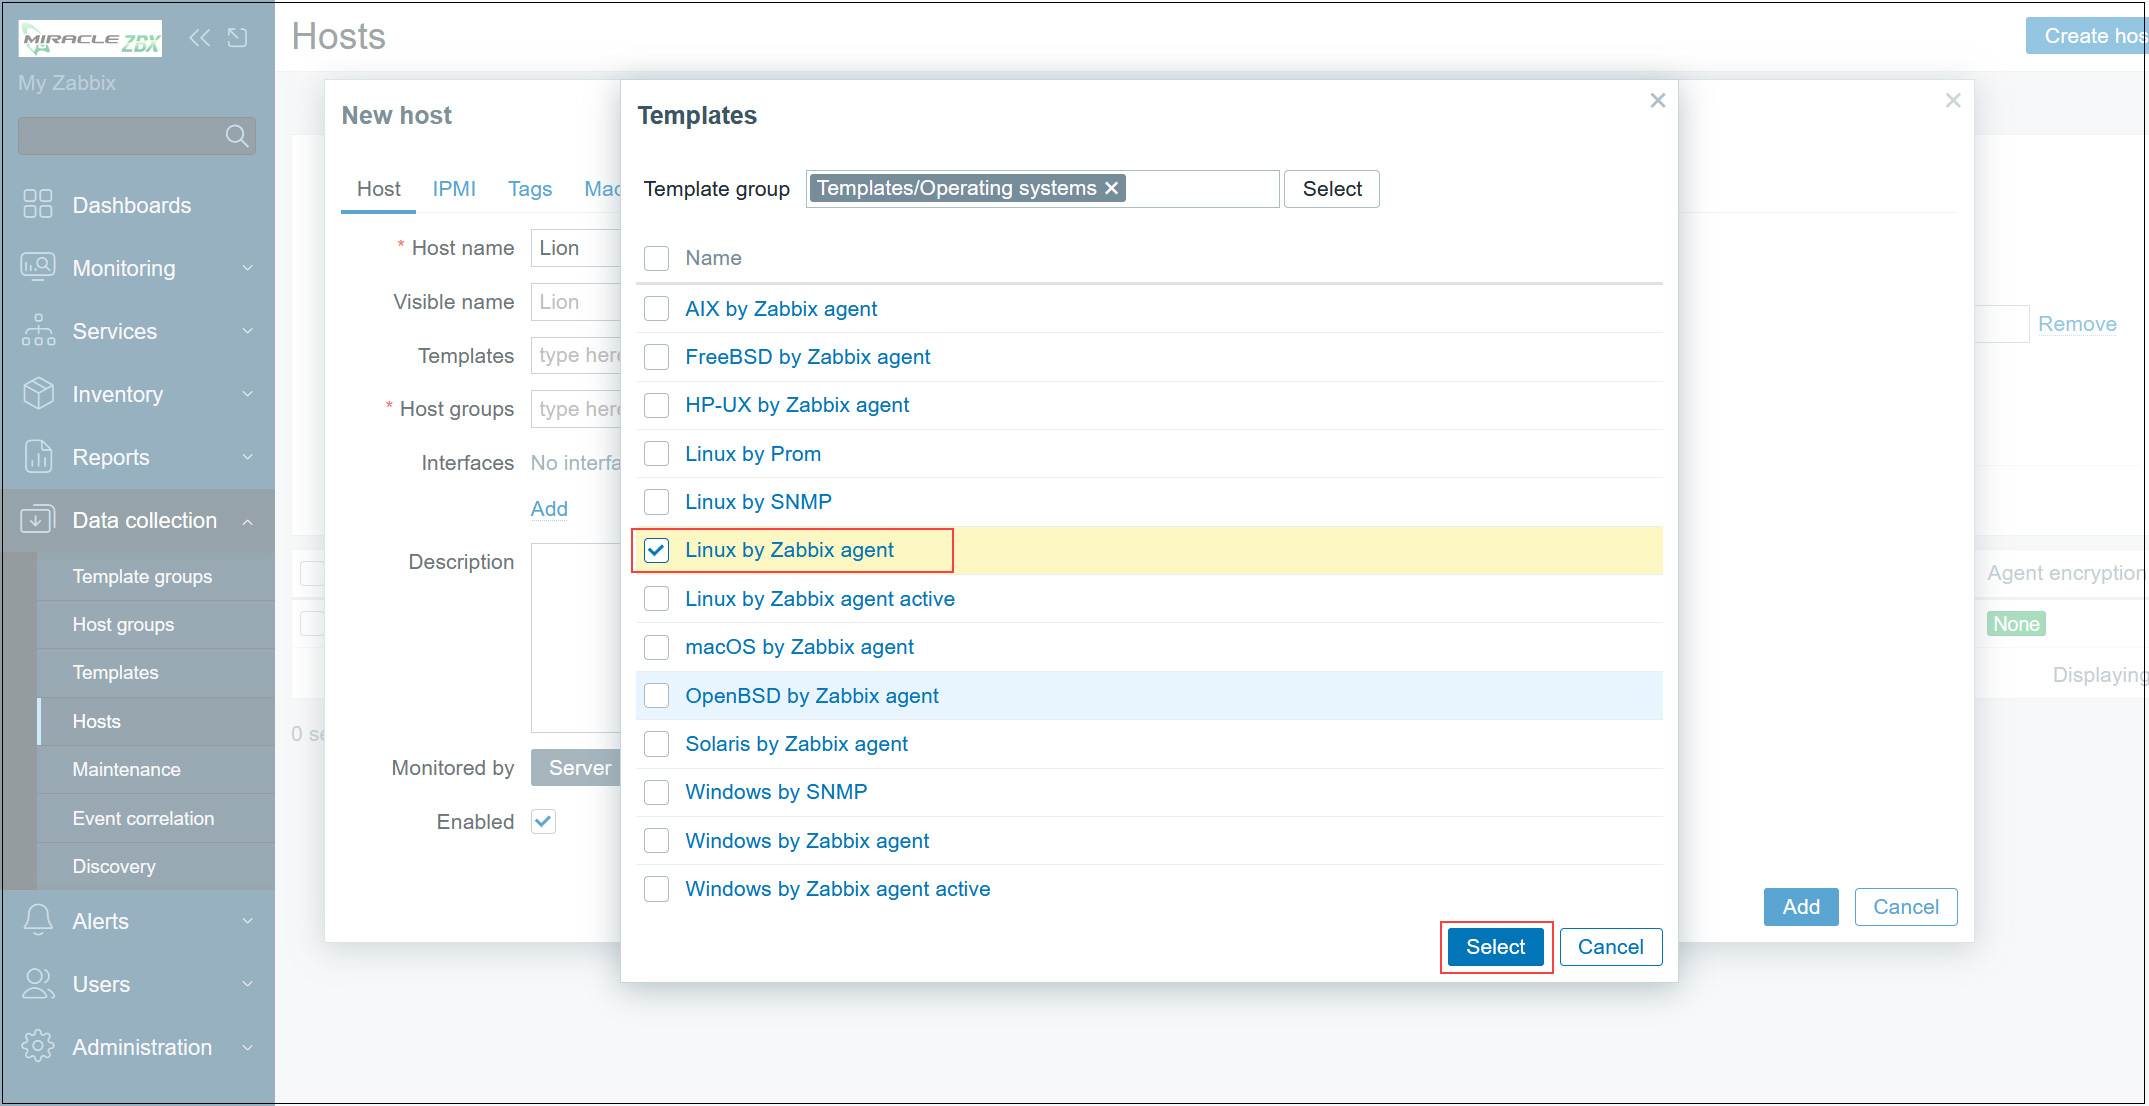
For [Templates], click the [Select] button, click the [Select] button next to [Template group], and then click [Templates/Operating systems].
Select [Linux by Zabbix agent] from the list of monitoring templates if you want to monitor general items such as CPU on Linux OS, and click [Select] button.
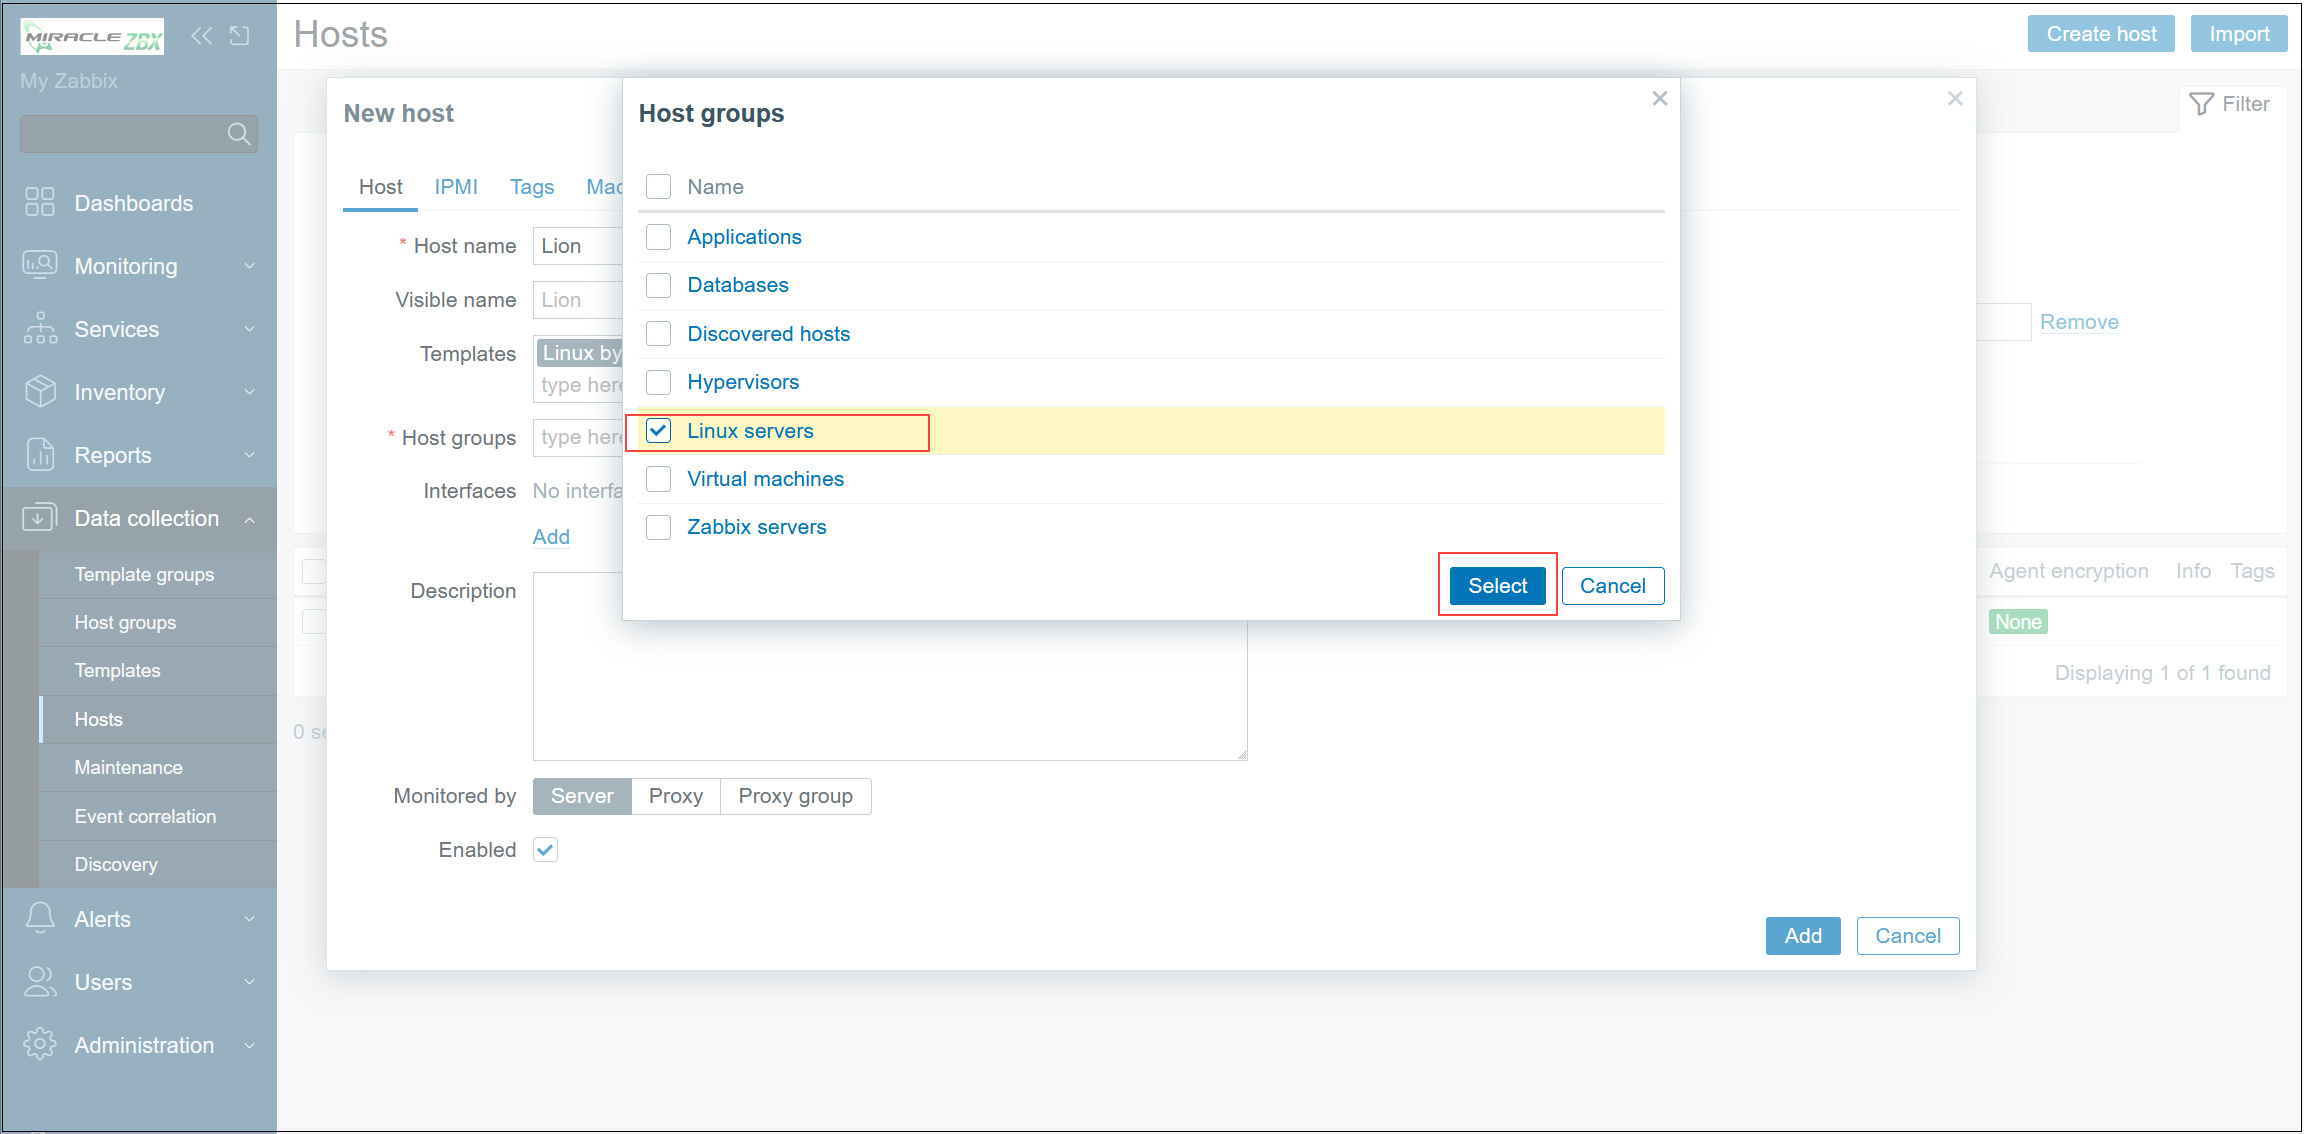
Click the [Select] button under [Host groups], select [Linux servers], and click the [Select] button.
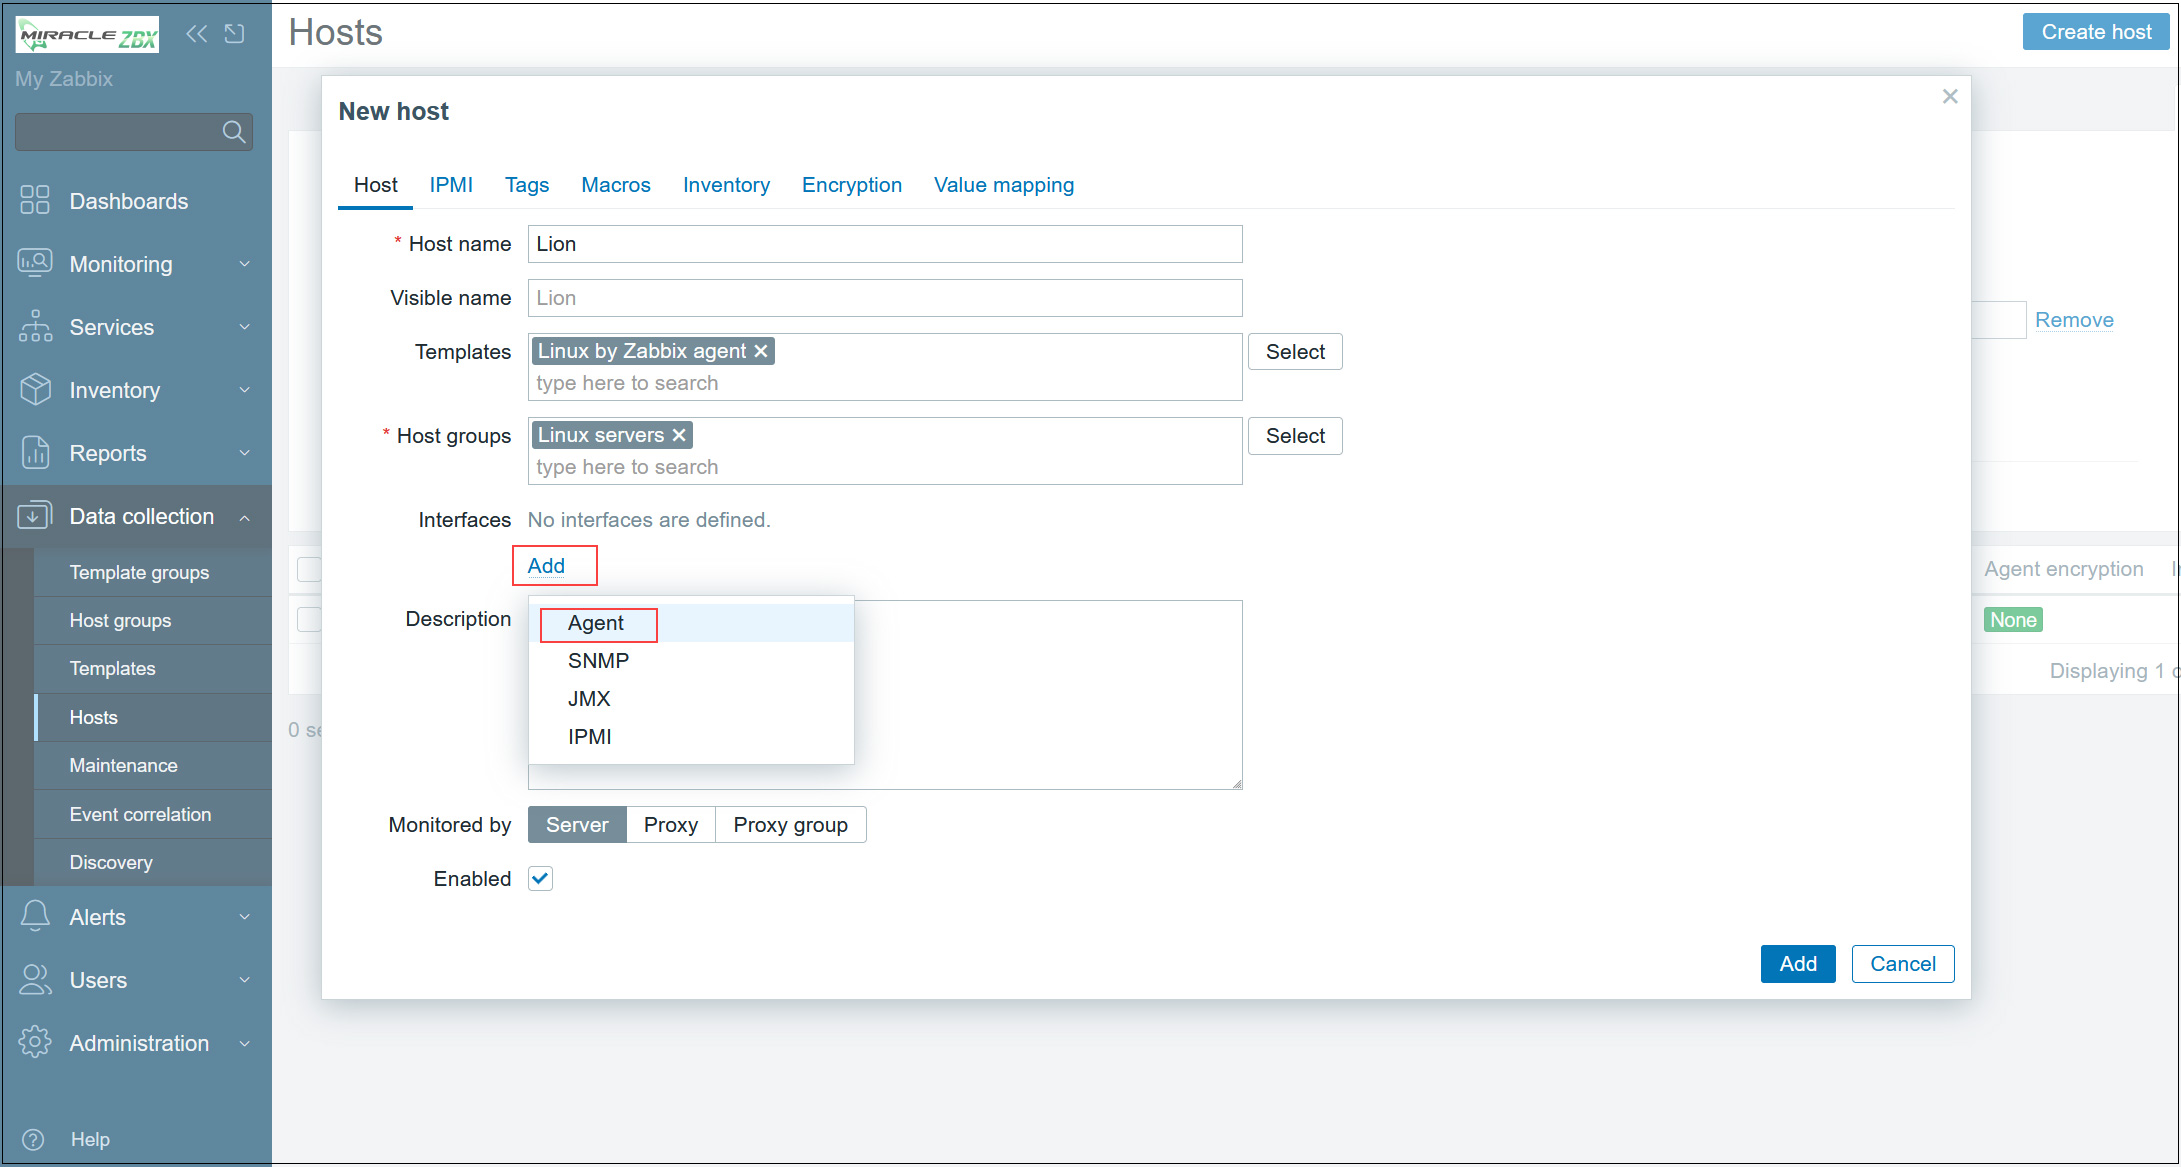
In [Interfaces], click [Add] under Interfaces, select [Agent], enter the IP address to be monitored, and then click [Add] at the bottom.
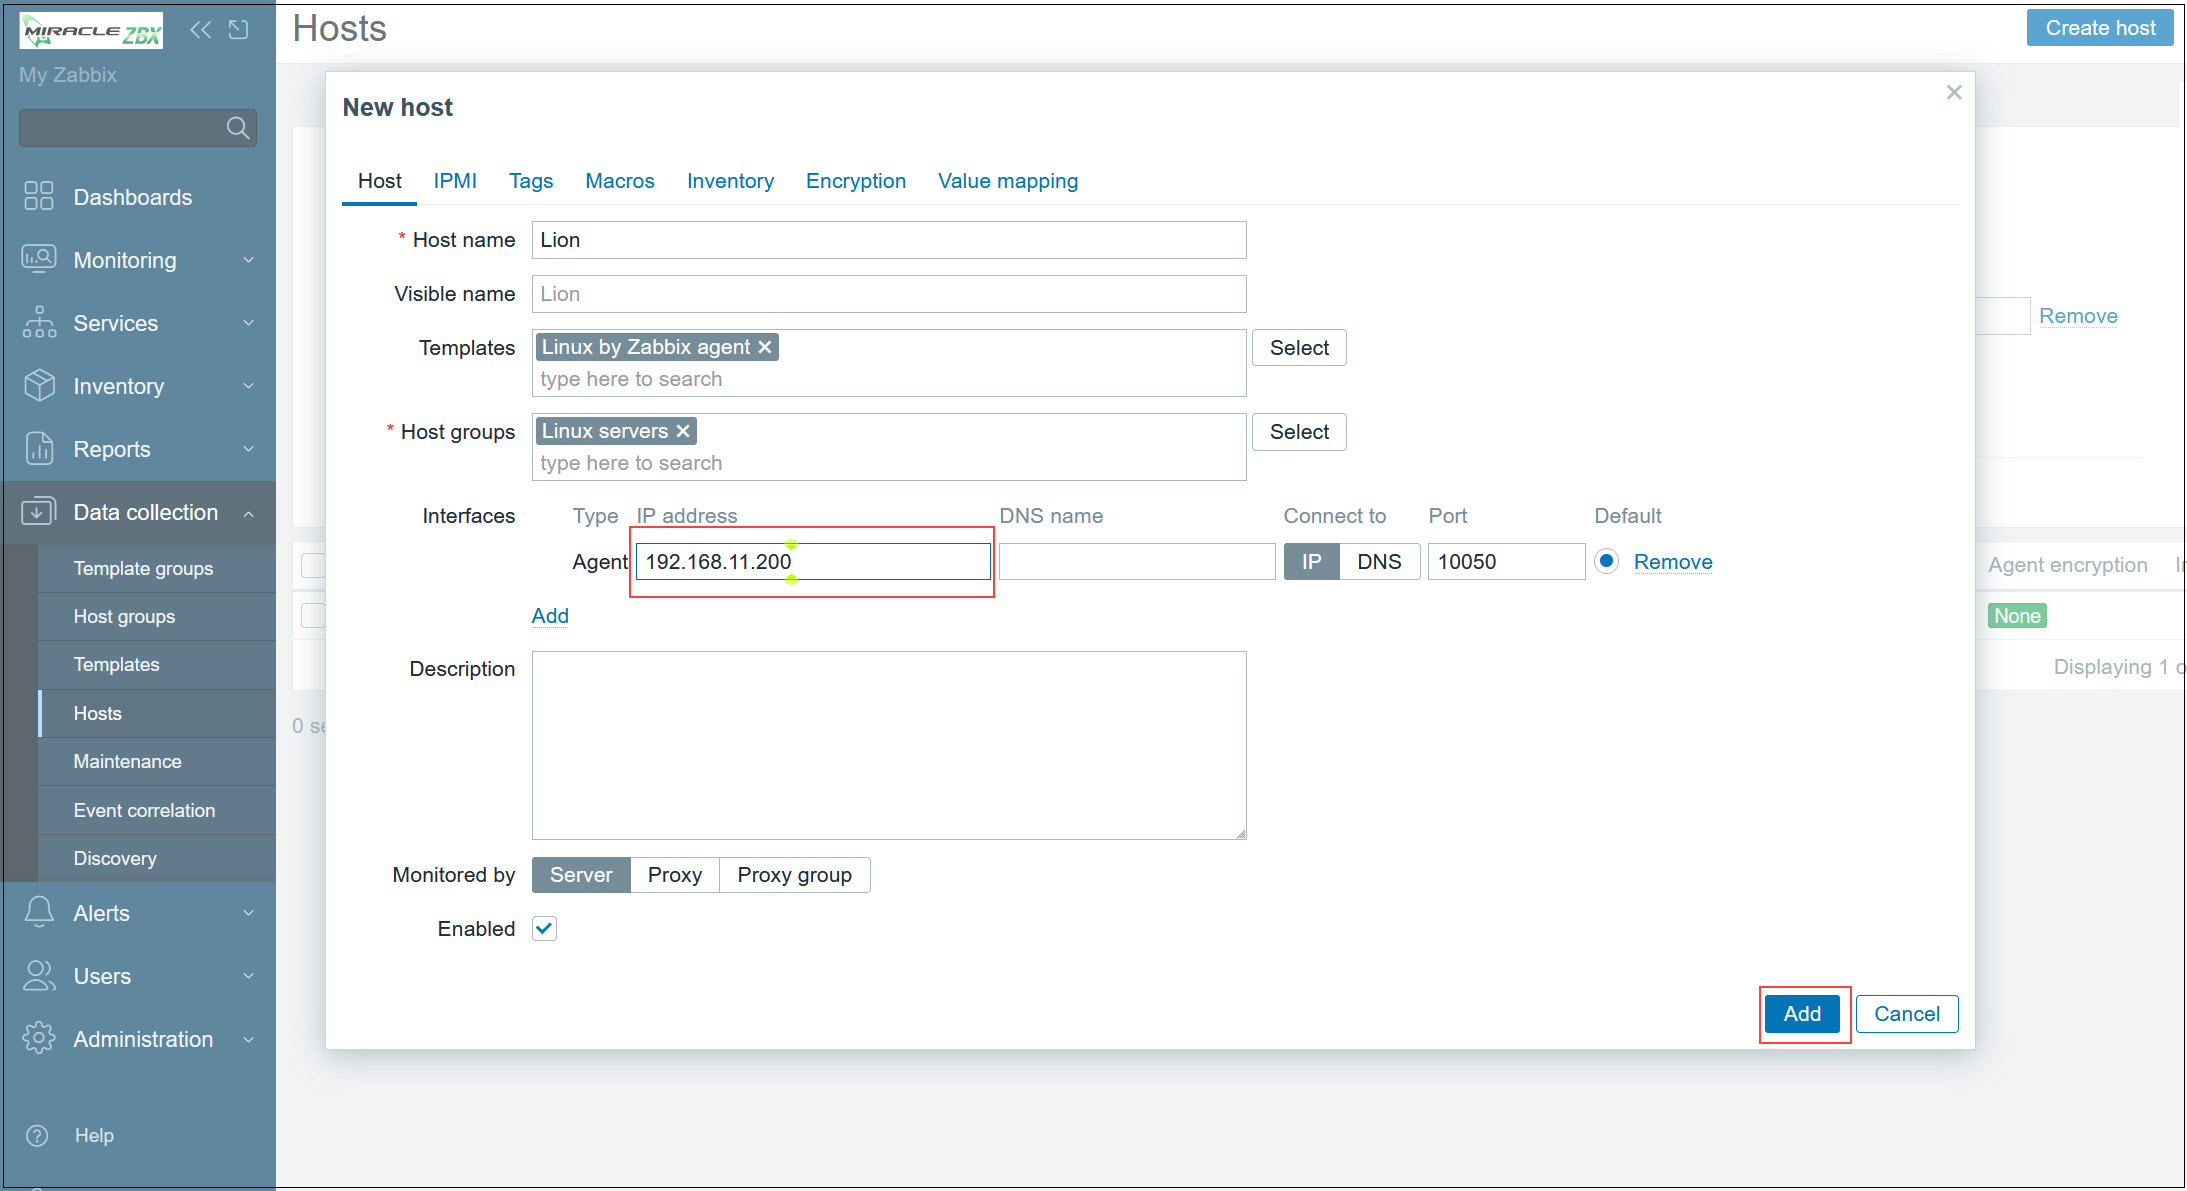
New monitored servers are registered.
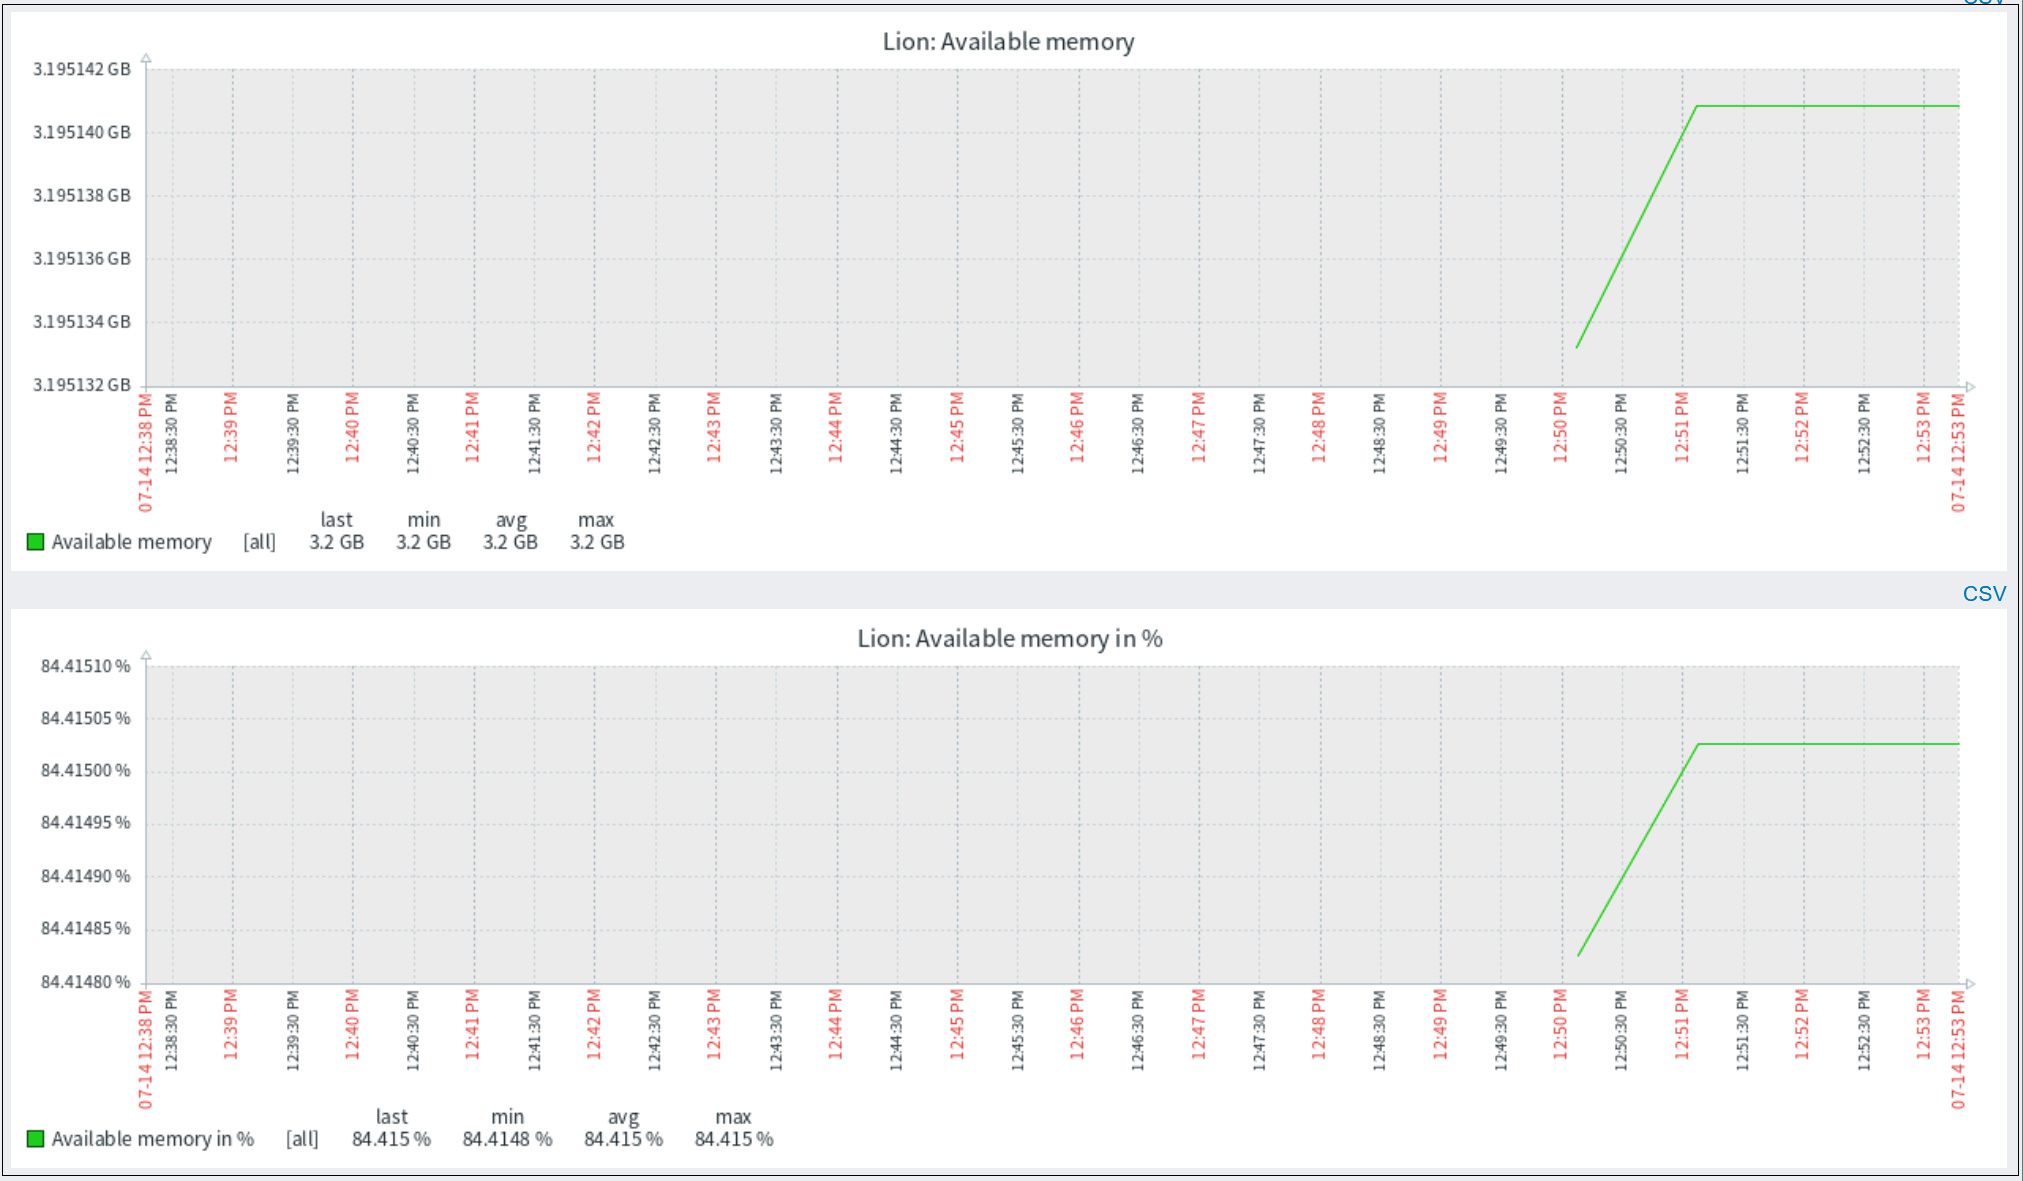
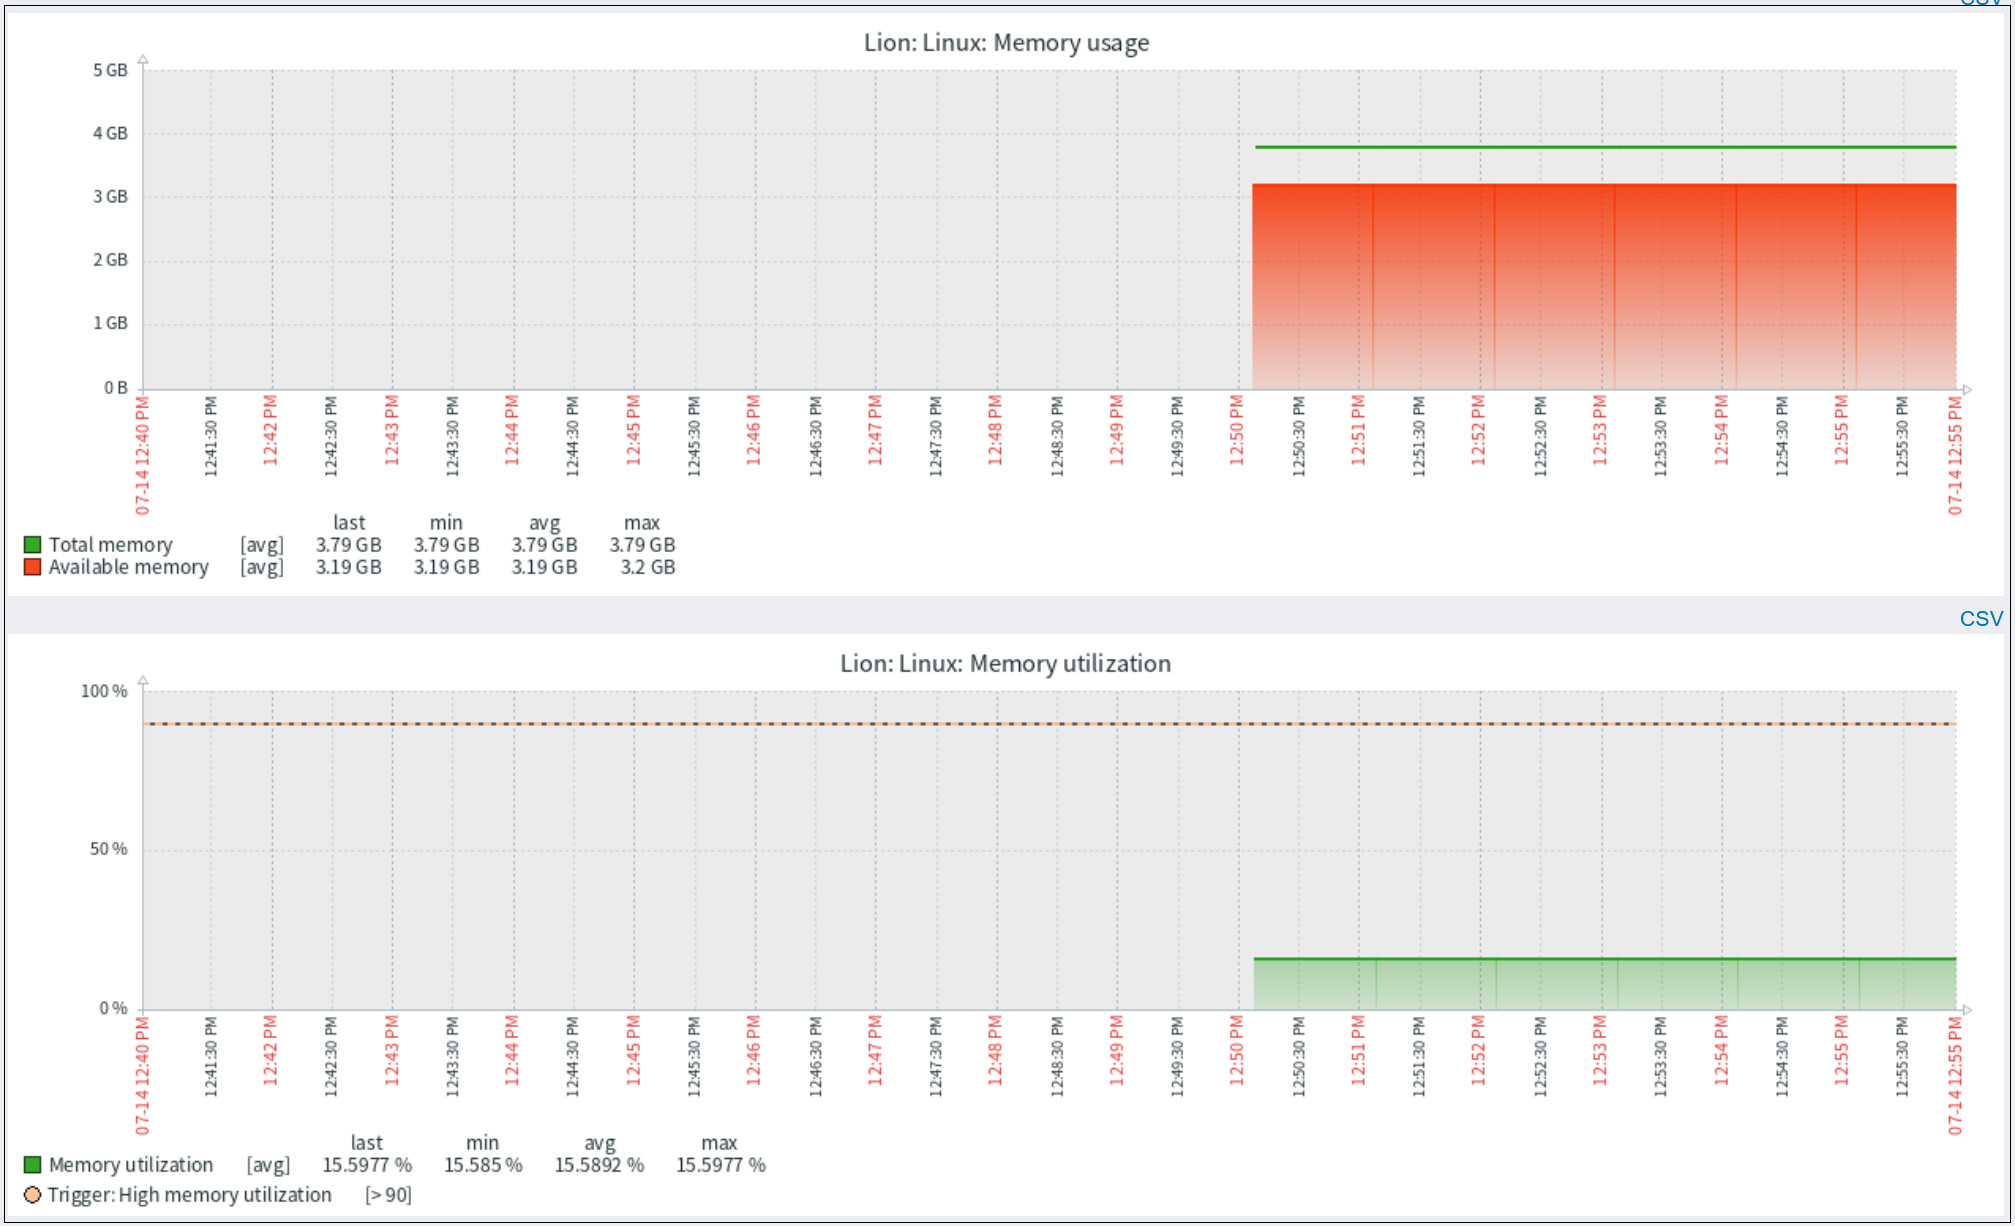
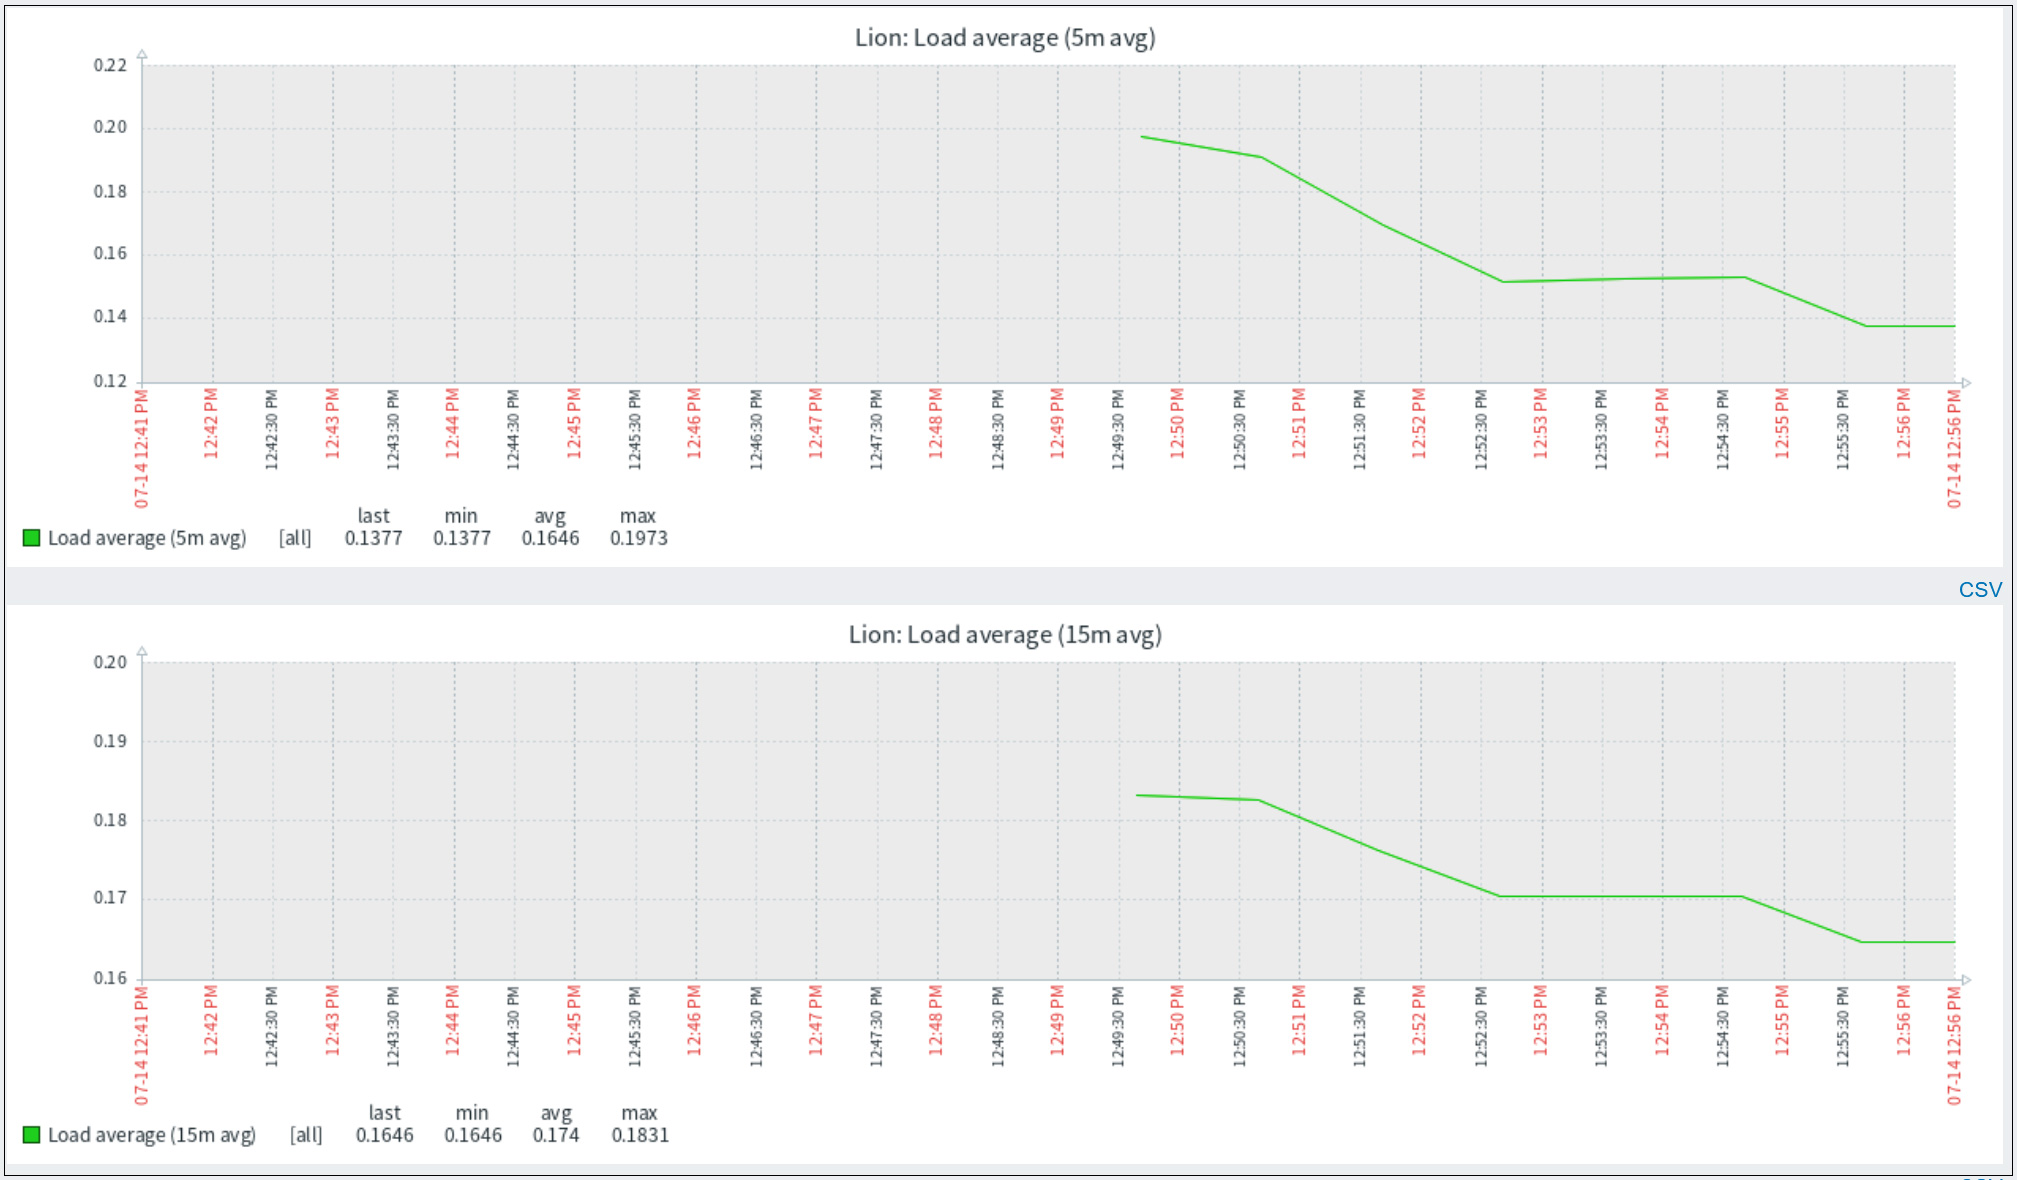
Click [Monitoring][Hostd][Lion] in the left pane and select [Graphs].
After a while, the data of the added target hosts will be displayed.
9.Add items to be monitored
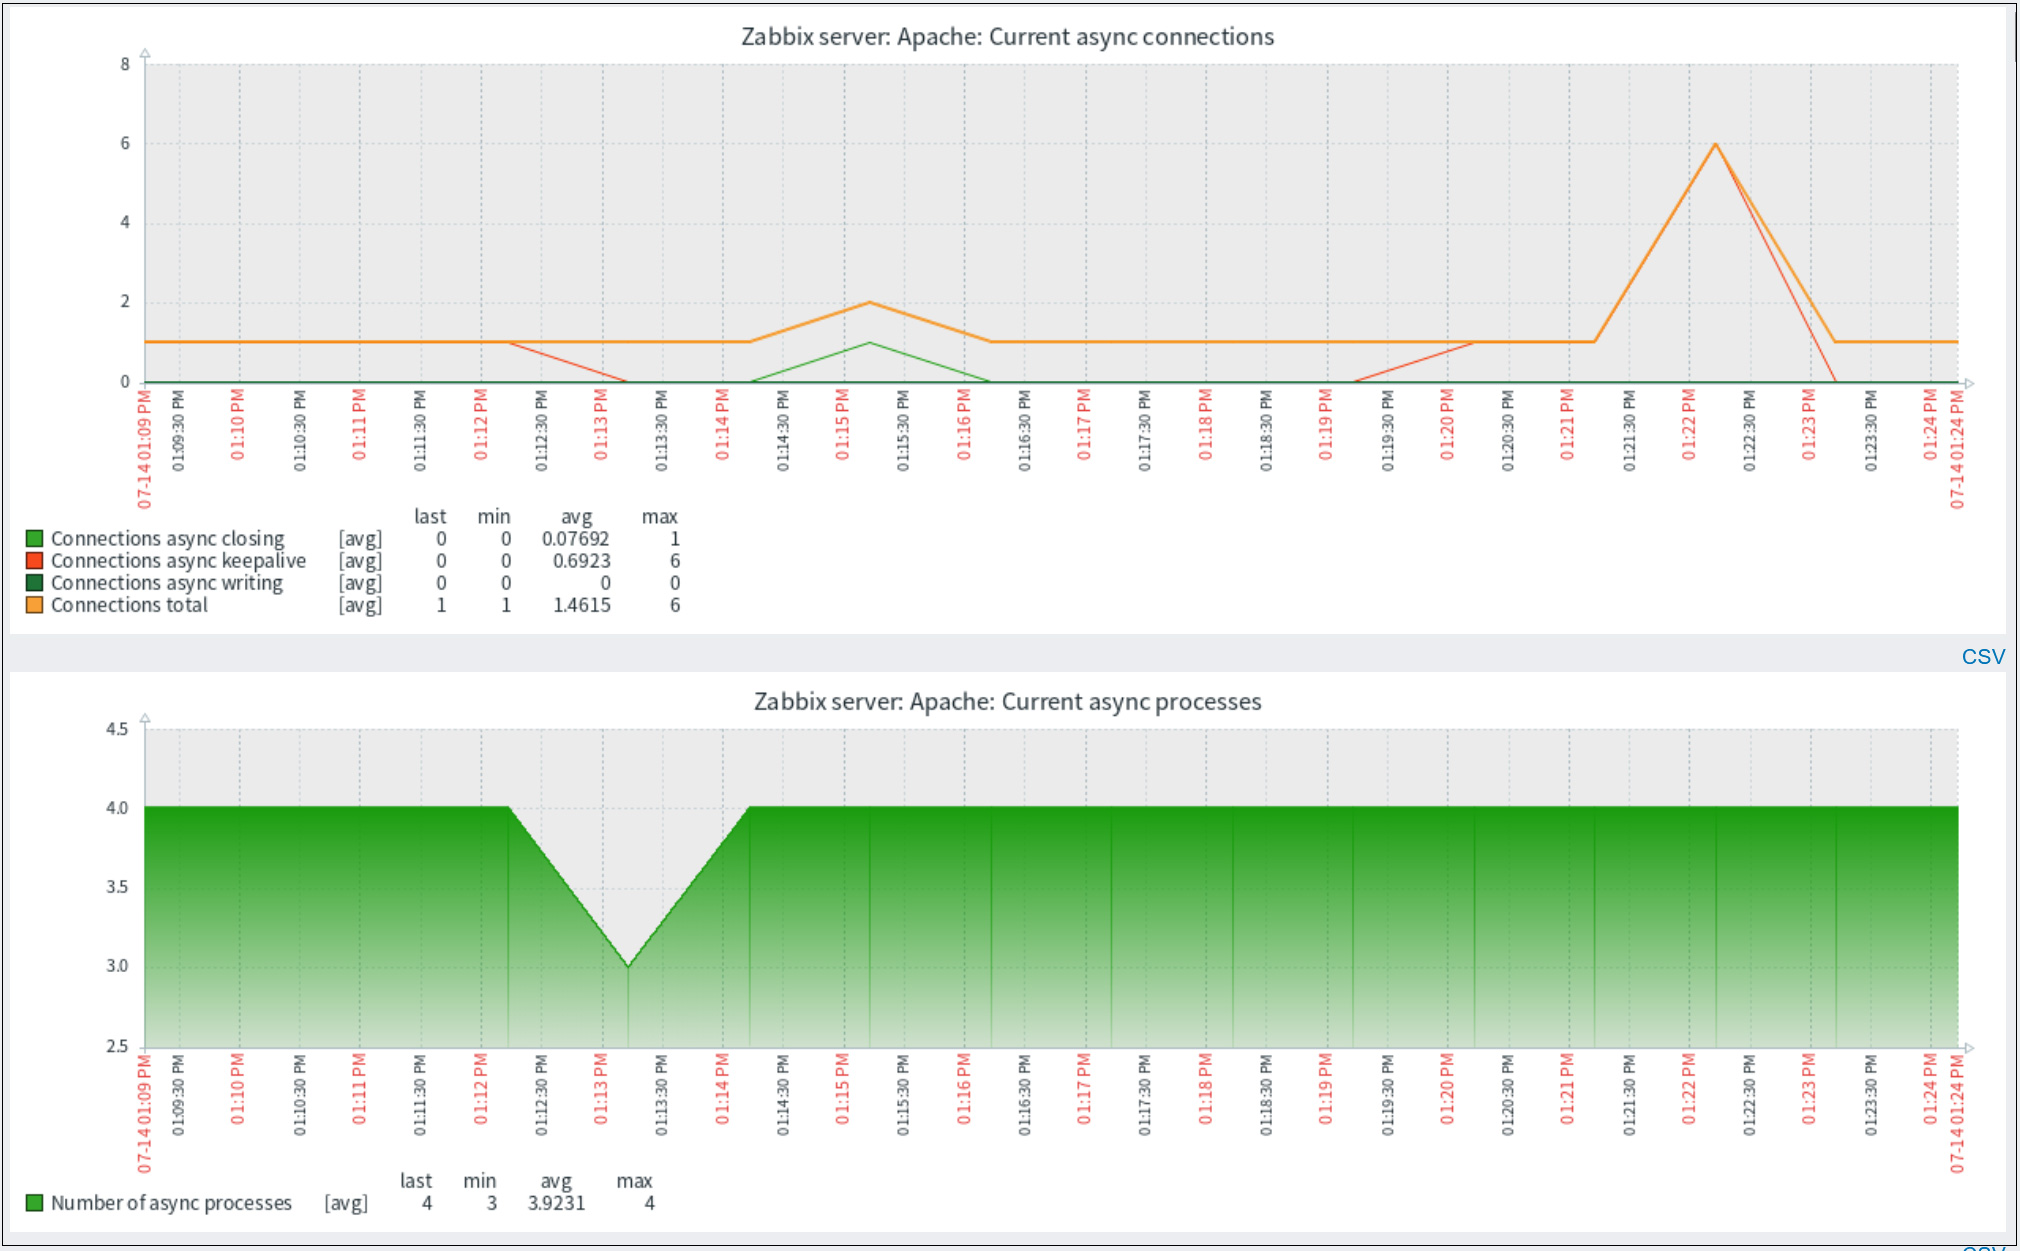
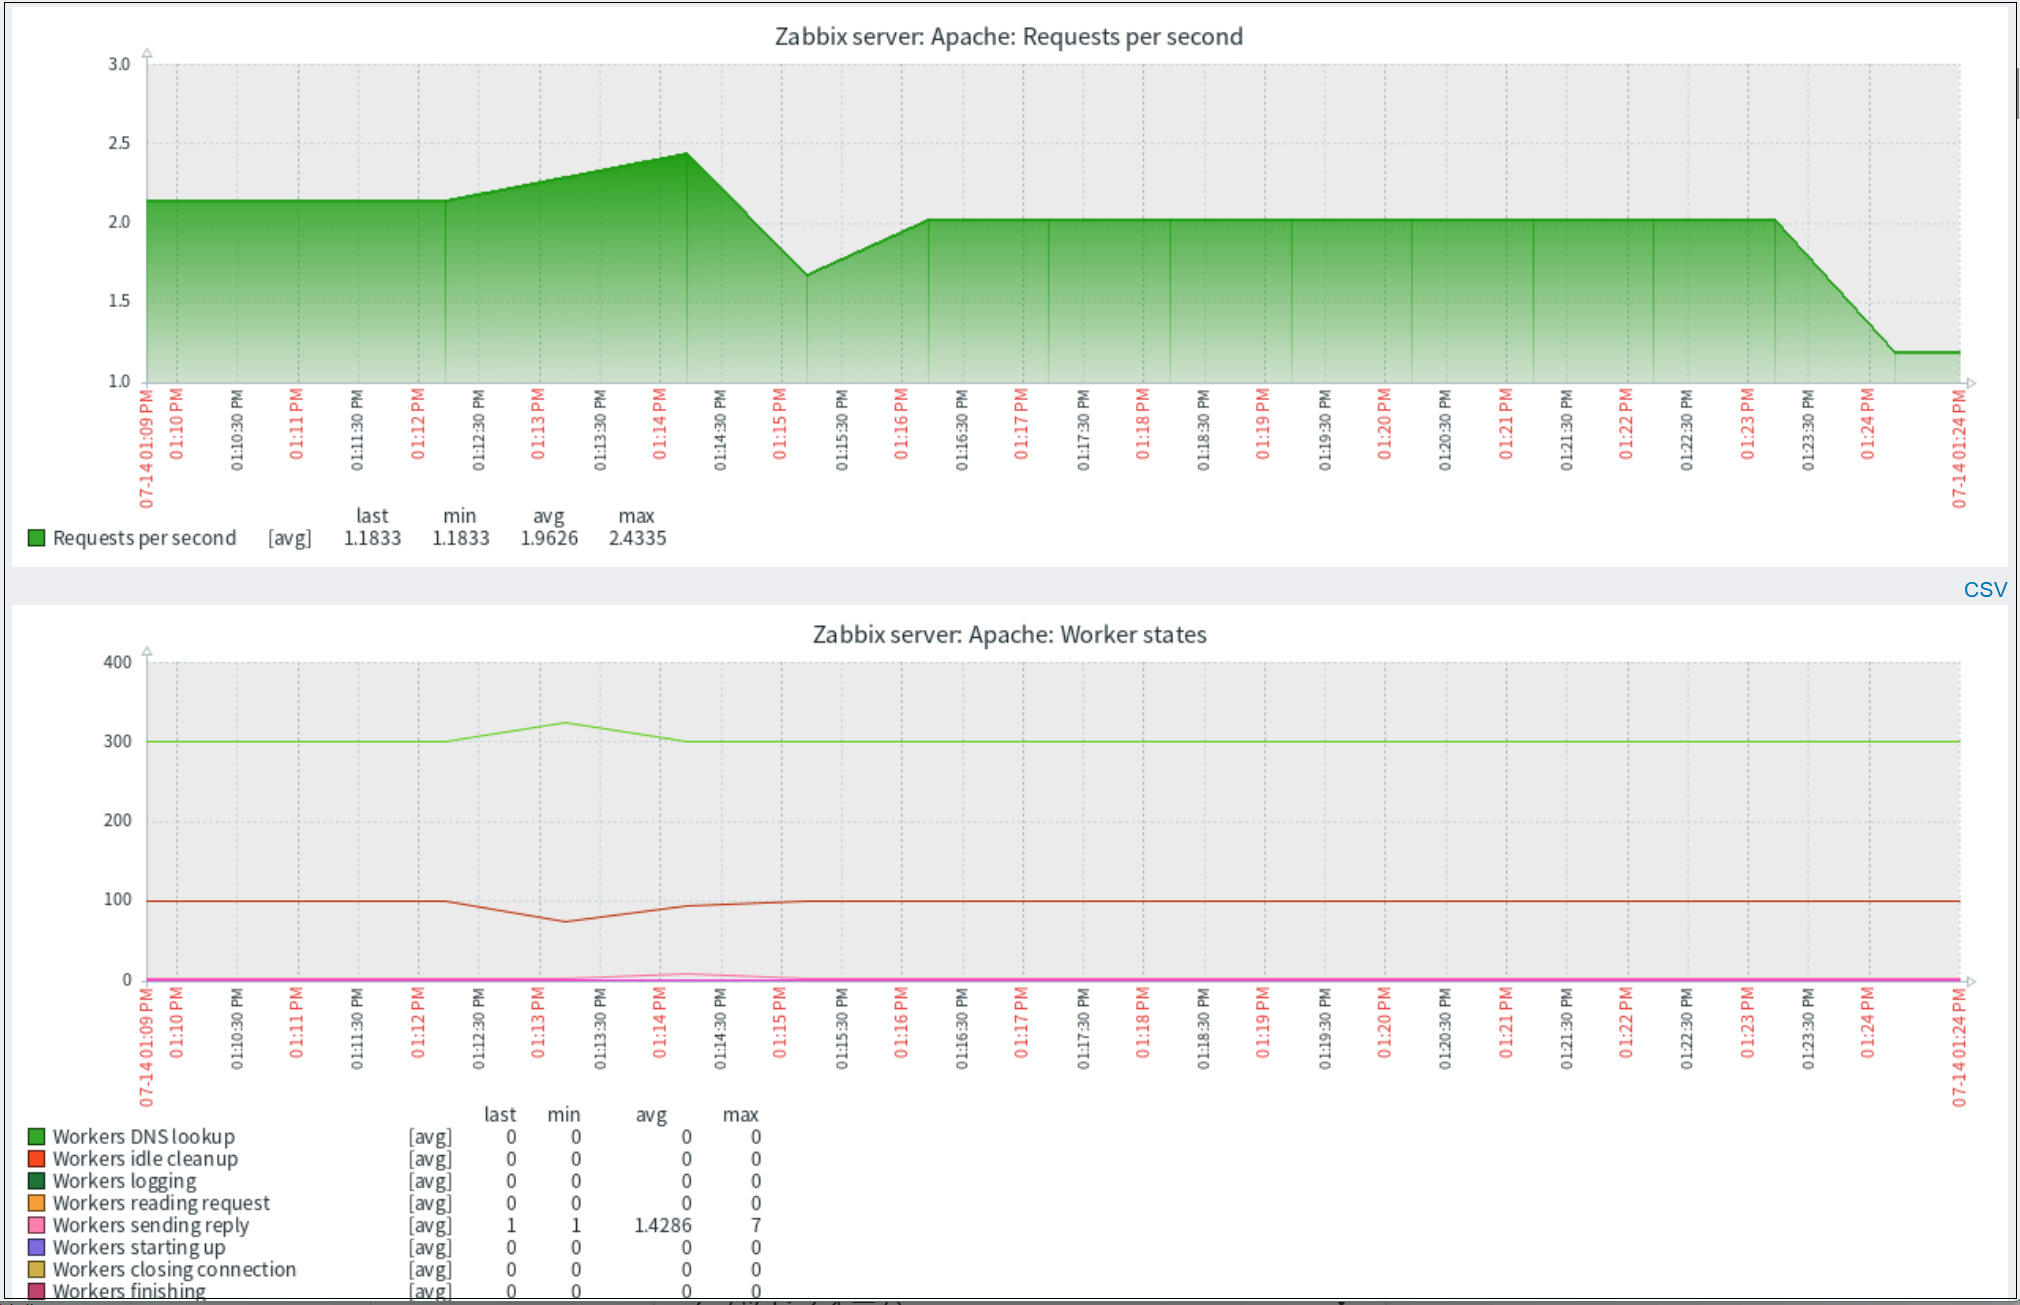
This time we will add Apache httpd service on Zabbix server to be monitored
① Enable server-status in Apache httpd on monitored Zabbix server
|
1 2 3 4 5 6 7 |
Create New # vi /etc/httpd/conf.d/server-status.conf <Location /server-status> SetHandler server-status Require local </Location> |
|
1 |
# systemctl reload httpd |
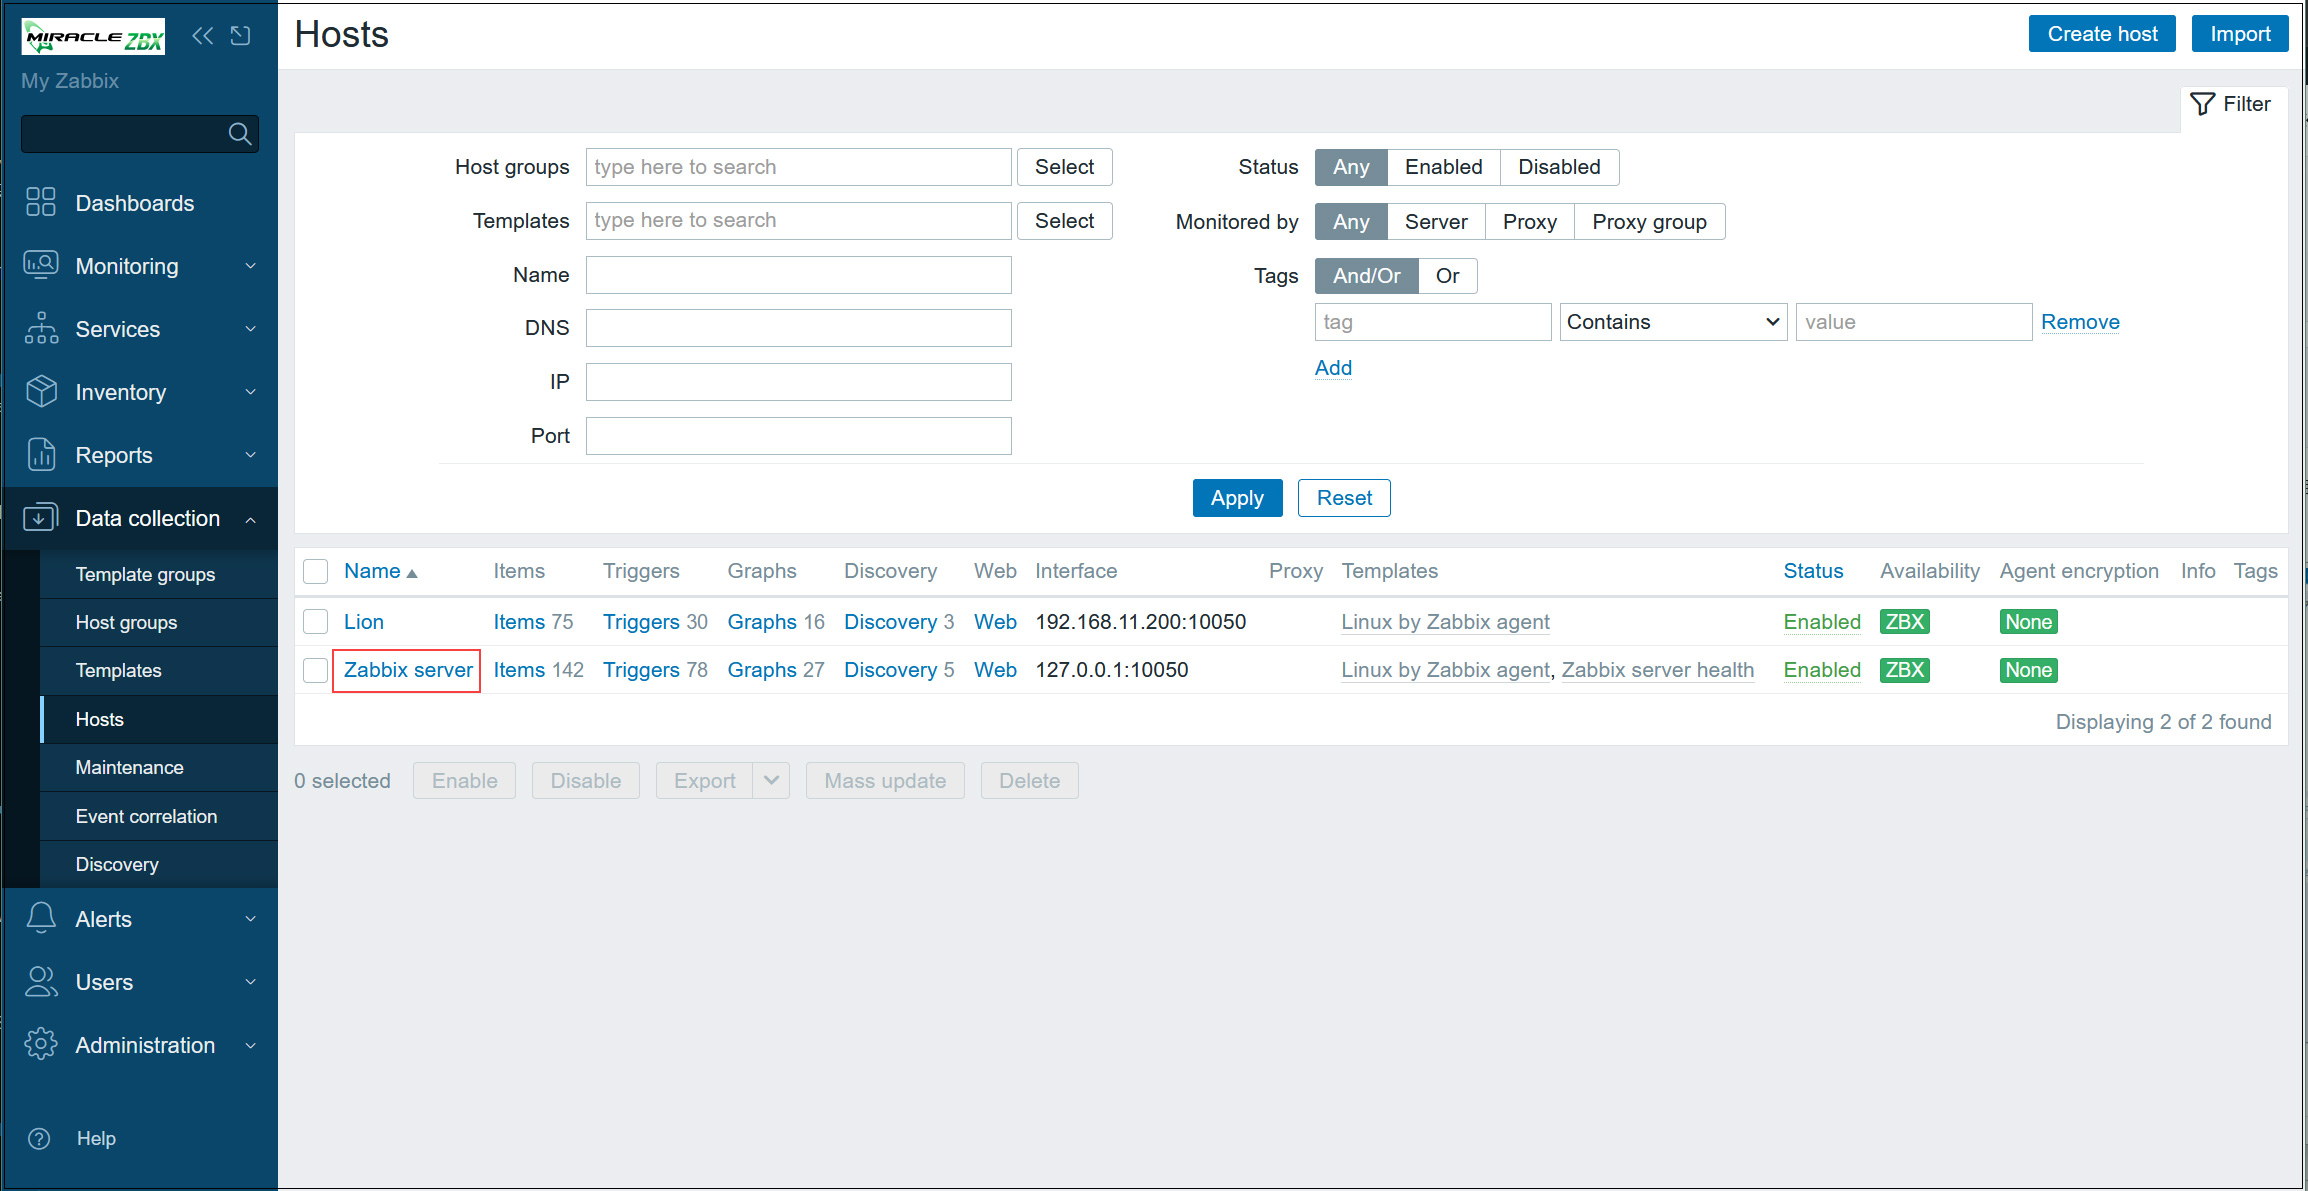
➁Log in to Zabbix administration site, in the left pane click on [Data collection] - [Hosts], in the right pane click on the host you want to add monitoring items for (in this case Zabbix server)
➂Click the [Select] button in the [Templates] section, then click the [Select] button again.
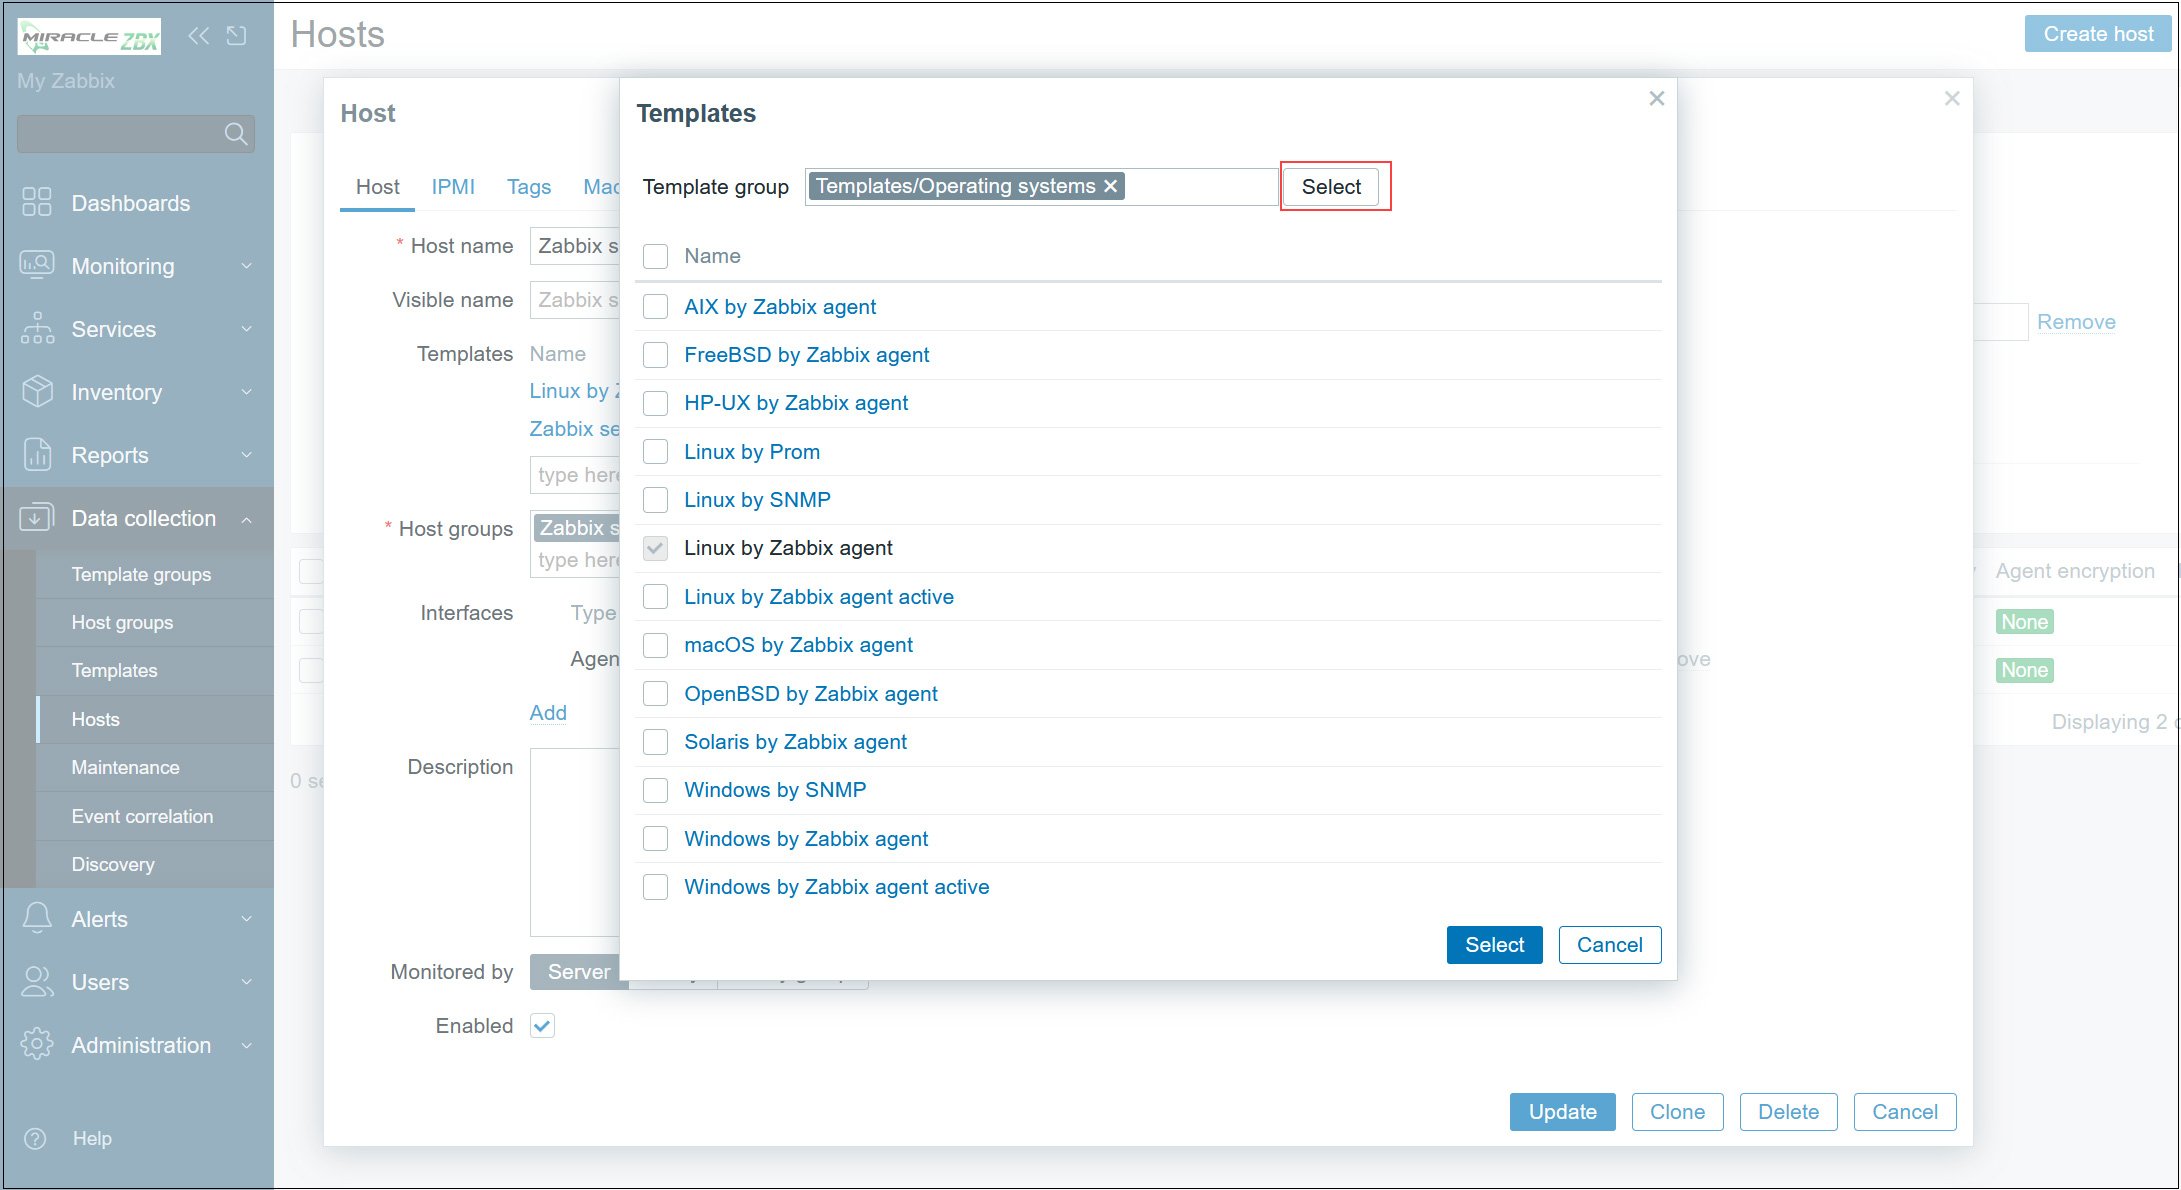
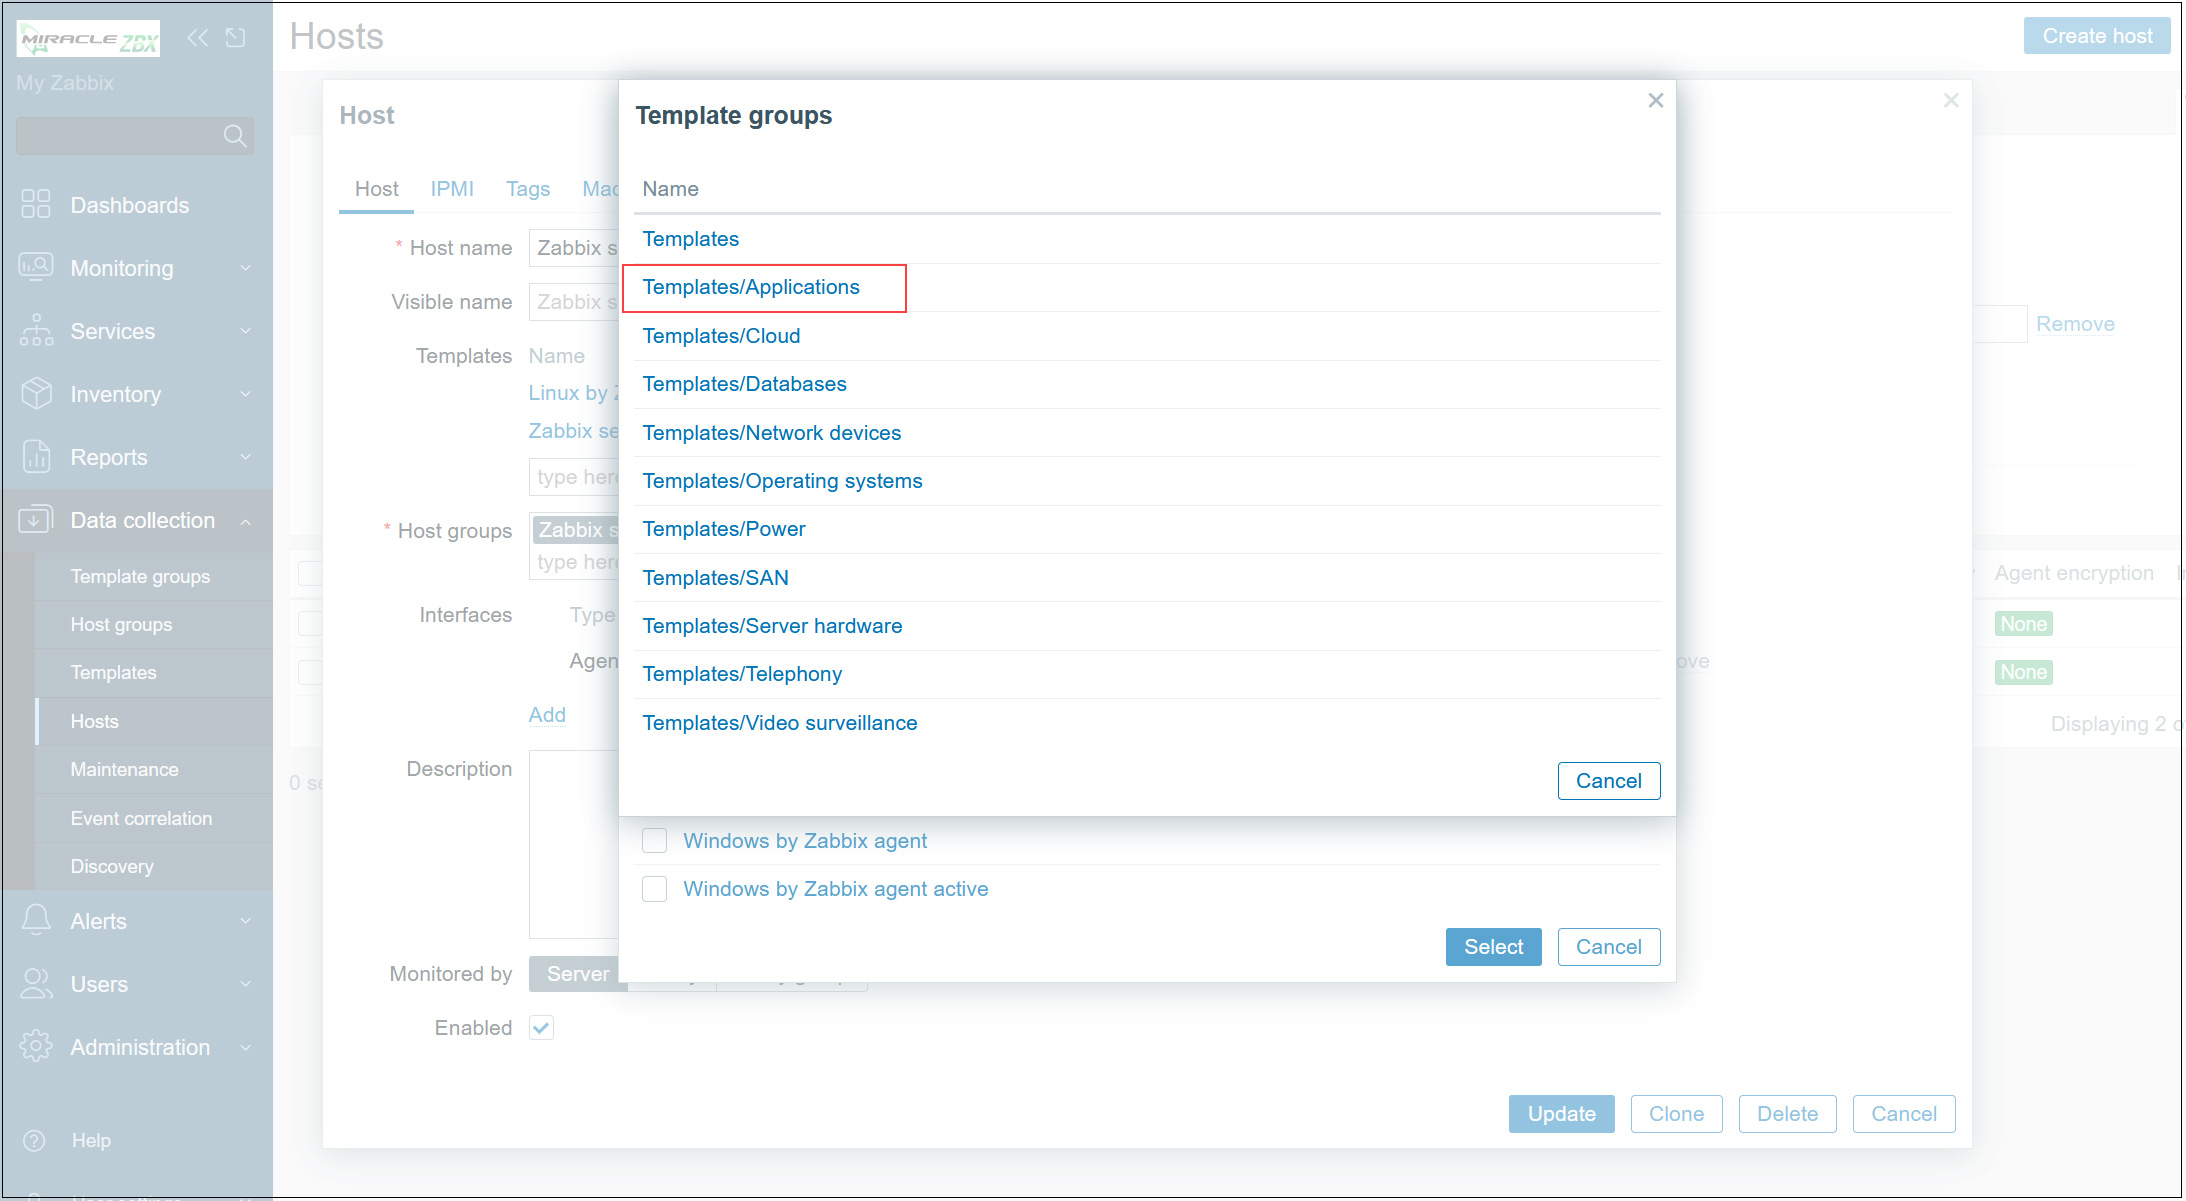
④Click on [Templates/Applications]
⑤Select [Apache by HTTP], then [Select]
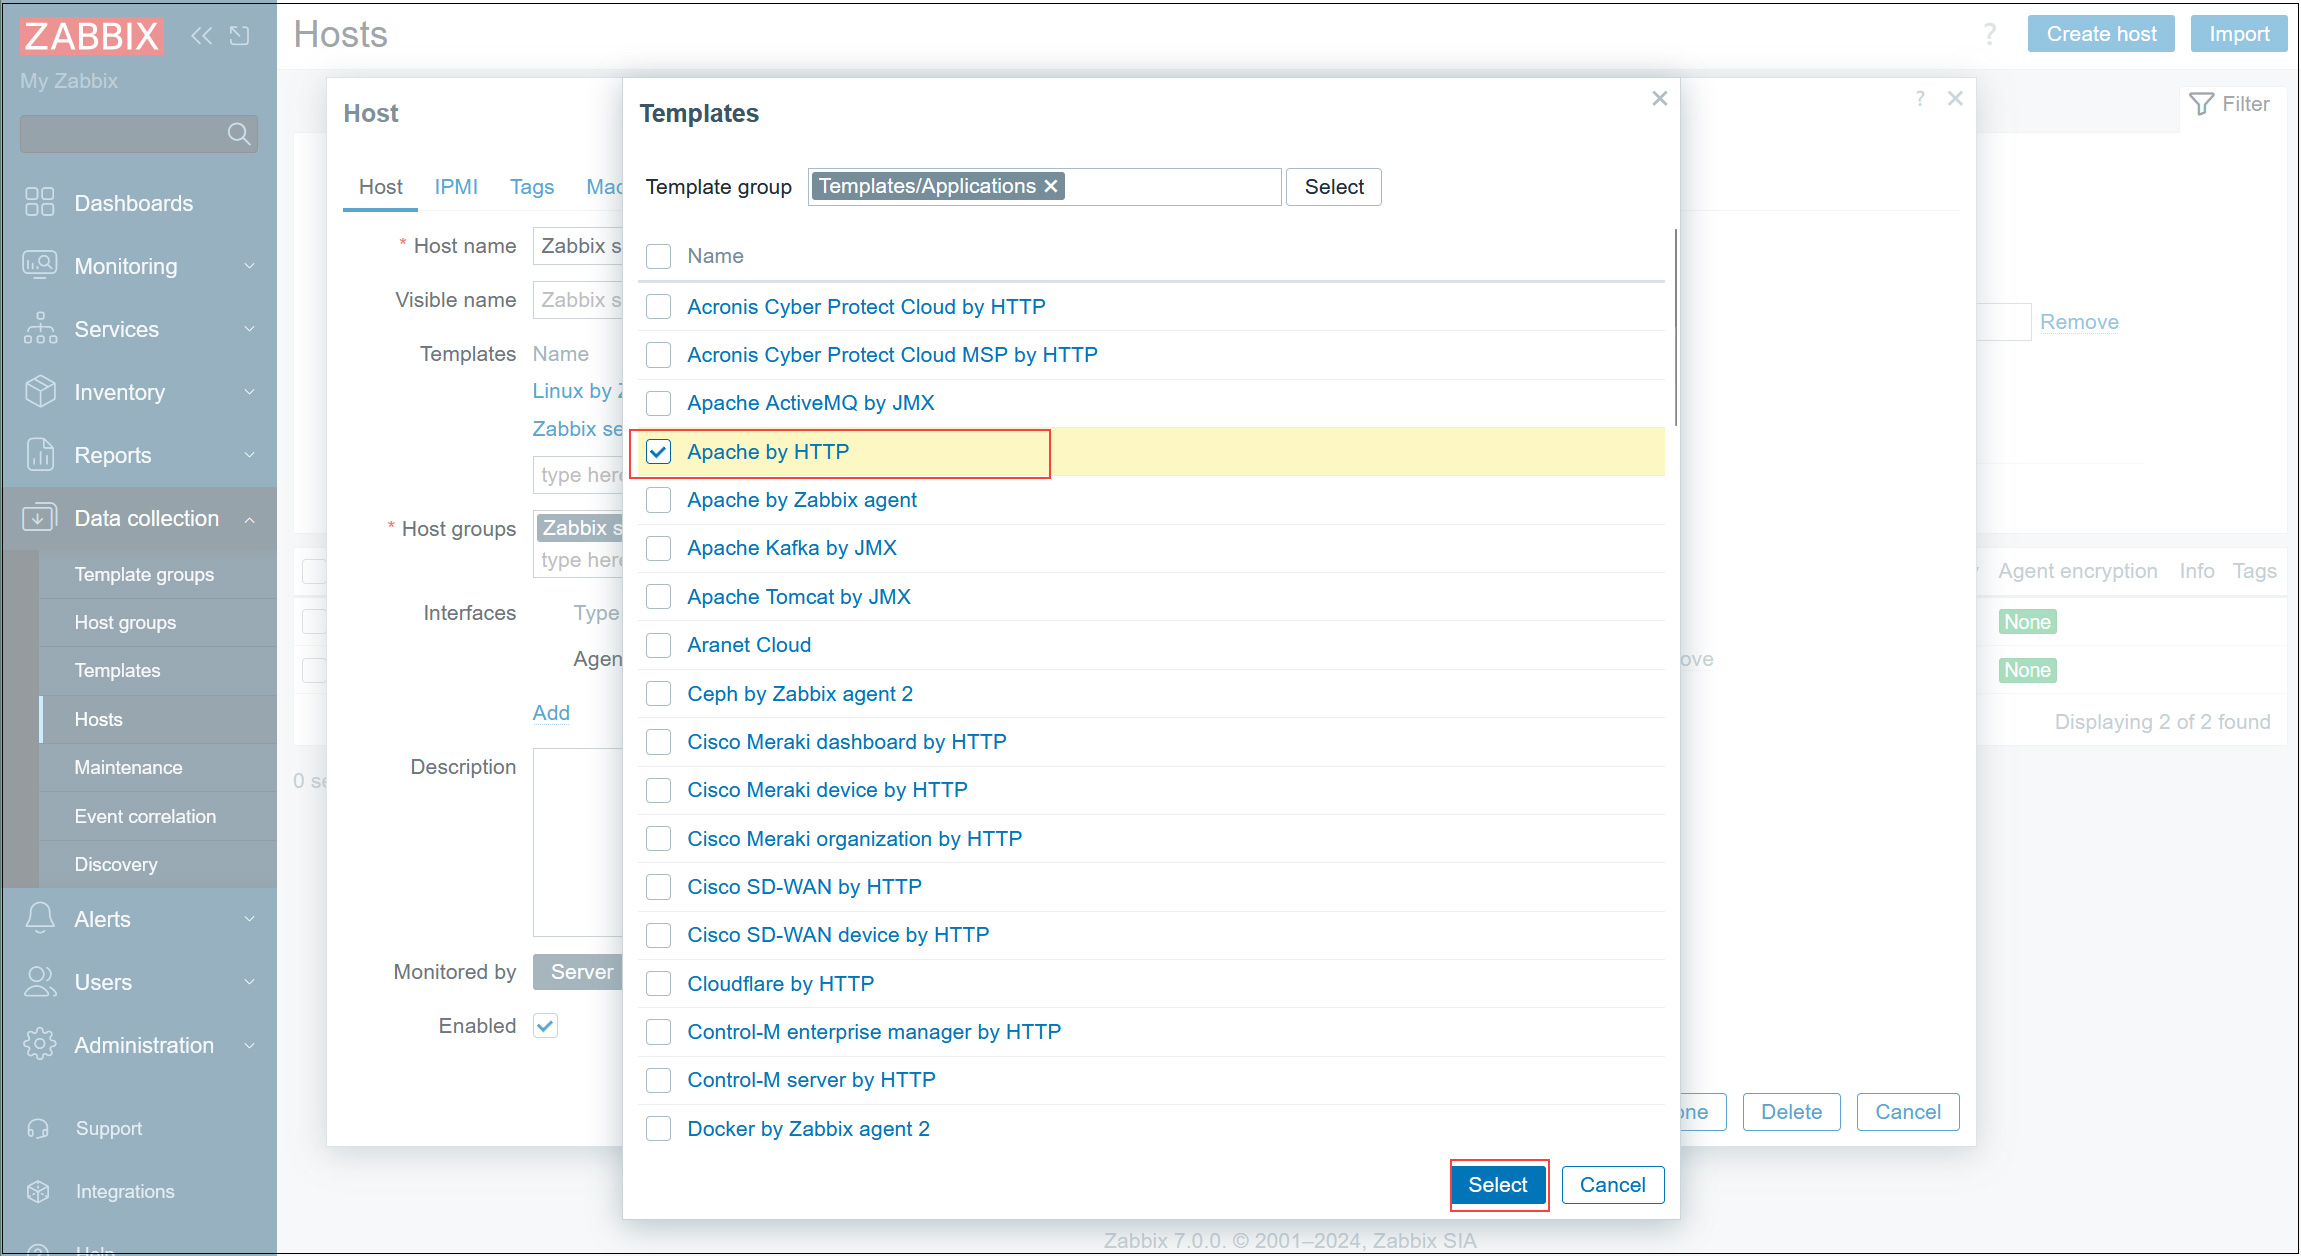
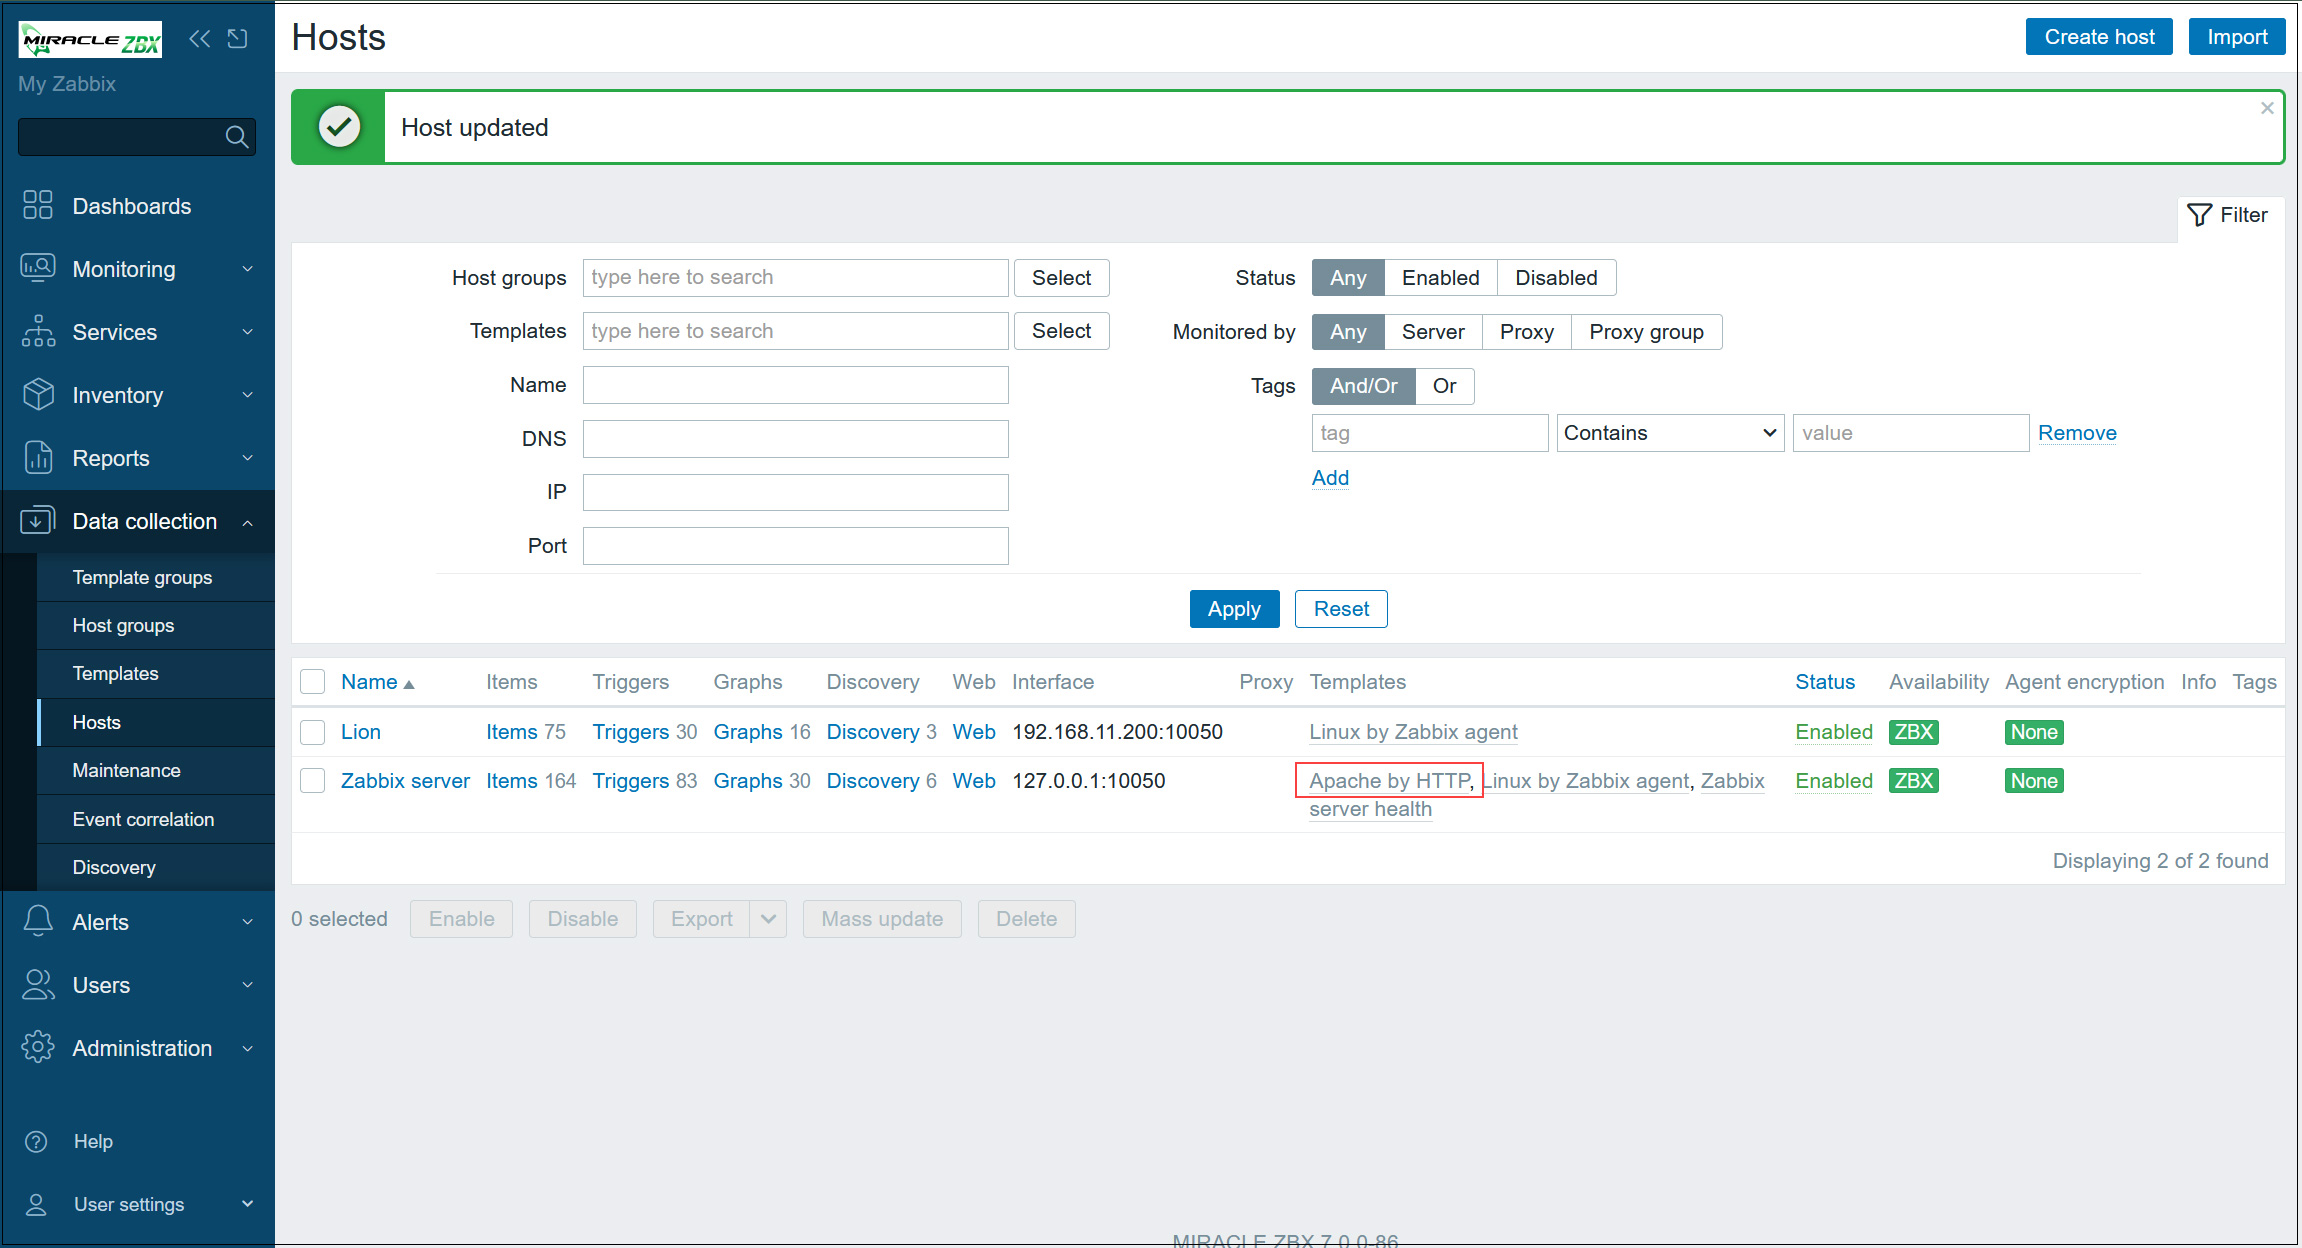
⑥Click [Update] button to update settings
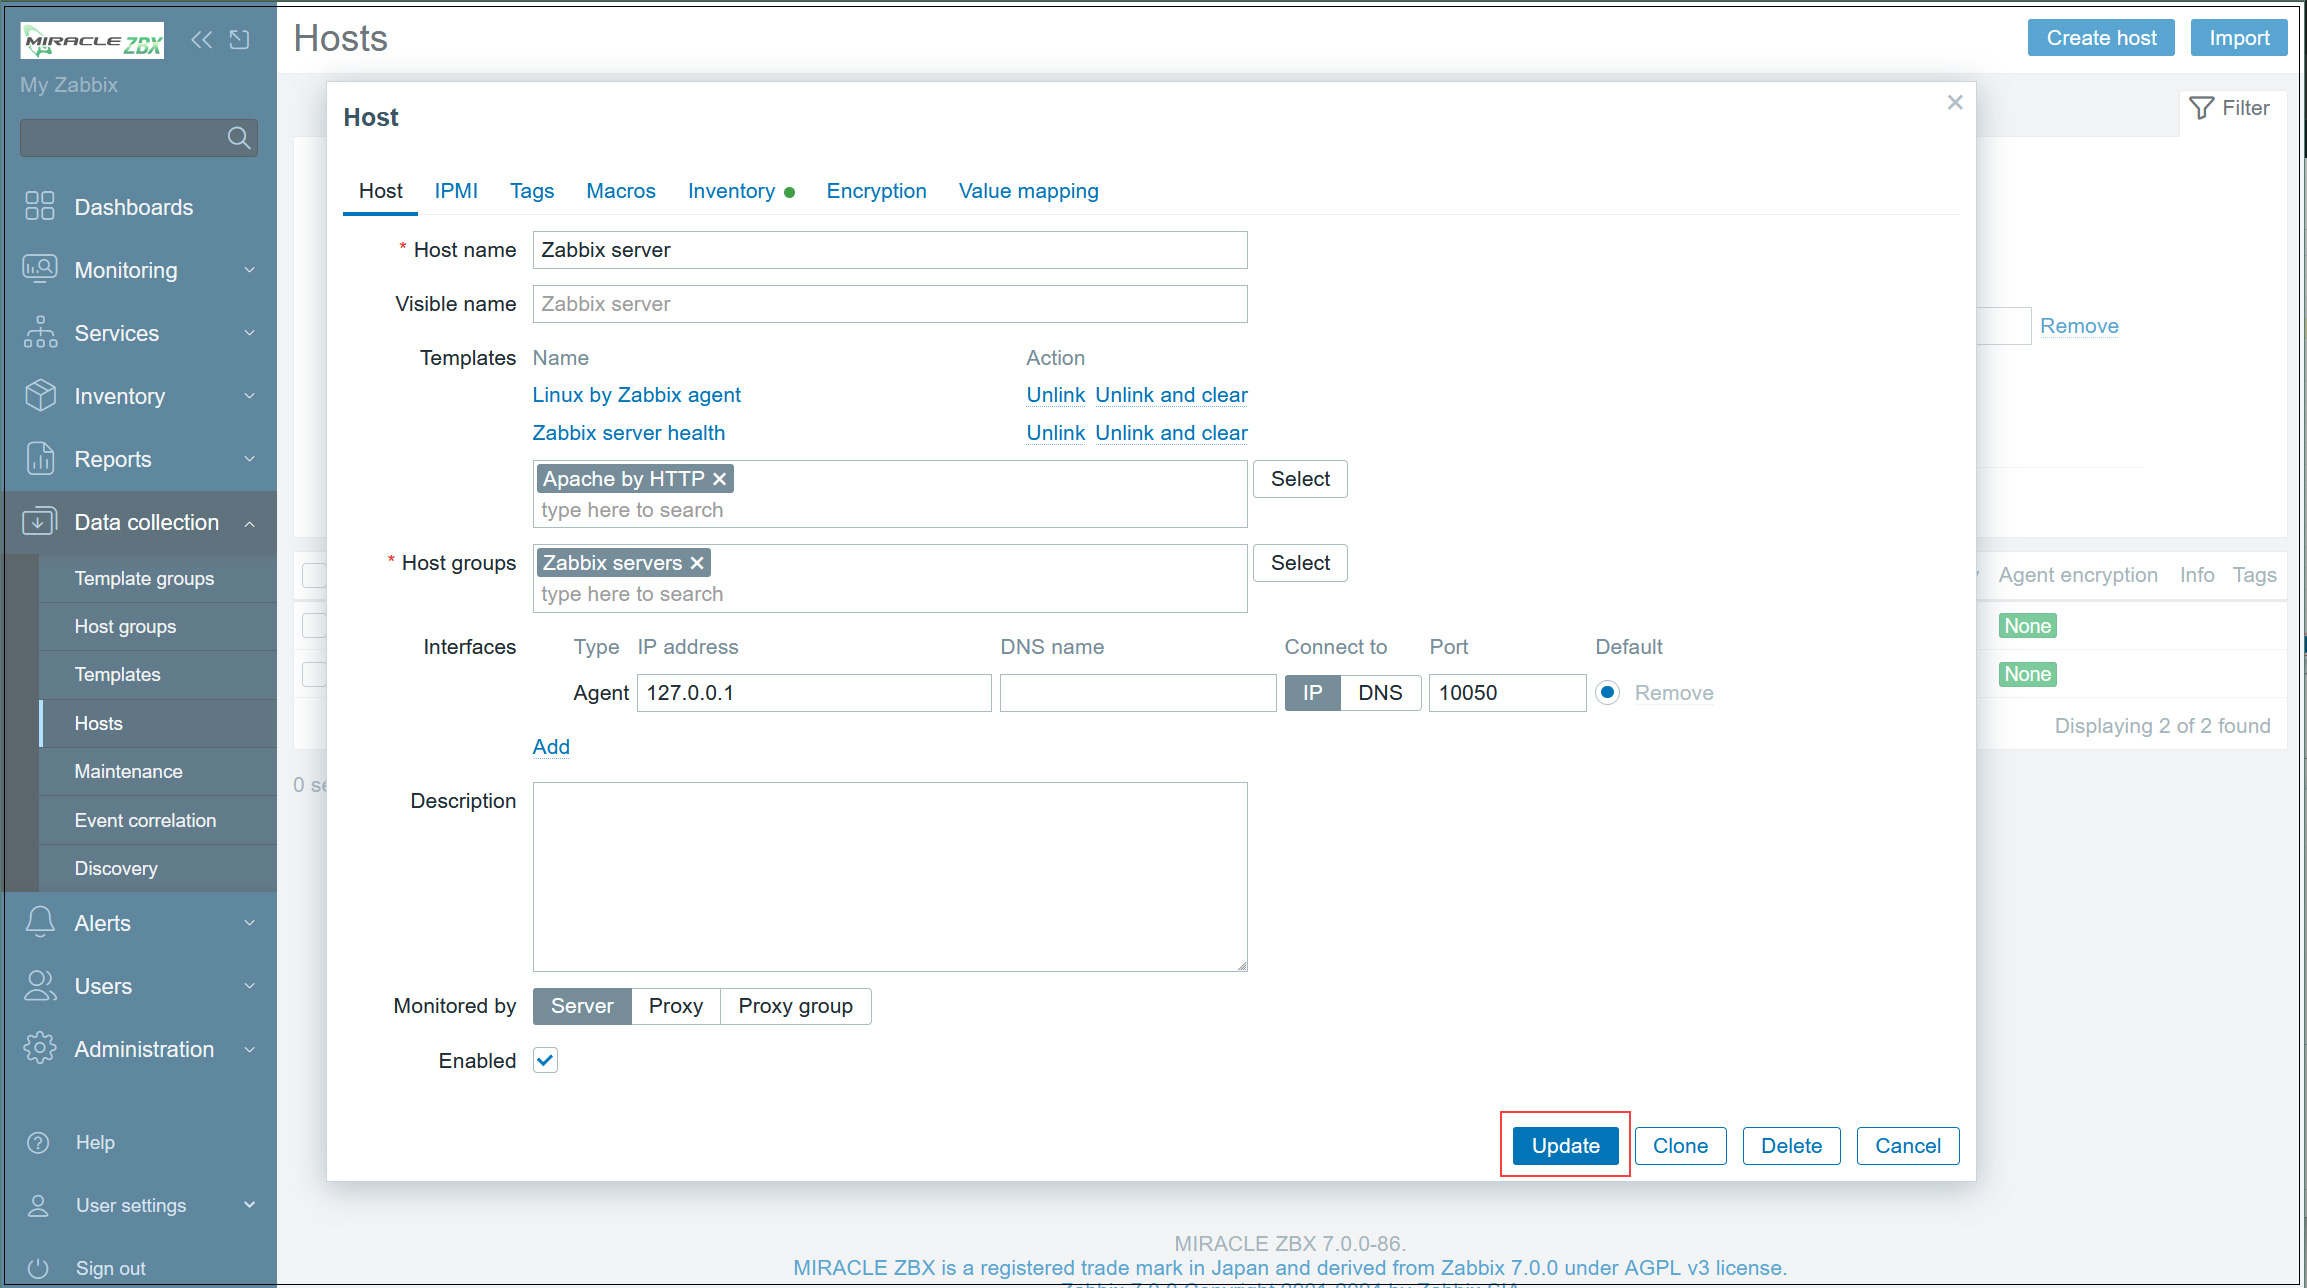
⑦Click the [Apache by HTTP] link.
⑧Open the [Macros] tab, enter [127.0.0.1] in {$APACHE.STATUS.HOST} and [Update]
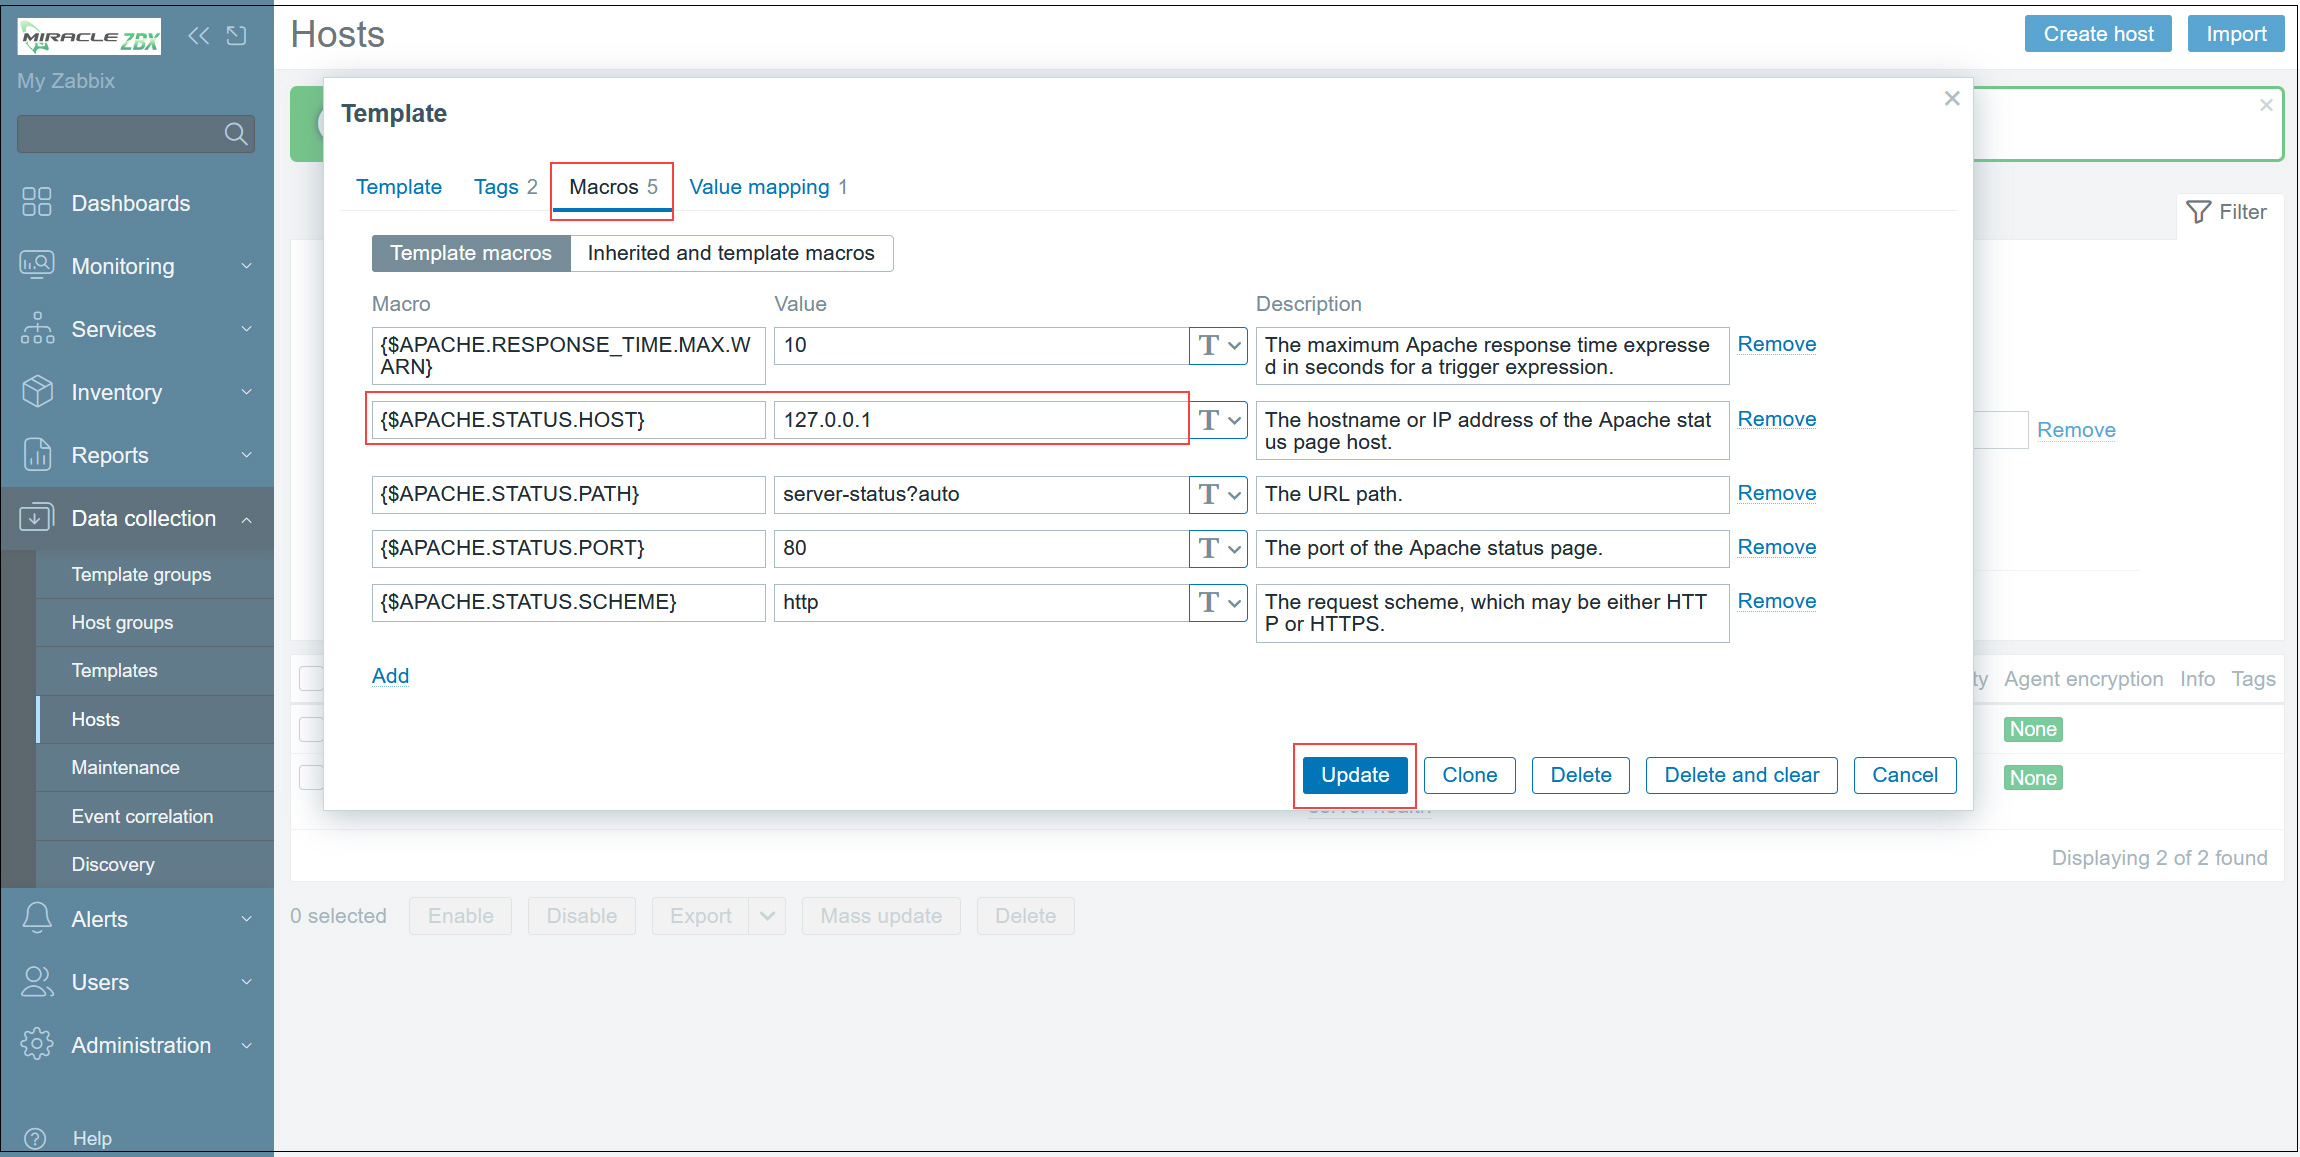
After a while, data will be displayed as shown in the figure below.